Volume MA * Fibo levelsIn the scrypt above, the SMA of Volume is taken as a basis and the Fibonacci levels are calculated.
This can be useful for analyzing the trend in accordance with changes in volume.
Any feedback is appreciated!
Good luck with your trading!
ابحث في النصوص البرمجية عن "volume"

Volume Changes with Bollinger Bands & Signal/AlertJapanese below / 日本語説明は下記
---------------------------------------------
Hello traders,
This indicator shows volume changes in percentage over the past periods as well as Bollinger Bands of volume changes with +2σ band.
The formula to calculate volume changes is;
(Today’s volume / average volume of past n periods ) *100
** n is user input
Bar color changes to green if close >= open, else if red.(You can change colors.)
Bollinger band
The reason I included Bollinger band here is if volume changes crosses over +2σ bands, that would suggest strong buying or selling pressure behind which might contribute price surging or dropping.
The following chart is BTCUSD daily chart.
Some correlation between volume changes and price movement can be observed.
For example, when volume changes surpasses BB+2σ with green bar, bullish trend occurs while in case of red bar, bearish trend happened.
Signal/Alert
Signal can be shown when volume changes cross over BB +2σ or upper band.(% changes, user input) Alert condition is same.
——————————————
出来高変化率のインジケーターです。過去n期間の出来高平均と当日出来高を比較してオシレータとして表示するとともに、出来高変化率のボリンジャーバンド+2シグマバンドを表示します。
出来高変化率の計算式は以下の通りです。
(当日出来高 / 過去n期間の平均出来高) * 100
* nはユーザ指定
終値>=始値の場合は緑色のバーで、終値<始値の場合は赤色のバーで表示します。(色は変更可能)
ボリンジャーバンド
出来高変化率が、出来高変化率のボリンジャーバンド+2シグマを超えるということはそれだけ強い買い・売りの存在を示唆していることになるのではと考え表示可能なようにしています。
以下のチャートはビットコイン/米ドルの日足チャートです。
例えば出来高変化率がBB+2シグマを超えて陽線で引けた場合、以降上昇トレンドが発生していることが確認できます。同様に出来高変化率がBB+2シグマを超えて陰線で引けた場合は下降トレンドが発生していることが確認できます。
これらは裏に強い買い、売り圧力が存在していることを示唆していると読み取ることができます。
ボリンジャーバンドが不要な場合は、出来高変化率のアッパーバンド(%, ユーザ指定)を表示して、変化率の度合いを測ることが可能です。
シグナル/アラート
出来高変化率がボリンジャーバンド+2σを超えた場合、もしくはアッパーバンドを超えた場合にシグナル表示します。
同じ条件でアラート設定も可能です。

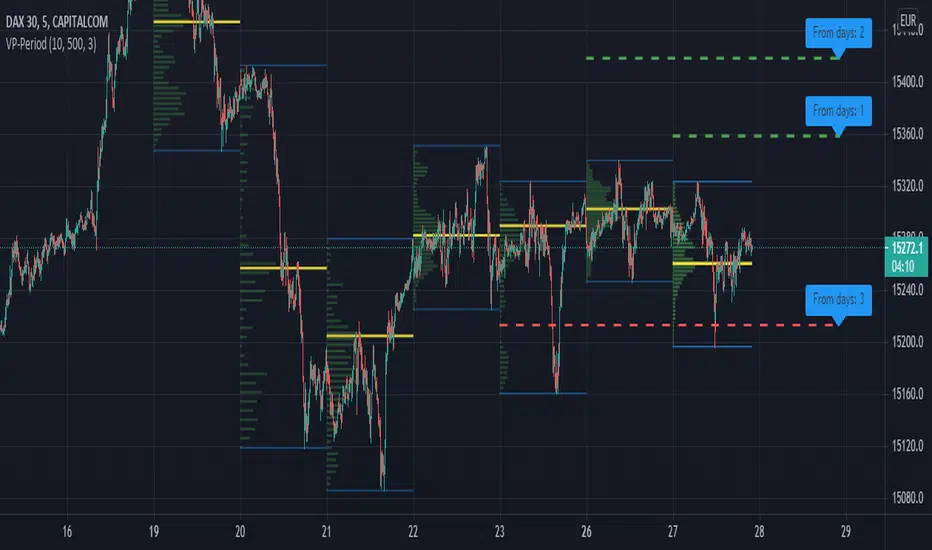
Volume Profile per day with support/resistance linesThis indicator shows the volume profile by daily blocks and draws on the chart the support or resistance lines produced by the previous volume profile block. A support line will be created if in the previous block, the VPOC line was closer to the lowest price line of that block. This support line will be placed below the VPOC line, at a distance equal to the difference between the highest price of that block and the VPOC price. For the case of the resistance line, the logic applied is analogous.
These support and resistance lines are introduced because, according to the Gaussian bell, the VPOC is likely to be located in the middle, and these deviations can be used to trace support and resistance.
In addition, the indicator includes the following features:
- Change the colors of all plotted lines.
- Define the number of daily blocks to be displayed.
- Define the resolution when calculating the volume of each candle.
- Define the number of support/resistance lines to be displayed.
- Highest and lowest price lines, as well as vpoc line, volume histogram and support and resistance lines.
- Display or not, the vpoc line and the volume histogram.
The calculations performed by the script improve if the candles used are of a lower timeframe. This indicator has been tested in several markets, including cryptos, CFDs, Forex and Indices.
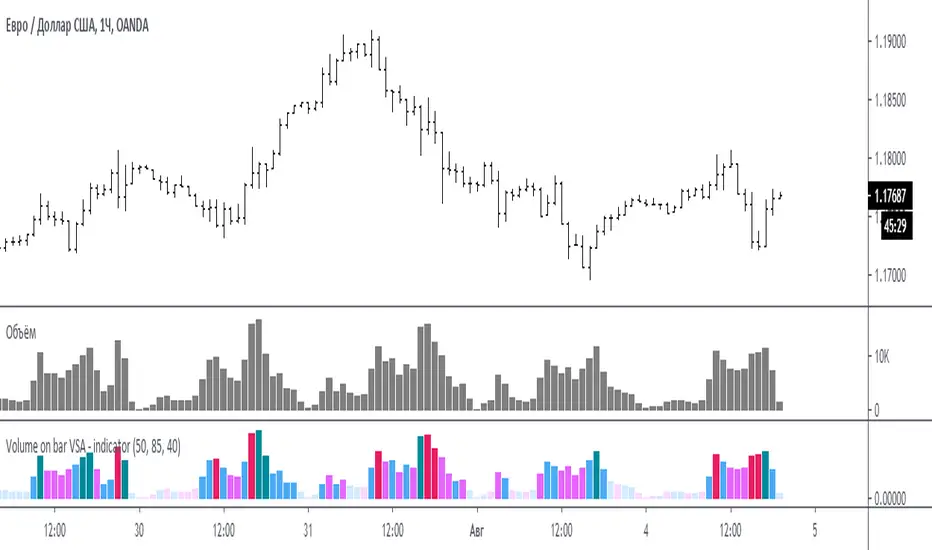
Volume on bar VSA - indicator V2Google translate.
This indicator compares the volume with its average value and tints it depending on whether the tail on the bar is bullish or bearish.
In the settings you can set (sensitivity) for tinting volumes of high and medium
Этот индикатор сравнивает объем со средним его значением и подкрашивает его в зависимости от того какой хвост на баре, бычий или медвежий.
В настройках можно задать (чувствительность) для подкрашивания объемов повышенных и средних
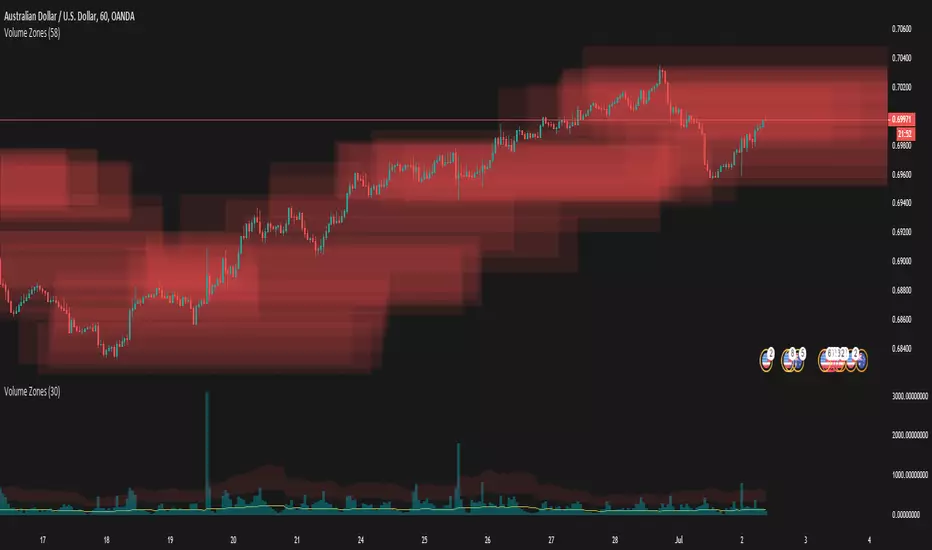
Volume ZonesThis a script that shows where price is trapped in the market based on the volume traded
The plots uses pixels. To correctly see the zones, adjust your zoom and set your level density appropriately
Volume Based Price Oscillator (buy and sell signal)This oscillator determines the buying and selling balance based on current price movements and volume.

Volume Supply and Demand ZonesDraws supply and demand zones of 3 types, based on 3 different volume threshold parameters.
The timeframe of the script is fixed (you can change it in the options), so for example it is possible to keep Daily S/D zones while looking at 1h chart.


VolumeS as stochv1just to show a concept . I use volume S to make it as stoch and add to it MTF function
B=buy
S=sell
D=down
if you do not like the MTF fuction just remove it from code or put the time frame of graph to be exact as MTF one
I did not add alert as it just a concept idea , to make it more complex it easy if you add more indicators to it and then compare the signals
have fun

Volume average for up bars and down bars separatelythis easy script describes what happens with down bars and up bars in volume.

EdgeAnalysisGroup: Volume BarsVolume painted bars to show primary trends and short-term floats during low volume.

Volume Profile [Stansbooth]Volume Profile
What This Indicator Does ?
Volume Profile displays how trading volume is distributed across price levels for a selected period.
Instead of showing volume per candle only, it shows **where price attracted the most volume**, helping traders identify **important price zones**.
The indicator dynamically builds a **horizontal volume profile** using historical candle data and visually presents it behind price candles.
📊 Volume Profile Calculation Logic
* Volume is distributed across price levels based on how much of each candle overlaps a price row.
* Each candle’s volume is split equally across the price levels it touches.
* Bullish candles contribute volume to the **Buy Volume** array.
* Bearish candles contribute volume to the **Sell Volume** array.
* Total volume per level = Buy Volume + Sell Volume.
This creates a **precise volume-at-price profile**.
⏱️ Profile Period Modes
You can choose how the volume profile is calculated:
* **Visible Range** – Profile is calculated for all currently visible bars
* **Daily** – New profile starts each trading day
* **Weekly** – New profile starts each week
* **Monthly** – New profile starts each month
* **Session** – Profile resets on each new session
When a period ends, the completed profile is drawn and a new one starts automatically.
---
🎯 POC & Value Area Logic
* **POC (Point of Control)**
* The price level with the **highest traded volume**
* Drawn as a horizontal line across the profile
* **Value Area**
* Covers the percentage of total volume defined by **Value Area %**
* Starts from the POC and expands upward and downward until the target volume is reached
* Areas outside the Value Area are visually dimmed
📐 Profile Drawing Behavior
* The profile width is proportional to volume strength:
* Higher volume = wider bar
* Lower volume = narrower bar
* Profile width is calculated using **time-based scaling**, ensuring stability across all timeframes
* Profiles can be placed on the **left or right side** of the chart
* Multiple past profiles can be displayed (limited by settings)
🕯️ Candle Volume Visualization
* Candle colors are dynamically adjusted based on **relative volume**
* Higher-than-average volume candles appear more intense
* Lower-volume candles appear more transparent
* Optional volume text can be displayed above candles
This helps visually confirm **strong vs weak price moves**.
🔍 High Volume Spike Detection
* Detects candles where volume exceeds a user-defined multiple of the 20-bar average
* Such candles are marked with a visual symbol below the bar
* Useful for spotting:
* Breakouts
* Institutional participation
* High-interest zones
📊 Bottom Volume Chart Logic
* Displays a volume histogram at the bottom of the chart
* Volume bars are dynamically scaled to price range
* Bullish and bearish candles use different colors
* Uses plot & fill logic, allowing **unlimited historical volume display**
🧭 How to Use This Indicator
1. **Identify High-Volume Zones**
* Use the widest profile areas to find strong support and resistance
2. **Trade Around the POC**
* Price often reacts, consolidates, or reverses near the POC
3. **Use Value Area for Bias**
* Price above Value Area → bullish bias
* Price below Value Area → bearish bias
4. **Confirm Moves with Candle Volume**
* Strong moves with high volume are more reliable
* Weak moves with low volume may fail
5. **Watch Volume Spikes**
* Spikes often precede major moves or reversals

Volume with High-Volume Highlight + ThresholdThis indicator highlights true high-volume candles without guessing.
It compares the current bar’s volume to the average volume over the last X candles and highlights bars that exceed your chosen threshold (ex: 1.5× the average).
Features
Automatic high-volume detection
Customizable volume multiplier
Bull/bear color coding
Average volume line
Threshold line (shows exactly where “high volume” begins)
Optional on-chart label showing the required volume level
Alert for any high-volume bar
What It’s Used For
Identifying breakout strength
Confirming bounce setups at key levels
Spotting real buyers/sellers stepping in
Avoiding fake moves with weak volume
Simple Rule
If volume is greater than (Average × Multiplier) → the bar is highlighted.

Volume Color Candle 📊 Volume Color Candle — Advanced Market Strength Visualization
Volume Color Candle is a powerful and visually enhanced tool designed to help traders instantly identify high-impact volume events, body-size anomalies, and market imbalances directly on any chart.
This indicator uses Z-Score statistical modeling to classify candles into Normal, Large, and Extreme categories — giving traders a deeper understanding of momentum, volatility, and unusual market activity.
🔍 Key Features
✅ Multi-Source Outlier Detection
Choose what drives the signal:
Volume
Body Size
Any (either becomes an outlier)
All (both must confirm)
This flexibility helps highlight genuine strength or weakness in price action.
🎨 Dynamic Candle Coloring
The script colors candles based on statistical threshold levels:
Normal Moves
Large Moves
Extreme Moves (High Impact)
You can display them as colored bars or full candles, depending on your charting preference.
📉 Low Volume Detection
Spot weak or imbalanced price moves with a dedicated low-volume algorithm:
Highlight candles with unusually low participation
Option to only show candles where volume is low but body is large (imbalance conditions)
Perfect for identifying fake breakouts or trapped liquidity zones.
⚙️How to use :-
default color schemes:
- Blue -> excheme bullish imbalance
- Green -> large bullish imbalance
- Black -> excheme bearish imbalance
- Red -> large bearish imbalance
- yellow -> low volume bars, indicates "balance", after which volatility usually increases and tends to continue the previous trend
🔔 Built-in Alerts
Receive instant alerts when the script detects:
Extreme Outlier Activity
Large Outlier Activity
Ideal for catching volatility spikes, early trend acceleration, or institutional-level moves.
🎯 What This Helps You Identify
Momentum surges
Volume-based breakouts
Manipulation or low-volume traps
Extreme candle events
Trend strength vs weakness
Liquidity pushes and imbalance signals
This makes it a highly valuable tool for scalpers, intraday traders, swing traders, and anyone relying on volume-price analysis.

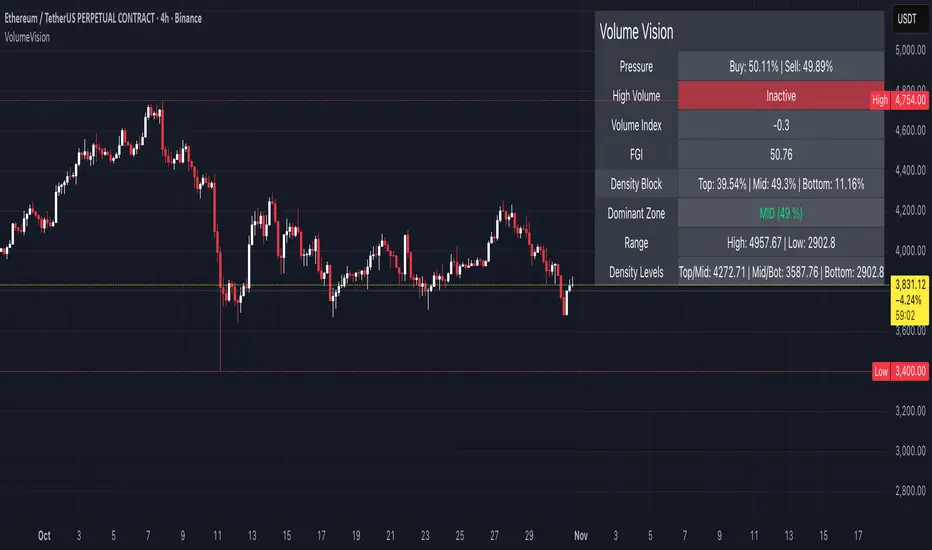
Volume VisionVolume Vision is a precision volume-analysis system that exposes how trading activity is distributed inside the current market range.
It divides the active price structure into three live zones — Top, Middle, and Bottom — and measures where real participation is concentrated.
This creates a dynamic “volume map” that allows you to instantly see whether the market is being driven by accumulation, distribution, or equilibrium.
At the heart of the indicator is a fully original implementation of the FGI — a proprietary composite metric designed to read market emotion and internal pressure.
It transforms several hidden components — volume, volatility, dominance, and directional momentum — into one unified curve of sentiment.
FGI values around 30 typically reflect phases of fear, capitulation, and potential accumulation.
Values near 80 mark conditions of greed, overextension, and possible distribution.
Observing these boundaries helps detect when the market is preparing to shift from compression to expansion or from euphoria to cooling.
Core Functions
Density Zones: Splits recent price movement into Top / Mid / Bottom areas, quantifying volume within each.
Dominant Zone: Highlights where the major share of liquidity currently resides.
Pressure Meter: Shows the balance between buy and sell volume in real time.
Volume Index: Normalizes present volume activity against its historical range to spot abnormal behaviour.
FGI Reading: Custom sentiment curve ranging from fear (≈ 30) to greed (≈ 80).
Alerts: Optional signals for High Volume and Rising Volume moments.
Dashboard: Compact on-chart table that summarizes all key readings without cluttering the view.
Interpretation Guide
When FGI drops near 30, the market often forms accumulation bases or bottom structures.
When FGI climbs toward 80, momentum usually reaches its limit and profit-taking or distribution begins.
A dominant Top zone with strong sell pressure indicates distribution, while Bottom dominance with buy pressure suggests accumulation.
Mid-zone dominance with neutral FGI reflects balance — a state of indecision before the next move.
Watch for volume spikes accompanied by FGI shifts: these often precede major impulse starts or ends.
Style: non-repainting core, minimal visuals, real-time clarity.
Created for traders who need to see where the energy is flowing, not just what price is printing.
by MahaTrend
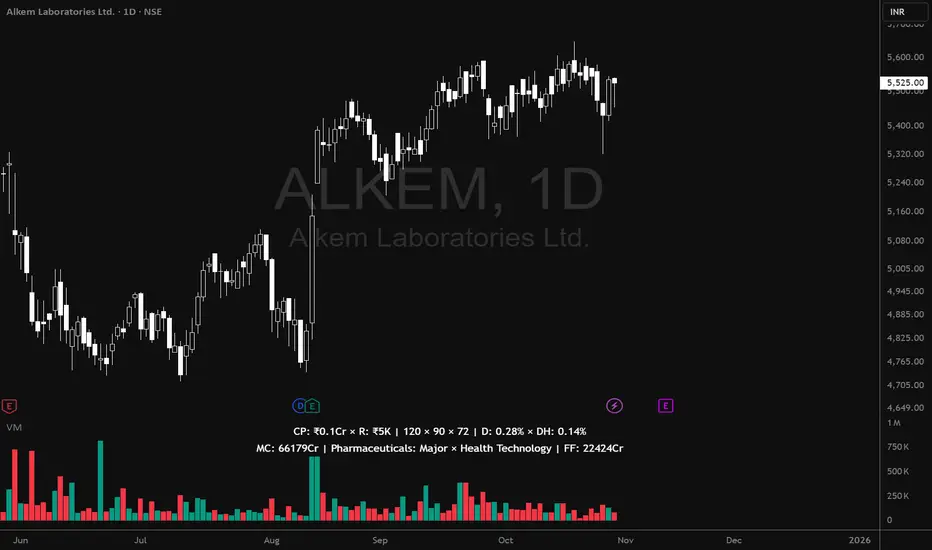
Volume MatrixVolume Matrix (VM) is a comprehensive volume and position-sizing toolkit designed to help traders interpret market participation and manage trade risk efficiently.
It combines volume analytics, risk-adjusted position sizing, and stock-specific financial data — all in a clear, visual, and automated format directly on TradingView charts.
The indicator integrates capital management, episodic volume spikes, and market capitalization data into a single, intuitive framework, giving traders an edge in both decision-making and discipline.
⚙️ Core Components & Features
🧩 1. Position Sizing & Risk Management
A dynamic risk table helps traders determine how much to trade and how much to risk per position, adapting automatically based on user inputs:
- Capital (CP): Total account size (₹ or $).
- Risk Mode (R): Choose between Percentage of capital or fixed Currency value.
- Lot Size Mode: Optional toggle to align quantities with F&O lot sizes (India-based).
- Standard Stop-Loss (SSL): Displays position quantities for three custom stop-loss levels (e.g., 0.75%, 1%, 1.25%).
- % Distance Metrics: D: Distance from day’s low/high (helps assess stop distance). DH: Distance from mid-body (useful for candle risk assessment). Auto-adjusts based on whether the trader is in Long, Short, or Both mode.
📈 Helps answer:
“How much quantity should I trade at my desired risk level?”
🔶 2. Volume Visualization
- Plots volume bars with default up/down coloring.
- Green for bullish bars.
- Red for bearish bars.
- Designed for quick visual differentiation of buying/selling pressure.
🚀 3. Episodic Pivot (EP) Detector
Identifies high-volume breakout or capitulation days, often marking significant turning points or trend initiations.
- Highlights bars where volume exceeds a custom threshold (in millions).
- Marks them visually with an orange triangle under the candle.
-Best used on daily charts to spot institutional footprints.
📊 Helps answer:
“Is today’s volume large enough to signal major institutional activity?”
🧾 4. Data Metrics Table
Displays fundamental and contextual data about the asset:
- Market Capitalization (MC): Auto-calculated using outstanding shares × price.
- Free Float (FF): Value of tradable shares in currency or Cr (INR).
- Industry × Sector × F&O Status: Shows the company’s industry and sector classification. Displays FC (Futures Contract) or NFC (Non-F&O stock).
- Customizable appearance: Choose between text/value display, text color, and background color. Flexible positioning and size control to suit any chart layout.
📚 Helps answer:
“What type of stock is this, how big is it, and does it trade in futures?”
🪄 5. User Interface Customization
- Modular UI grouped by functionality (Risk, Direction, Metrics, Volume, etc.).
- Flexible table position & size (Top/Bottom/Middle & Tiny–Huge).
- All elements are toggleable, giving full control over displayed data.
- Built to ensure visual clarity on any chart background.
| Trading Goal | How Volume Matrix Supports It |
| ------------------------------ | -------------------------------------------------------------- |
| **Risk Management** | Calculates optimal trade size and risk exposure automatically. |
| **Position Sizing Discipline** | Enforces consistent sizing across trades using SSL levels. |
| **Volume Confirmation** | Highlights institutional participation via Episodic Pivots. |
| **Stock Context Awareness** | Shows market cap, sector, and float value instantly. |
| **Efficiency** | Reduces manual work — no need for calculators or spreadsheets. |
💡 In Short
Volume Matrix simplifies trade planning, brings transparency to risk, and connects volume with context — all in one elegant visual tool.
Perfect for:
- Discretionary traders refining entries and sizing.
- Swing traders watching for volume-based pivots.
- Analysts who want price-volume fundamentals at a glance.
TR Volume Candles (Lite)Volume candles for your trading pleasure.
What it does
A lightweight recreation of Traders Reality’s “vector candle” coloring. It repaints the price candles (body, wick, and border) based on relative volume and spread×volume so you can spot high-activity bars at a glance—without the overhead of pivots, sessions, zones, or request.security calls.
Logic (matches TR)
Compute the average of the previous 10 bars’ volume (current bar excluded).
Compute volSpread = (high − low) × volume, and compare to the highest volSpread of the previous 10 bars (current bar excluded).
Color rules:
Green / Red (highest priority): volume ≥ 2× 10-bar average or volSpread ≥ highest of prior 10.
Blue / Violet: volume ≥ 1.5× 10-bar average (and not already green/red).
Regular: none of the above.
Colors (defaults align with TR)
Bull candles: Green (2× / spread×vol), Blue (1.5×), otherwise Light Gray.
Bear candles: Red (2× / spread×vol), Violet (1.5×), otherwise Dark Gray.
Why it’s fast
No external libraries, no symbol overrides, no multi-timeframe requests—just native series math on the current chart.
Inputs
Colors only (keep TR defaults or customize). Thresholds and lookback are fixed to TR standards to ensure identical behavior.
Alerts
“Any Vector Candle,” plus individual alerts for Green, Red, Blue, and Purple. For confirmed signals, set alert to Once per bar close.
Notes
Works on all timeframes.
Candle width is unchanged (uniform, as in your screenshot).
Heikin Ashi or other synthetic candle types will color based on those candles’ OHLC/volume; for strict equivalence, use standard candles.
Volume is exchange-feed dependent; anomalies (splits/halts) can spike the logic temporarily.
Use cases
Quickly highlight expansion bars that often precede/confirm momentum. Combine with your trend tools (EMAs, VWAP, MavilimW) or Darvas/box structures for context.

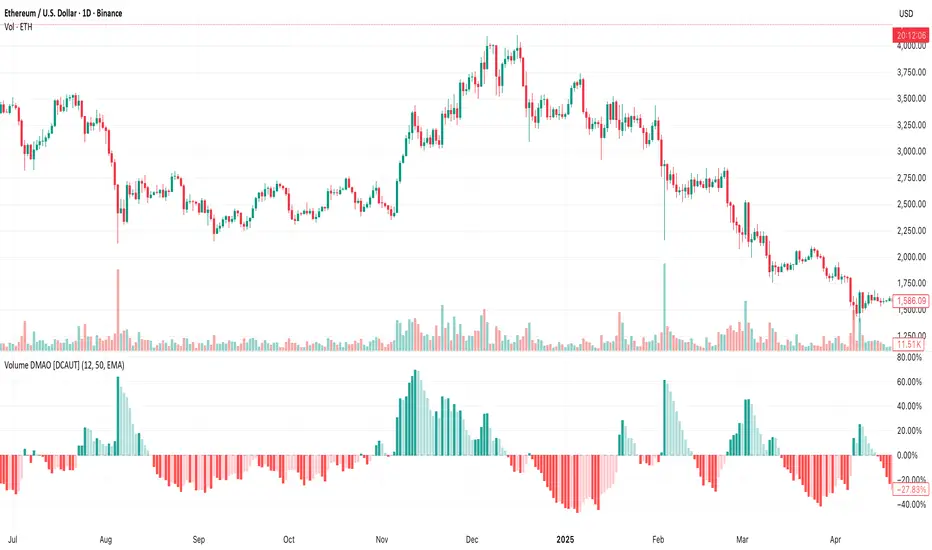
Volume DMAO [DCAUT]█ Volume DMAO Indicator
📊 OVERVIEW
The Volume DMAO (Dual Moving Average Oscillator) applies PPO-style calculation to volume data rather than price. It measures the percentage difference between fast and slow moving averages of volume, providing insights into volume momentum and market participation trends.
🎯 CONCEPTS
Signal Interpretation
Positive Values : Current volume above historical average (expansion phase)
Negative Values : Current volume below historical average (contraction phase)
Rising Trend : Volume momentum accelerating (increasing participation)
Falling Trend : Volume momentum decelerating (decreasing participation)
Primary Applications
Volume Confirmation : Validate price movements with volume momentum analysis
Divergence Detection : Spot potential reversals when volume diverges from price
Trend Strength : Assess volume participation in price trends
Entry/Exit Signals : Time trades based on volume momentum shifts
📋 PARAMETER SETUP
Input Parameters
Fast Length : Period for fast moving average (default: 12)
Slow Length : Period for slow moving average (default: 50)
MA Type : Moving average algorithm (default: EMA)
📊 COLOR CODING
Histogram Colors
Dark Green : Positive and rising (strong volume expansion)
Light Green : Positive and falling (weakening volume expansion)
Light Red : Negative and rising (recovering from volume contraction)
Dark Red : Negative and falling (strong volume contraction)
💡 CORE VALUE
Unlike traditional volume indicators, Volume DMAO provides normalized percentage readings that:
- Enable comparison across different timeframes and instruments
- Reveal volume momentum changes before price movements
- Identify market phases through volume participation analysis
VIM (Volume in Money)Volume in Money + MA (Short Numbers & Coloring)
This indicator visualizes the monetary volume traded in each candle, calculated as:
Money Volume
=
Volume
×
Close Price
Money Volume=Volume×Close Price
🔹 Features:
Plots bars representing the money volume (total traded value).
Coloring options:
• Prev Close → Green if the current close is higher than the previous close, Red if lower.
• Candle Direction → Green if the candle is bullish (close > open), Red if bearish (close < open).
Moving Average (default length: 14) applied on the money volume for trend analysis.
Axis values and labels displayed in a shortened format (K, M, B, T) for readability.
📊 This helps traders quickly identify whether large amounts of money flowed into or out of the asset, making it easier to detect unusual activity compared to regular volume indicators.

Volume Pulse [BreakoutOrFakeout]Volume Pulse
What It Is
A beautifully designed volume indicator that transforms standard volume bars into an intelligent, visually stunning analysis tool. It instantly highlights when "smart money" is moving and helps identify real breakouts from fakeouts.
What Makes It Special
Visual Intelligence: Uses gradient color technology that intensifies based on volume strength - weak volume appears transparent while strong volume pops with vibrant colors. You'll literally SEE the difference between retail and institutional activity.
Spike Detection: Automatically identifies and marks unusual volume surges with golden diamond markers - these often precede major price moves.
Dynamic Adaptation: The moving average line intelligently changes opacity based on current volume conditions, creating a living, breathing indicator that responds to market activity.
Real-Time Stats: Floating information panel shows current volume compared to average with percentage changes - no mental math required.
How to Use It
Color Intensity = Volume Strength
Faded bars = Weak volume (potential fakeout)
Solid bars = Strong volume (potential breakout)
Golden Diamonds = Pay Attention
Mark 2x average volume spikes
Often appear at reversal points or breakout confirmations
Blue Line Relationship
Volume above line = Increasing interest
Volume below line = Declining participation
Background Highlights
Subtle yellow glow on extreme volume days
Makes significant days impossible to miss
Perfect For
Confirming breakout validity
Spotting accumulation/distribution
Identifying climax tops/bottoms
Day trading volume patterns
Swing trading entry confirmation
Why Traders Love It
✓ Makes volume analysis actually enjoyable
✓ Clean design reduces chart clutter
✓ Works on all timeframes
✓ No complex settings to figure out
✓ Professional appearance impresses clients
The Bottom Line: It's "just" a volume indicator - but it makes every other volume indicator look outdated. The gradient effect alone will change how you view volume forever.
⚠️ For educational purposes only. Trading involves risk.

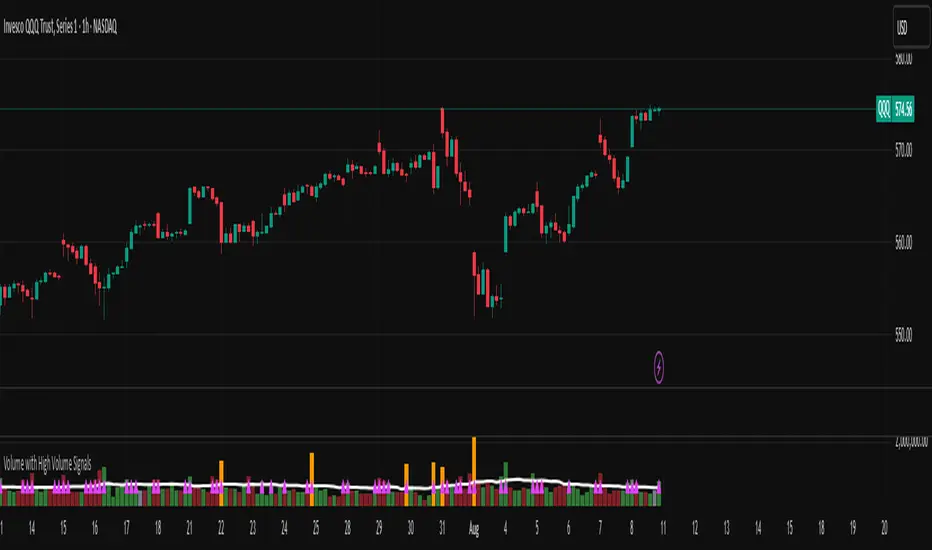
Volume with High Volume SignalsIndicator Description for Promotional Post (in English)
Unlock Market Insights with the "Volume with High Volume Signals" Indicator!
Are you ready to take your trading to the next level? The Volume with High Volume Signals indicator is your ultimate tool for spotting critical market movements driven by volume surges. Designed for traders who want clarity and precision, this Pine Script indicator combines powerful volume analysis with customizable features to help you stay ahead of the game.
Why Choose This Indicator?
Dynamic Volume Visualization: Watch volume bars come to life with customizable coloring. Choose to color bars based on candle direction (green for bullish, red for bearish) or use a neutral gray for a clean look.
High Volume Detection: Instantly spot significant volume spikes with our advanced highlighting feature. When volume exceeds twice the Simple Moving Average (SMA), bars are highlighted in a bold, customizable color (default: yellow) to signal potential breakout or reversal opportunities.
Dual Moving Averages: Track volume trends with both Simple Moving Average (SMA) and Exponential Moving Average (EMA). Fully customizable periods, colors, and line thickness let you tailor the indicator to your trading style.
Visual Alerts for Key Moments: When volume surges above both SMA and EMA, a vibrant fuchsia triangle appears above the bar, giving you an immediate visual cue for high-impact market activity.
User-Friendly Customization: Adjust every aspect of the indicator—toggle SMA/EMA visibility, set periods, choose colors, and fine-tune line thickness to match your preferences.
Perfect For:
Day traders looking for high-volume breakouts.
Swing traders identifying trend reversals.
Any trader who wants to harness volume as a leading indicator.
Why It’s a Must-Have:
Volume is the heartbeat of the market, and this indicator transforms raw data into actionable insights. Whether you're scalping, swing trading, or analyzing long-term trends, the Volume with High Volume Signals indicator empowers you to make informed decisions with confidence.
Get Started Today!
Add the Volume with High Volume Signals indicator to your TradingView arsenal and start decoding market moves like a pro. Don’t miss out on the edge that top traders rely on—grab this indicator now and elevate your trading strategy!
Volume Profile + VWAP + Long Wick StrategyVolume Profile + VWAP + Long Wick Strategy
This indicator combines Volume Profile (VP), VWAP (Volume Weighted Average Price) with deviation bands, and a long wick candle strategy to identify potential support/resistance zones and trading signals. It detects "power wicks" (long shadows with high volume near key levels like POC, VAH/VAL, or VWAP) as reversal setups, generating buy/sell alerts after confirmation wicks appear near these zones.
Key Features:
Volume Profile: Displays VP histogram over a lookback period, highlighting POC (Point of Control), VAH/VAL (Value Area High/Low) with customizable rows and thresholds.
VWAP & Bands: Plots VWAP with 1-3 std dev bands; filters signals based on trend and proximity to bands.
Long Wick Detection: Identifies strong ("power") and signal wicks based on wick/body ratios, ATR size, and volume multipliers. Supports Market Maker (MM) volume bonuses for liquidity zones.
Trading Signals: Generates BUY/SELL arrows when price retests wick levels with confirmation, limited by max signals per zone and min wait bars. Filtered by MTF (multi-timeframe) alignment (e.g., higher TF EMA trend and candle direction) and VWAP trend.
Sessions: Shows POC/VAH/VAL for Asian, London, and NY sessions with optional active-only display.
MTF Analysis: Scores bullish/bearish alignment across two higher timeframes for signal filtering.
Visuals: Liquidity sweep boxes, resistance/support lines, info table (levels, signals remaining, VWAP status), and MTF status box.
Customizable: Adjust wick ratios, volume thresholds, VP rows, MTF periods, and display options.
Ideal for intraday/scalping on forex/crypto/stocks. Use on lower TFs with MTF filters for confluence. Not financial advice—backtest thoroughly!

Volume FVG | Liquidity Gaps + (Z-Core Edition)📘 Indicator Description — Volume FVG Pro+
Volume FVG Pro+ is a technical analysis tool designed to automatically detect and visualize Fair Value Gaps (FVG) on the chart. It incorporates volume-based and ATR-based filtering to highlight only meaningful zones while reducing market noise.
⚙️ How It Works:
FVG Detection:
Identifies gaps between candles that may indicate institutional activity or imbalance.
Supports two types:
Regular FVG — all price gaps.
Volume FVG — gaps with abnormally high volume, calculated via Z-Score (relative to volume average).
ATR Filtering:
Filters out insignificant price gaps using Average True Range (ATR).
Helps show only zones with strong volatility behavior.
Mitigation Logic:
Zones are marked as mitigated (deactivated) when price retraces into them.
Mitigation can be detected by wick or close, with configurable depth percentage.
Zone Extension:
Active zones automatically extend forward until they are mitigated.
Display Options:
Fully customizable:
Bullish/Bearish coloring.
Opacity and box length.
Toggle labels and outlines.
🛠️ Settings Overview:
Z-Score Thresholds — for volume-based FVG detection.
ATR Multiplier — volatility sensitivity.
Mitigation Depth (%) — defines how deep price must retrace to deactivate a zone.
Display Options — full control over how zones appear on the chart.
📌 Why Use Volume FVG:
These gaps often represent footprints of large participants.
They are statistically more likely (15–20%) to hold price and act as reaction zones compared to regular FVGs (based on internal analysis).
Useful for identifying entry/exit areas and refining market structure analysis.
👤 Best For:
Smart Money / Order Flow / Liquidity-based traders.
Intraday and swing traders using price reaction and volume cues.
Anyone seeking clear and efficient FVG detection with filtering.
