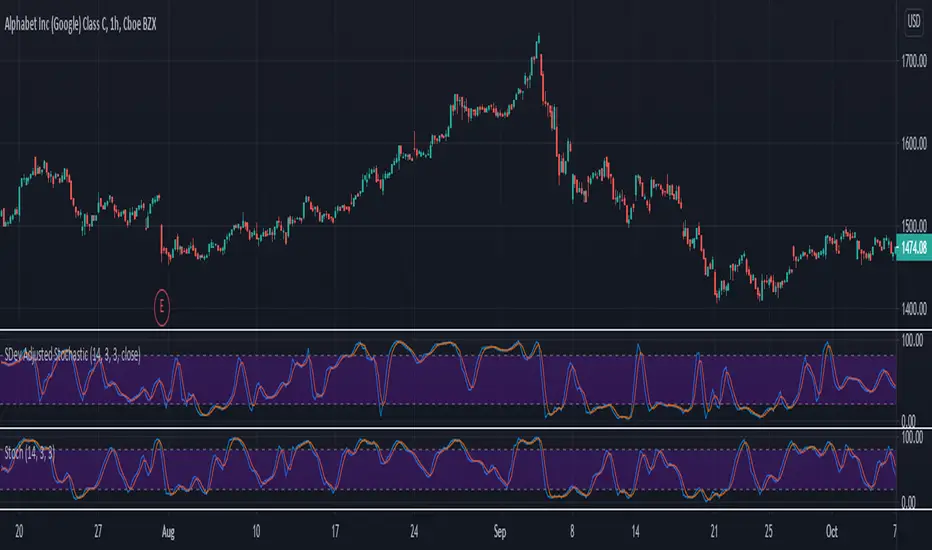
SDev Adjusted StochasticDescription : This Stochastic variant will auto-adjust stochastic period based on volatility measured by standard deviation.
The idea behind it are in highly volatile market, %K period will be reduced to account for recent price range,
while in low volatility market, %K period will be increased to account less of the recent price range.
This idea is based on one of medium article written by Sofien Kaabar with slight modification on the adjusting logic implementation. Any ideas to further improve this indicator are welcome :)
Disclaimer:
I always felt Pinescript is a very fast to type language with excellent visualization capabilities, so I've been using it as code-testing platform prior to actual coding in other platform.
Having said that, these study scripts was built only to test/visualize an idea to see its viability and if it can be used to optimize existing strategy.
While some of it are useful and most are useless, none of it should be use as main decision maker.
مؤشر الاستوكاستك
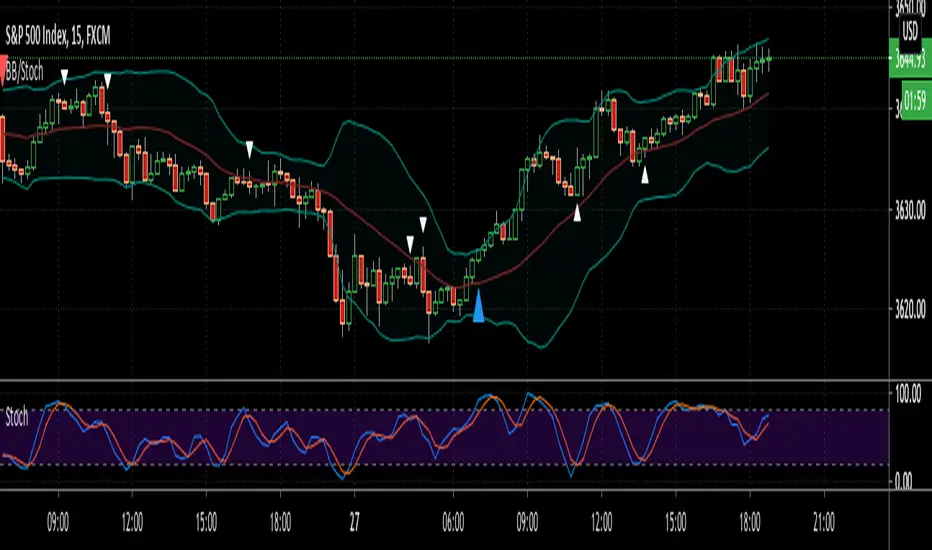
Simple Bollinger Band and stochastic oscillator strategy for SPXThis is a very simple Bollinger Band strategy with stochastic oscillator added. Main trend is determined by Band breakout while (5,3,3) stochastic crosses is used for additional entries. Alert function is configured as "one alert for any events", so that free users can set up and get alert for every events in the script. The following code segment can be manipulated as your needs, by removing or keeping "//" comment slashes etc. Entries should be above/below the signal bars and 7-8 points should be regarded as first target, trail the left. Good luck !
signal = bbupcross or bbdowncross //or add_long or add_short
DMI Stochastic ToltecasModification of DMI Stochastic Indicator created by @usgears
- Added Crossing Up/Down Text Signal
- Added Crossing Up/Down Arrow Signal
- Added Crossing Up/Down Darts Signal
- Added Midline level
- Custom settings for oversold, midline and overbought levels to select a solid, dotted, or dashed line style.
- Added Background Color

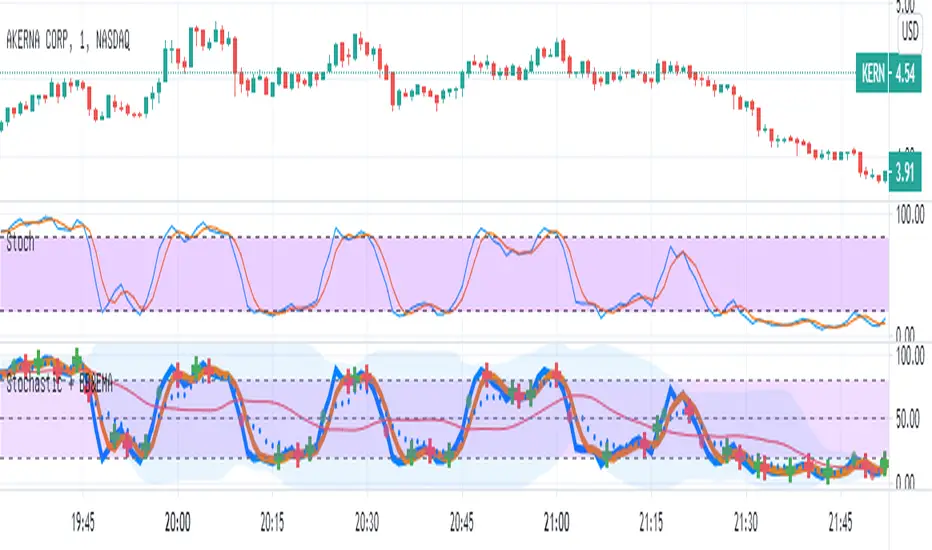
Stochastic with Bollinger & EMAIn this script
I combined the various of the oscillator
Stochastic (STOCH) with BB (Bollinger Bands).
Each cut of K and D creates a mark (+) Red / green - accordingly.
As the Stochastic (K) crosses the BB base, a green / red point is formed accordingly.
As a sign it is possible to continue up / down.
I added EMA8 to K (style circles)
When the oscillator is above the EMA - it is possible that this is a clear sign of an increase.
Band 50 was also added to facilitate the calculations.
Logistic RSI, STOCH, ROC, AO, ... by DGTExperimental attemt of applying Logistic Map Equation for some of widly used indicators.
With this study "Awesome Oscillator (AO)", "Rate of Change (ROC)", "Relative Strength Index (RSI)", "Stochastic (STOCH)" and a custom interpretation of Logistic Map Equation is presented
Calculations with Logistic Map Equation makes sense when the calculated results are iterated many times within the same equation.
Here is the Logistic Map Equation : Xn+1 = r * Xn * (1 - Xn)
Where, the value of r is the key for this equation which changes amazingly the behaviour of the Logistic Map.
The value we have asigned for r is less then 1 and greater than 0 ( 0 < r < 1) and in this case the iterations performed with the maximum number of output series allowed by Pine is quite enough for our purpose and thanks to arrays we can easiliy store them for further processing
What we have as output:
Each iteration result is then plotted (excluding plotting the first iteration), as circles or line based on user preference
Values above and below zero level (0) are coloured differently to emphasis bull and bear power
Finally Standard Deviation of Array's Elements is ploted as line. Users may choose to display this line only
So where it comes the indicators "Awesome Oscillator (AO)", "Rate of Change (ROC)", "Relative Strength Index (RSI)", "Stochastic (STOCH)".
Those are the indicators whose values are assigned to our key varaiable in the Logistic Map equation forulma which is r
Further details regarding Logistic Map can found under the description of “Logistic EMA w/ Signals by DGT” study
Disclaimer:
Trading success is all about following your trading strategy and the indicators should fit within your trading strategy, and not to be traded upon solely
The script is for informational and educational purposes only. Use of the script does not constitute professional and/or financial advice. You alone have the sole responsibility of evaluating the script output and risks associated with the use of the script. In exchange for using the script, you agree not to hold dgtrd TradingView user liable for any possible claim for damages arising from any decision you make based on use of the script

CC STOCH RSI [Rogulabo]3 indicators in 1.
Included Indicators are:
- Correlation Coefficient
- RSI
- Stochastics
Basic usage of these indicators respectively are:
- CC value of 1 represents a perfect correlation, while a value of -1 represents an inverted correlation.
- RSI values above 70 is commonly overbought, whilst below 30 is oversold.
- Stochastics for describing the momentum and turning points of price swings.
Please recognize that these are simplified explanations.
Reasons for 3 in 1 assembly:
This indicator is intended to be used by students, and followers of Dan Takahashi
(a prominent educator of investing in Japan who is also a user of TradingView) .
Those who wants to use and learn with the same setup as Dan, would greatly benefit from this since,
the complex setting up process which can be a pain for beginners can be skipped with a simple click.
Every stylistic choice of color and placement were made to make it similar to the chart used by Dan.
Simple customizations are available such as:
- Changing color
- Changing the values
- Hide/show controls
Notes:
This is intended to be used alongside “EMA ICHI BB ” for the complete the setup.
Any questions, please refer to:
@rogulabo
==
高橋ダンさんが使用されてるチャートと同様のセットアップの為にご活用ください。
複数のインジケータをグループにしておりますので、無料版を使われてる方は効率よく使っていただけると思います。
また、“EMA ICHI BB ”どいうタイトルのインジケータも同時に公開しておりますので、セットアップを完成させたい方はこちらもご活用ください。
以下のインジケータを含みます。
・相関係数
・ストキャスティクス
・RSI
カスタマイズされたい方はご自由に値を変更ください。
ご質問は @rogulabo までよろしくお願いいたします。

Doble stochastic oscillator fast and slowThis is a two stochastic in one indicator :
We have a normal stochastic, and a slower one in order to identify changes in the price movement.
At the same time I added more levels, so its easier visually to identify in each scenario we are.
The slower oscillator, also change color based on direction it has.
Green color = long direction - > buy
Red color = short direction - > sell

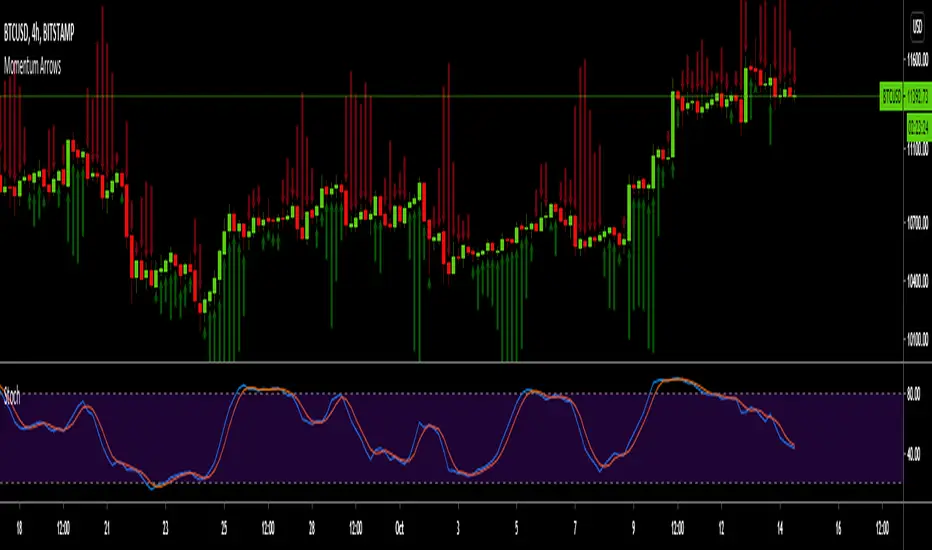
Momentum ArrowsThis simple indicators paints the Momentum based on Stochastic, RSI or WaveTrend onto the Price Chart by showing Green or Red arrows.
In the settings it can be selected which indicator is used, Stochastic is selected by default.
Length of the arrows is determined by the strength of the momentum:
Stochastic: Difference between D and K
RSI: Difference from RSI-50
WaveTrend: Difference between the Waves
(Thanks to @LazyBear for the WaveTrend inspiration)
PS:
If anyone has an idea how to conditionally change the color of the arrows, then please let me know - that would be the icing on the cake. Then it would be possible to indicate Overbought/Oversold levels with different colors.
Unfortunately it currently seems not to be possible to dynamically change the arrow colour.
Fibonacci StochasticMy attempt to smooth out the classic Stochastic indicator based on Fibonacci levels - 0.236, 0.382, 0.5, 0.618, 0.786
Includes optional "Smoothed Moving Average" (SMMA), SMA and EMA.
This is an interesting experiment, comments would be helpful to improve this indicator.

STOCH 1 KENVINThis is Stochastic was cusumize by Kenvin Hoang
More smooth and clear
Plot color : RED = SELL SIGNAL when signal line in Red-Range
Plot color : GREEN = BUY SIGNAL when signal line in Green-Range

CyclesThis is a modified Stochastic indicator. Modifications include:
1. The output is now centered on "0" and the scale is from -50 to +50, so that histograms and columns can be used to plot the output.
2. Added visual trade setup triggers. A trigger to the up side is a cycle high and indicates a "sell signal". A trigger to the down side is a cycle low and indicates a "buy" signal.
3. Added an alert trigger to be used to setup alerts. Selecting "Alert" to be Greater Than (>) Value = 0.00 will trigger an alert if either the buy or sell triggers occur.
4. Added a force indicator output. This indicates the rate of change in "D", or mathematically "dD/dt", as was done in the Power Analyzer indicator. When Force and D are in-phase, the maximum power is achieved.
5. Added "Slow Average Momentum" and "Slow Average Force" as was done in the Power Analyzer indicator.
6. Added an internal MACD and EMA as part of the trade setup trigger equation. There is a new input variable for the EMA length.
7. Added an input variable for the "Trigger Threshold", which ranges from -50 to 50, to be used as a screening filter.

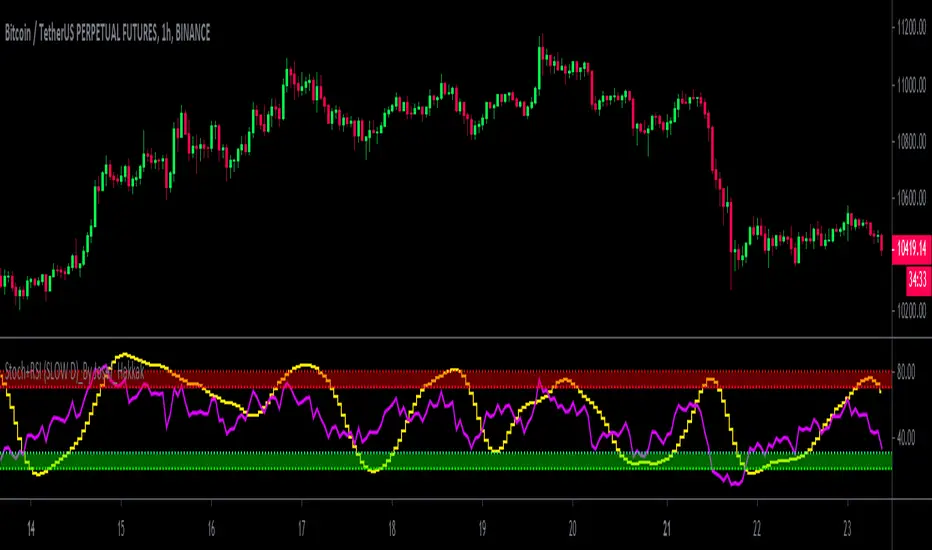
Stoch+RSI (SLOW D)_By Josef_HakkakStoch+RSI (SLOW D)_By Josef_Hakkak
Stochastic and RSI by SLOW D%
-> How to use:
B UY = When the yellow line (D of Slow Stoch ) goes out of the green range, it is better that the purple line ( RSI ) is be low
SELL = When the yellow line (D of Slow Stoch ) goes out of the red range, it is better to have the purple line ( RSI ) is be high
This script was previously written by RRanjanFX and has now been edited by me and changes have been made to optimize for shorter timeframes.
Edited and updated and optimized from:
RRanjanFX
Many thanks and loyal to RRanjanFX
STOCH RSI [Rogulabo] 2 indicators in 1.
Included Indicators are:
- RSI
- Stochastics
Basic usage of these indicators respectively are:
- RSI values above 70 is commonly overbought, whilst below 30 is oversold.
- Stochastics for describing the momentum and turning points of price swings.
Please recognize that these are simplified explanations.
Reasons for 2 in 1 assembly:
This indicator is intended to be used by students, and followers of Dan Takahashi
(a prominent educator of investing in Japan who is also a user of TradingView) .
Those who wants to use and learn with the same setup as Dan, would greatly benefit from this since,
the complex setting up process which can be a pain for beginners can be skipped with a simple click.
Every stylistic choice of color and placement were made to make it similar to the chart used by Dan.
Simple customizations are available such as:
- Changing color
- Changing the values
- Hide/show controls
Notes:
This is intended to be used alongside “EMA ICHI BB ” for the complete the setup.
Any questions, please refer to:
@rogulabo
==
高橋ダンさんが使用されてるチャートと同様のセットアップの為にご活用ください。
複数のインジケータをグループにしておりますので、無料版を使われてる方は効率よく使っていただけると思います。
また、“EMA ICHI BB ”どいうタイトルのインジケータも同時に公開しておりますので、セットアップを完成させたい方はこちらもご活用ください。
以下のインジケータを含みます。
・ストキャスティクス
・RSI
カスタマイズされたい方はご自由に値を変更ください。
ご質問は @rogulabo までよろしくお願いいたします。

CASH TRAP OSILADORESFor Best Results, Collect Minimum of 4 Confirmations. When the Relative Strength Index is above the top line, look for sales. If it is below the bottom line, Find purchases.
If the Stochastic Oscillator is above the upper line, look for sales, If it is below the bottom line, look for purchases. (also applying price action and looking for bounce points)
PARAMETERS
RSI= 4 (70,30)
STOCH= 5/1/1 (80,20)

MTF Stoch RSI ScreenerDisplays when multiple timeframes of Stochastic RSI are overbought/oversold. Multiple consecutive timeframes being overbought/oversold can signify a short term top or bottom.
Thanks to Micse in Pinescripters telegram who helped remove a few errors from this.

Stochastic Oscillator [SystemAlpha]This is a Stochastic Oscillator enhanced with:
- Show Buy and Sell Alert
- Show Regular and Hidden divergence
- Show Divergence Labels
- Generate Alerts: Buy/Sell and Divergence

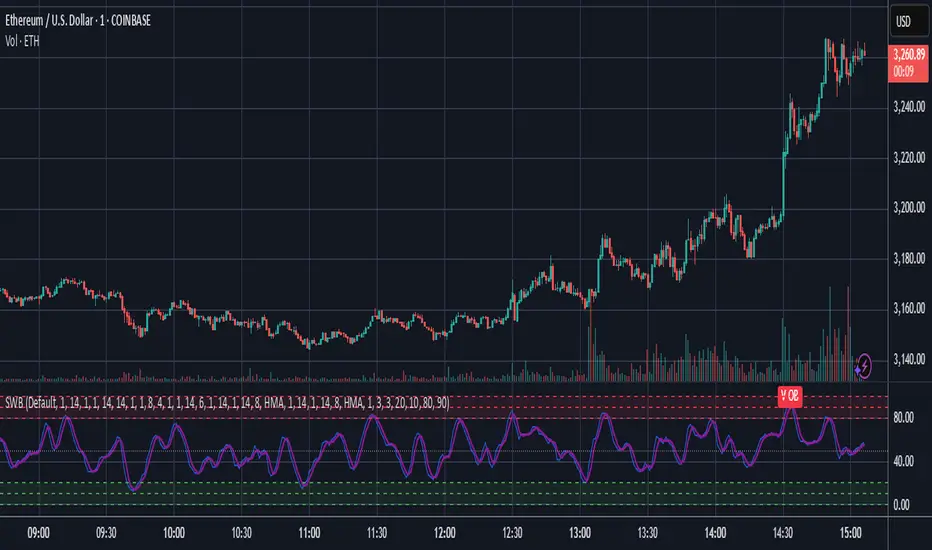
Stoch X, an Indicator of Indicators by DGTStochastic refers to a randomly determined process and financial markets use stochastic models to represent the seemingly random behaviour of assets and then used by quantitative analysts to value options on asset prices
The stochastic oscillator, developed by George Lane, presents the location of the closing price of a stock in relation to the high and low range of the price of a stock over a period of time. Lane has said that the stochastic oscillator does not follow price or volume or anything similar. He indicates that the oscillator follows the speed or momentum of price.
Traditionally, readings over 80 are considered in the overbought range, and readings under 20 are considered oversold. Please note that, very strong trends can maintain overbought or oversold conditions for an extended period and traders should look to changes in the stochastic oscillator for clues about future trend shifts. It is advised to check the higher timeframe of your trading timeframe and see where you are in the “big picture”
Signal crosses , intersection of stochastic and its signal line is considered to be a signal that a reversal may be in the works
Divergence between the stochastic oscillator and trending price action is also seen as an important reversal signal
Lane also reveals in interviews that, as a rule, the momentum or speed of the price of a stock changes before the price changes itself . In this way, the stochastic oscillator can be used to foreshadow reversals when the indicator reveals bullish or bearish divergences. This signal is the first, and arguably the most important, trading signal Lane identified.
What is Stochastic X ?
Stochastic X , is essentially an indicator of an indicator, providing stochastic calculation to some of well known indicators, such as RSI, MFI, OBV, etc. This means that it is a measure of selected specific indicator relative to its own high/low range over a user defined period of time.
Features of Stoch X
1- Displays Stoch of and indicator plus a companion indicator (companion display can be disabled from user dialog box)
Available options
Stoch Source plus PM A, where Source is close price and PMA refers to Price Distance to its Moving Average (for further details you may check my study of Price Distance to its MA by DGT, and different application of distance concept available with “MACD-X, More Than MACD" And “P-MACD”)
Stoch RSI plus RSI , Stoch RSI, developed by Tushar Chande and Stanley Kroll, is a build-in indicator available on Trading View, where Stoch X adds RSI as a companion indicator to Stoch RSI
Stoch MFI and MFI , where MFI is Money Flow Index, measures buying and selling pressure through analyzing both price and volume
Stoch OBV + VO , Where OBV is On Balance Volume, is a momentum indicator that measures positive and negative volume flow. VO stands for Volume Oscillator which aims to confirm a market turnaround or trend reversal
Stoch EWO + EWO , EWO stands for Elliott Wave Oscillator
By default the threshold levels are indicated and are displayed differently for the regular Stoch or Stoch RSI. Overbought band (70-80), oversold band (20-30) and middle line (0) are emphasized
Warning : Centered Oscillators base line is moved from 0 to 50 to better suit with Stoch X, which is applied to PMA, VO and EWO
2- Can be plotted along with Stoch in the same window using the same scaling
To avoid misinterpreting the area between Stoch X and its Signal Line is highlighted automatically in case Stoch is selected to be plotted
3- Squeeze Indicator added as Add-on in the bottom of the Stoch X
During volatile market conditions the stochastic oscillator has been known to produce false signals. One way to help with this is to take the price trend as a filter, or basic chart pattern analysis can help to identify major, underlying trends and increase the Stoch X's accuracy.
This study implements Squeeze Indicator to help and add additional insight for filtering false signals. Blue diamond shapes indicates the squeeze release, that is volatility increased and according to momentum direction the buy/sell possibility can be considered. Orange ones displays consolidation periods, that is low volatility and the market is assumed to be in squeeze and no trade is recommended. in this phase.
Disclaimer: Trading success is all about following your trading strategy and the indicators should fit within your trading strategy, and not to be traded upon solely
The script is for informational and educational purposes only. Use of the script does not constitutes professional and/or financial advice. You alone the sole responsibility of evaluating the script output and risks associated with the use of the script. In exchange for using the script, you agree not to hold dgtrd TradingView user liable for any possible claim for damages arising from any decision you make based on use of the script

Stochastic / RSI (Wilder's [RMA] or Arnaud Legoux [ALMA])This script displays the Stochastic and Relative Strength Index ("RSI") indicators. Each indicator can be displayed standalone or shown together. The Stochastic indicator also has functionality to highlight overbought/oversold levels as well as relative placement of K and D. The RSI indicator can also be updated to utilize the Arnaud Legoux Moving Average ("ALMA") (vs. the standard Wilder's Moving Average).
I use based on default settings. ALMA RSI can help indicate extent of drop/rise from Stochastic overbought/oversold levels.
Recognition due to @kurtsmock for the work on validating the ALMA calculation (pinescript built-in function has slight deviation from original design) ---> LINK ().

Hybrid Overbought/Oversold Detector + Put/Call SignalsThere are many indicators of overbought/oversold conditions out there. Some of more common ones are:
- Bollinger Bands %B
- Money Flow Index (MFI)
- Relative Strength Index (RSI)
- Stochastic
This script uses a combination of these 4 oscillators to confirm overbought/oversold and filter the signals of market reverse which could be used for trading binary options.
You may select which oscillators you want to apply and of course change the source, the length of the calculations and the overbought/oversold levels.
Also the script will draw a combined graph which is the average of the selected oscillators in the options.
Send me your ideas!

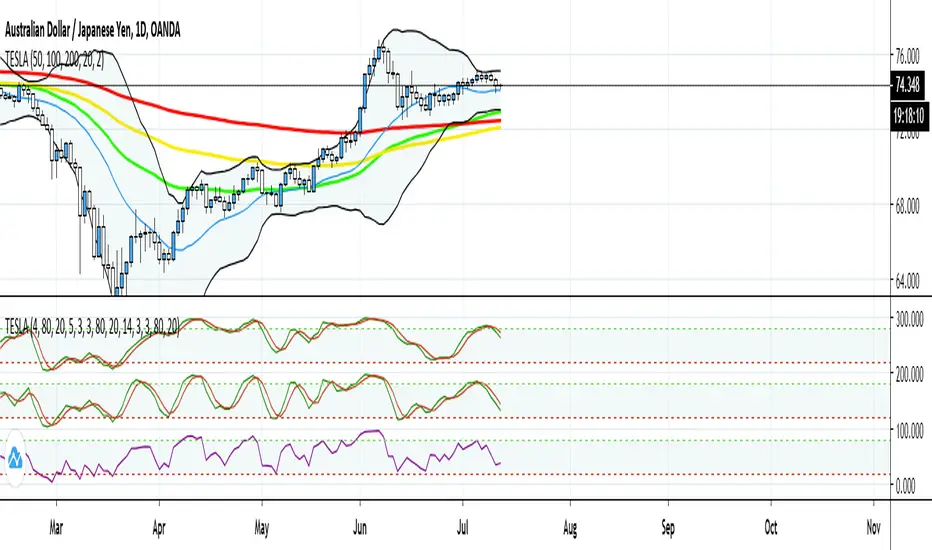
TESLA: RSI and StochasticThis script is part of the "TESLA" strategy and will help traders identifying overbought and oversold condition as well as other applications such as divergence. The features for this script are the following:
- 1 RSI index in order to identify market buying/selling strength
- 2x Stochastic in order to have fast and slow overbought and oversold zones.
Bollinger Band Reversal StudyThis strategy was inspired by ParallaxFX.
This strategy attempts to predict when a price reversal will happen. It uses bollinger bands, stochastics and candle formations.
The idea is that when an indecision candle, such as a doji, crosses outside the bollinger bands, then is followed by another candle that pushed sharply back inside the bands, you have a setup.
These setups are marked with green arrows to go long and red arrows to go short. Wait until the next candle begins before acting. The arrow may come and go as the price fluctuates, so wait until the candle closes.
Another play is when the same setup occurs, but on the middle bollinger band instead of the outer band.
These setups are marked with blue arrows to go long and yellow arrows to go short. Wait until the next candle begins before acting. The arrow may come and go as the price fluctuates, so wait until the candle closes.
Closing can happen a number of ways. You can use a predetermined risk-reward or look to sell when the price reaches another band.
In summary.
Go long when a green or blue arrow appears.
Go Short when a red or yellow arrow appears.
Green arrows show signs of reversal from lower BB.
Blue arrows show signs of reversal from middle BB.
Red arrows show signs of reversal from upper BB.
Yellow arrows show signs of reversal from middle BB.
Wait for candle with arrow to close before taking trade.

Stoch+RSI With Color Combination. Hello Everyone This Indicater Base on (RSI and Stoch) COMBINATION With Color Combination.
You Can also use for
1-Divergence.
2-Overbought.
3-Oversold.
4-Breakout.
5-Support & Resistance Zones.

Stochastic Weights - Basic [BigBitsIO]This script is a compilation of several different stochastic indicators (and RSI) where the K value of each indicator is equally weighted. The purpose of the indicator is to combine many indicators together in a fashion that weights them easier. By default, the Stochastic and Stochastic RSI are both enabled - the idea is to speed up the relatively slower Stochastic and to slow down the relatively fast Stochastic RSI. Other Stochastics are also available, including some of my own custom calculations that can also be added to the weighted calculation. Only the K value is weighted, as the D value is just a moving average of the weighted K.
Explained:
- Calculates enabled indicators
- Calculates the weighted value of K for enabled indicators
- Calculates a D value from the weighted K
FAQ:
- Why is this script useful?
- To weight multiple indicators together so that you can attempt to find optimal values shared amongst the indicators. Ex: If Stochastic RSI is 100 and Stochastic is 50, K would be 75 and not particularly high. If you add in a 50 RSI, the K would be 67 in this example. If we weight indicators together that all have a high value they could potentially help find elements that align together to produce a stronger signal.
DISCLAIMER: For educational and entertainment purposes only. Nothing in this content should be interpreted as financial advice or a recommendation to buy or sell any sort of security or investment including all types of crypto. DYOR, TYOB.