Magick Trading SuiteWelcome to Magick Trading Suite!
One of the most powerful indicators! Customizable to your heart’s content. No repainting!
Includes:
Candlestick analysis
Pivots
Reversal detection
4+ bar color types
Supports combined instruments
Supports different sources
Trend median - amazing way to detect support and resistances
Daily open
Top and bottom detection
Adaptive ATR stop loss/trend
2+ special moving averages
and more!
Overwhelmed? You can turn off what you don't like!
Comes with manual.
Shout-out to @Nico.Muselle, @alexgrover, @JustUncleL, @ucsgears, @writner for creating great scripts that give me ideas for my indicators.
Stoploss

ATR ChannelsATR Channels help you to identify where to place your stop-loss or trailing stop-loss based on price volatility, according to the Average True Range (ATR).

RePaNoCHa V4 [Backtest]This is the Backtest version of the previous one.
It's important to correctly set the "TICKS / PIPS CORRECTION" parameter in each different chart.
Enjoy!

SUPERTREND ATR WITH TRAILING STOP LOSS## THIS SCRIPT IS ON GITHUB
## MORE BACKTEST
SuperTrend is a moving stop and reversal line based on the volatility (ATR).
The strategy will ride up your stop loss when price moviment 1%.
The strategy will close your operation when the market price crossed the stop loss.
The strategy will close operation when the line based on the volatility will crossed
The strategy has the following parameters:
+ **ATR PERIOD** - To select number of bars back to execute calculation
+ **ATR MULTPLIER** - To add a multplier factor on volatility
+ **INITIAL STOP LOSS** - Where can isert the value to first stop.
+ **POSITION TYPE** - Where can to select trade position.
+ **BACKTEST PERIOD** - To select range.
## DISCLAIMER
1. I am not licensed financial advisors or broker dealers. I do not tell you when or what to buy or sell. I developed this software which enables you execute manual or automated trades multiple trades using TradingView. The software allows you to set the criteria you want for entering and exiting trades.
2. Do not trade with money you cannot afford to lose.
3. I do not guarantee consistent profits or that anyone can make money with no effort. And I am not selling the holy grail.
4. Every system can have winning and losing streaks.
5. Money management plays a large role in the results of your trading. For example: lot size, account size, broker leverage, and broker margin call rules all have an effect on results. Also, your Take Profit and Stop Loss settings for individual pair trades and for overall account equity have a major impact on results. If you are new to trading and do not understand these items, then I recommend you seek education materials to further your knowledge.
**YOU NEED TO FIND AND USE THE TRADING SYSTEM THAT WORKS BEST FOR YOU AND YOUR TRADING TOLERANCE.**
**I HAVE PROVIDED NOTHING MORE THAN A TOOL WITH OPTIONS FOR YOU TO TRADE WITH THIS PROGRAM ON TRADINGVIEW.**
## NOTE
I accept suggestions to improve the script.
If you encounter any problems i will be happy to share with me.
+ Authors: @exit490
+ Revision: v1.0.0
+ Date: 5-Aug-2019
+ Pinescript version: 4
## LICENSE
Copyright 2019 Mauricio Pimenta / exit490
SuperTrend with Trailing Stop Loss script may be freely distributed under the (../LICENSE).

TRAILING STOP LOSS TO LONG AND SHORT##THIS SCRIPT IS ON GITHUB
This TradingView strategy it is designed to integrate with other strategies with indicators.
It performs a trailing stop loss from entry and exit conditions.
In this strategy you can add conditions for long and short positions.
The strategy will ride up your stop loss when price moviment 1%.
The strategy will close your operation when the market price crossed the stop loss.
Also is possible to select the period that strategy will execute the backtest.
The strategy has the following parameters:
+ **INITIAL STOP LOSS** - Where can isert the value to first stop.
+ **POSITION TYPE** - Where can to select trade position.
+ **BACKTEST PERIOD** - To select range.
## DISCLAIMER
1. I am not licensed financial advisors or broker dealers. I do not tell you when or what to buy or sell. I developed this software which enables you execute manual or automated trades multiple trades using TradingView. The software allows you to set the criteria you want for entering and exiting trades.
2. Do not trade with money you cannot afford to lose.
3. I do not guarantee consistent profits or that anyone can make money with no effort. And I am not selling the holy grail.
4. Every system can have winning and losing streaks.
5. Money management plays a large role in the results of your trading. For example: lot size, account size, broker leverage, and broker margin call rules all have an effect on results. Also, your Take Profit and Stop Loss settings for individual pair trades and for overall account equity have a major impact on results. If you are new to trading and do not understand these items, then I recommend you seek education materials to further your knowledge.
**YOU NEED TO FIND AND USE THE TRADING SYSTEM THAT WORKS BEST FOR YOU AND YOUR TRADING TOLERANCE.**
**I HAVE PROVIDED NOTHING MORE THAN A TOOL WITH OPTIONS FOR YOU TO TRADE WITH THIS PROGRAM ON TRADINGVIEW.**
## NOTE
I accept suggestions to improve the script.
If you encounter any problems I will be happy to share with me.
+ Authors: @exit490
+ Revision: v1.0.0
+ Date: 03-Aug-2019
+ Pinescript version: 4
## LICENSE
Copyright 2019 Mauricio Pimenta / exit490
Trailing Stop Loss script may be freely distributed under the MIT license .

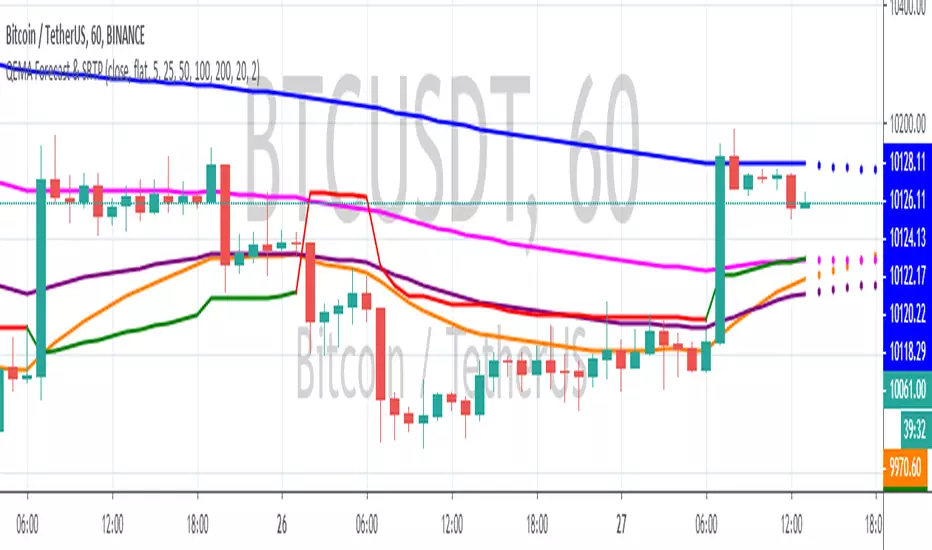
QEMA Forecast & SRTPThis script combine 4 EMA Forecast (21, 50, 100, 200) and a Stop and Reverse Signal based on volatility into one indicator.
You can select to use which EMA work best for you.
Hope you find it useful.
Two MM Cross (Signal version)Hi everyone
This is a dummy two MM cross script to be used for the Trade Manager
I'll publish a video explaining how to use the Trade Manager as I received many questions.
This was my fault for not being clear enough. A video will do great wonders here
Dave

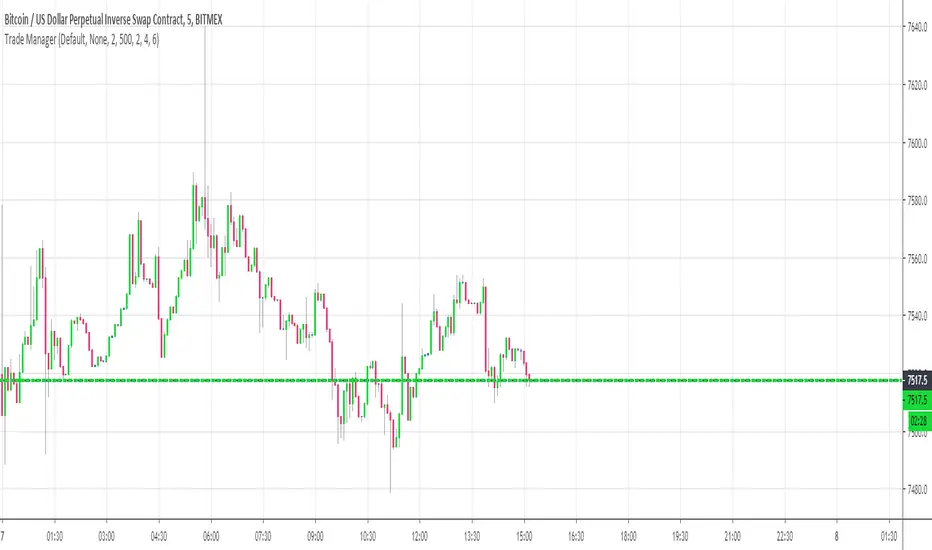
Trade Manager (Open Source Version)Hello my young padawans looking for the FORCE to get richer on your next trade
I got pinged at least three times today asking where the hell is the indicator of the day. You asked, I delivered :)
Here's your free open-source Trade Manager Version. My associates might kill me for sharing that one... anyway this is a real GIFT.
I won't share such quality indicators too often for FREE so hope you'll appreciate its value. It can really help with your day to day trading (on top of making your charts looking more awesome)
This is an even better version compared to my previous Trade Manager Trade-Manager . It's basically a standalone version, meaning you'll have to update with 2 lines your own indicator and follow my educational post from yesterday (pasted it below also) to learn how to do it
Please read this educational post I published for you before proceeding further : How-to-connect-your-indicator-with-the-Trade-Manager
From here you normally connected the data source of your own indicator to the Trade Manager. If not, here's a reminder of the article mentionned above
Step 1 - Update your indicator
For the screenshot you see above, I used this indicator : Two-MM-Cross-MACD/ . "But sir are you really advertising your other indicators here ??" ... hmmm.... YES but I gave them for free so ... stop complaining my friend :)
Somewhere in the code you'll have a LONG and a SHORT condition. If not, please go back to study trading for noobs (I'm kidding !!!)
So it should look to something similar
nUP = ma_crossover and macd_crossover
nDN = ma_crossunder and macd_crossunder
What you will need to add at the very end of your script is a Signal plot that will be captured by the Trade Manager. This will give us :
// Signal plot to be used as external
// if crossover, sends 1, otherwise sends -1
Signal = (nUP) ? 1 : (nDN) ? -1 : na
plot(Signal, title="Signal")
The Trade Manager engines expects to receive 1 for a bullishg signal and -1 for bearish .
Step 2 - Add the Trade Manager to your chart and select the right Data Source
I feel the questions coming so I prefer to anticipate :) When you add the Trade Manager to your chart, nothing will be displayed. THIS IS NORMAL because you'll have to select the Data Source to be "Signal"
Remember our Signal variable from the Two MM Cross from before, now we'll capture it and.....drumb rolll...... that's from that moment that your life became even more AWESOME
The Engine will capture the last signal from the MM cross or any indicator actually and will update the Stop Loss, Take Profit levels based on the parameters you set on the Trade Manager
It should work with any indicator as long as you're providing a plot Signal with values 1 and -1 . In any case, you can change the Trade Manager you'll find a better logic for your trading
Now let's cover the different parameters of the tool
It should be straightforward but better to explain everything here
+Label lines : if unchecked, no SL/TPs/... will be displayed
+Show Stop Loss Signal : Will display the stop loss label. You have the choice between three options :
By default, the Stop Loss is set to NONE. You'll have to select a different option to enable the Stop Loss for real
++Percentage : Will set the SL at a percent distance from the price
++Fixed : SL fixed at a static price
++Trailing % : Trailing stop loss based on percentage level
The following is a KEY feature and I got asked for it many times those past two days. I got annoyed of getting the same request so I just did it
++Trailing TP: Will move the Stop Loss if the take profit levels are hit
Example: if TP1 is hit, SL will be moved to breakeven. If TP2 is hit, SL will be moved from TP1 to TP2
+Take Profit 1,2,3 : Visually define the three Take Profit levels. Those are percentage levels .
Meaning if you set TP1 = 2, it will set the TP1 level 2% away from the entry signal
Please note that once a Take profit level is reached, it will magically disappear. This is to be expected
I'll share in the future a way more complete version with invalidation, stop loss/take profits based on indicator, take profit based on supports/resistances, ...
I believe is such a great tool because can be connected to any indicator. I confess that I tried it only with a few... if you find any that's not working with the Trade manager, please let me know and I'll have a look
PS
I want to give a HUUUUUUUGE shoutout to the PineCoders community who helped me finishing it
Wishing you all the best and a pleasant experience with my work
David

Trade ManagerHello everyone
Hoped you had a great weekend and are ready for what's coming this week
I'll never fail to satisfy my audience on TradingView and I'll start by sharing some heavy stuff.... Imagine the most amazing thing you had in your life. You got it ? now multiply this good feeling by 100 !!! OK... now I have a tool that is beyond that litteraly. Don't believe me, here's the Trade Manager ladies and gentlemen, I could barely contain my excitement this weekend to share it with the community
I wasn't sure of sharing it but you guys did a great job with my other indicators giving me constructive feedback to improve them. Also, those helping me with such feedback usually get the indicator for a lifetime access for free.
Please read this educational post I published for you before proceeding further : How-to-set-an-indicator-to-work-with-the-Trade-manager/
From here you normally connected the data source of your own indicator to the Trade Manager. If not, here's a reminder of the article mentionned above
Step 1 - Update your indicator
Somewhere in the code you'll have a LONG and a SHORT condition. If not, please go back to study trading for noobs (I'm kidding !!!)
So it should look to something similar
macrossover = crossover(MA1, MA2)
macrossunder = crossunder(MA1, MA2)
What you will need to add at the very end of your script is a Signal plot that will be captured by the Trade Manager. This will give us :
// Signal plot to be used as external
// if crossover, sends 1, otherwise sends -1
Signal = macrossover ? 1 : macrossunder ? -1 : na
plot(Signal, title="Signal")
The Trade Manager engines expects to receive 1 for a bullishg signal and -1 for bearish .
Step 2 - Add the Trade Manager to your chart and select the right Data Source
I feel the questions coming so I prefer to anticipate :) When you add the Trade Manager to your chart, nothing will be displayed. THIS IS NORMAL because you'll have to select the Data Source to be "Signal"
Remember our Signal variable from the Two MM Cross from before, now we'll capture it and.....drumb rolll...... that's from that moment that your life became even more AWESOME
The Engine will capture the last signal from the MM cross or any indicator actually and will update the Stop Loss, Take Profit levels based on the parameters you set on the Trade Manager
Now I'll cover the different parameters of the tool
It should be straightforward but better to explain everything here
+Label lines : if unchecked, no SL/TPs/... will be displayed
+Show indicators : This does nothing. Tradingview doesn't give the possibility to set Labels on an UI so we have to use this hack with a useless checkbox
+Show PnL Panel : Will show a Panel at the right of your chart with the PnL updated for the last position only. In a future version, I'll make it work to list maybe the previous N positions defined by the user
+Show Stop Loss Signal : Will display the stop loss label. You have the choice between three options :
++Percentage : Will set the SL at a percent distance from the price
++Fixed : SL fixed at a static price
++SuperTrend : Trailing stop loss based on Supertrend
'll add many more options this week for sure
+Take Profit 1,2,3 : Visually define the three Take Profit levels
Please note that once a Take profit level is reached, it will magically disappear. This is to be expected
This indicator is a first draft of what I believe is such a great tool because can be connected to any indicator. I confess that I tried it only with a few... if you find any that's not working with the Trade manager, please let me know and I'll have a look (for free)
I'm so excited to share it with all of you and that's the best possible way I could ever dreamt of to start the week with my TradingView community
Wishing you all the best and a pleasant experience with my work
David
ATR DIstanceShows a static ATR distance from using the latest ATR, and drawing it up and down the price.
Can be used for dynamic stop setting.

RSI Stop LossExperiment for using RSI as a stop loss value, shows where the price will be when the RSI increases or decreases by a specified amount.

Quintalytics TrailingStop MultiTimeQuintalytics TrailingStop MultiTime is a combination of a Trend, Sideways/Chop Detection, and Trailing Stop Loss indicator.
This indicator is suitable for use in all timeframes and markets.
The Multiple time Frame function allows for the TrailingStop to be Calculated from another timeframe and shown in the current chart.
For Example:
4 Hour TrailingStop line on a 60 Minute Chart
Daily TrailingStop line on a 4 Hour Chart
15 Minute TrailingStop line on a 5 Minute Chart
COLORS
The Color GREEN indicates the presence of a Bullish Trend.
The Color RED indicates the presence of a Bearish Trend.
The Color YELLOW indicates that the market is Sideways a.k.a. Flat a.k.a. Choppy.
You have the option of COLORING the BAR to match the current TrailingStop color.
You have the option of applying a Smoothing to the TrailingStop line.
You have the option of showing a Standard Deviation Band based on the TrailingStop line.
SETTINGS
The indicator has seven parameters:
1. Lookback - # of previous bars used to calculate the trailing stop
2. Std Dev Lookback - # of previous bars used to calculate the Standard Deviation
3. Std Dev X – Multiplier of Std dev. i.e. 2 = 2x Std Dev of the TrailingStop line
4. Color Bar? – toggle Coloring of the Candlestick/Bars on the chart
5. Show Std Dev? – toggle showing the Std Dev bands.
6. Smooth? – toggle Smoothing the TrailingStop line
7. Timeframe - Select the time frame used to calculate the TrailingStop (1 Hour, 4 Hours, 1 Day, 1 Week, etc.)
Changing these settings individually or in combination will yield varying results.
2 Alerts are provided with the indicator: CLOSE OVER STOP line and CLOSE UNDER STOP line

Ultimate Risk Management System 📈With this tool you can run multiple instances for Stop Loss, Take Profit, Trailing Stop or Trailing Take Profit.
Why use it?
> Some trading platforms don't offer special tools like Trailing Stop;
> In case they do, they don't have to know where you put your stops;
> TradingView offers high performance, you can see the tool working in real-time.
Main Features:
- Real-time;
- Long Order;
- Short Order;
- Stop Loss;
- Take Profit;
- Trailing Stop Loss;
- *Trailing Take Profit.
Disclaimer: This system may help you cut out your losses or lock in your profit, but it does not guarantee profit. Always use at your own risk.

NIBIRU SUPPORT AND RESISTANCEThe Nibiru Support and Resistance Indicator is set of visual tools providing better trading experience. It is based on the classics of trading: horizontal trend lines and moving averages. It's main feature are automated support and resistance lines defining the main trading range and market structure, making it a superior tool to trade based on horizontal trend lines .
The set of moving averages along with entry and stop loss levels allows for easier risk management with trending strategies.
What does it plot?
Automatic horizontal support and resistance levels
Main and local trading ranges
Four moving averages with adjustable types and periods
Entry and stop-loss level hints for trending strategy
Pivot points based on candle patterns
London, New York and Tokyo trading sessions indication based on exchange time
Visual indication of current trend strength
Indicator components:
Horizontal trendlines
Main trading range – dictating general price structure
Local trading range – indicating current trading cluster
Fibonacci trendlines – Fibonacci based trendlines dividing main trading range into tradeable support and resistance lines
Fibonacci extensions of main trading range – for price trending out of main range it gives potential take profit levels by extending the range by selected Fibonacci ratio
Moving Averages
MA 1 – fastest moving average for trending strategy entries. In addition this moving average provides color based information on current short term trend:
Green – uptrend
Red – downtrend
Gray - indecision
MA 2 – slower moving average for trending strategy risk management
MA 3 and MA 4 – main trend change and support/resistance zone
Entry/Stop Loss hints
Entry dots – early entry for moving average trending strategy
Stop Loss (SL) dots – safe SL levels providing at least 1:2 RR setups at entry point
Pivot Points (beta) - Hints of potential short term trend reversals based on candle setups and patterns. Early beta, currently in testing–improvements and more patterns to be added.
Sessions - Indicating main trading sessions. This is a very important tool for trading traditional and OTC markets like forex. Knowing when money comes in and out of the market during the trading-day is crucial, because liquidity and volatility is the bread and butter for a consistently profitable trader. Due to limitations, this indicator is based on the exchange time zone. In the near future we will add a time offset option to fine tune to the time zone of the exchange you are trading on. Sessions are visible on all time frames below 4H.
The Nibiru Support and Resistance Indicator works on all assets that provide trading volume and all time frames.
Use the link below or PM me to gain access to the indicator.

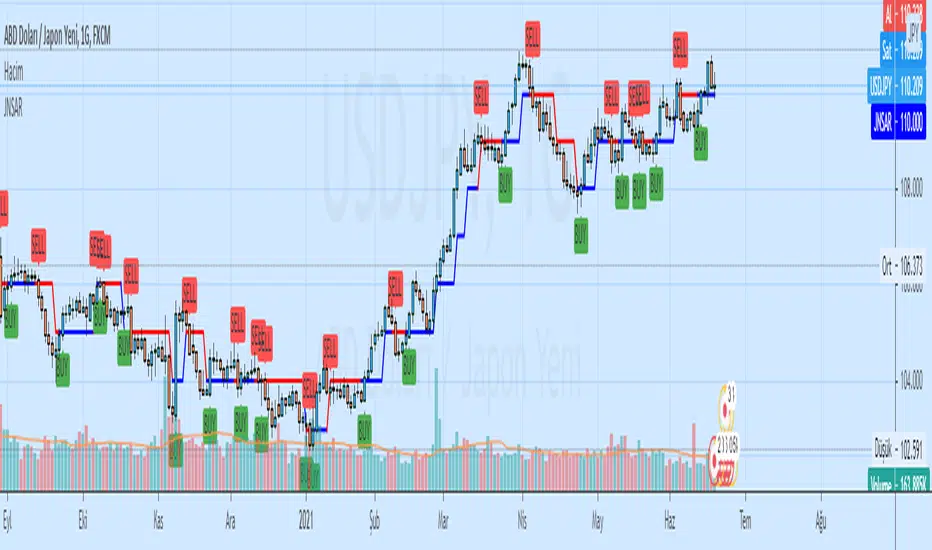
IZS - Intelligent Zone SelectorEnglish:
Better in volatile stocks, may fail in low volume. Aims to select safe zones to hold and stop in any danger. However, you are responsible for any loss
Türkçe:
Volatil hisselerde daha iyi çalışır, düşük hacimlerde başarısız olabilir. Hisse taşımak için güvenli bölgeyi seçmek ve herhangi bir tehlikede stoplamayı amaçlar. Ancak oluşabilecek zararlardan herkes kendisi sorumludur.

Cardistry ♠♥♦♣♠♥As always -No repaint, Signals are real time♦♣
First release version is not tunned, parameters need testing and manual tuning from users
Label meanings and color is self explanatory and pretty straight forward
Signals deviate from Candlestick sequences and Volatility

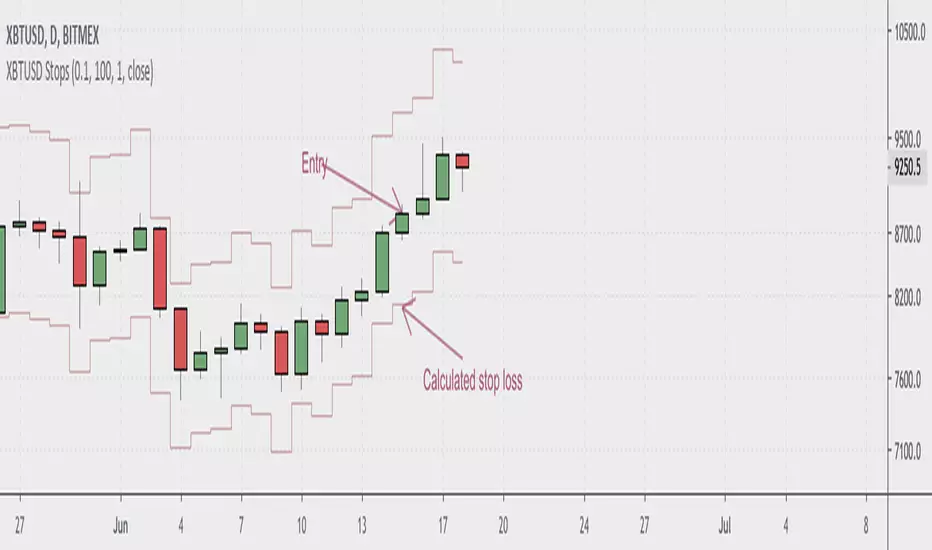
BitMex XBTUSD StopLossShows you where to place your stop loss when trading the Bitcoin swap and futures contracts on BitMex. Enter your account size, position size, and desired risk per trade in the indicator settings. If stop seems too tight, use a smaller position size. Most seamlessly used with cross leverage on BitMex. Make sure to keep an eye on the liquidation level for your trades.
Equilibrium - Strategy This is a straight forward strategy:
1. Buy at signal
2. Set stop-loss at red line
3. Sell at signal or when stop-loss triggers
Designed for 30min. crypto charts
Always backtest before use

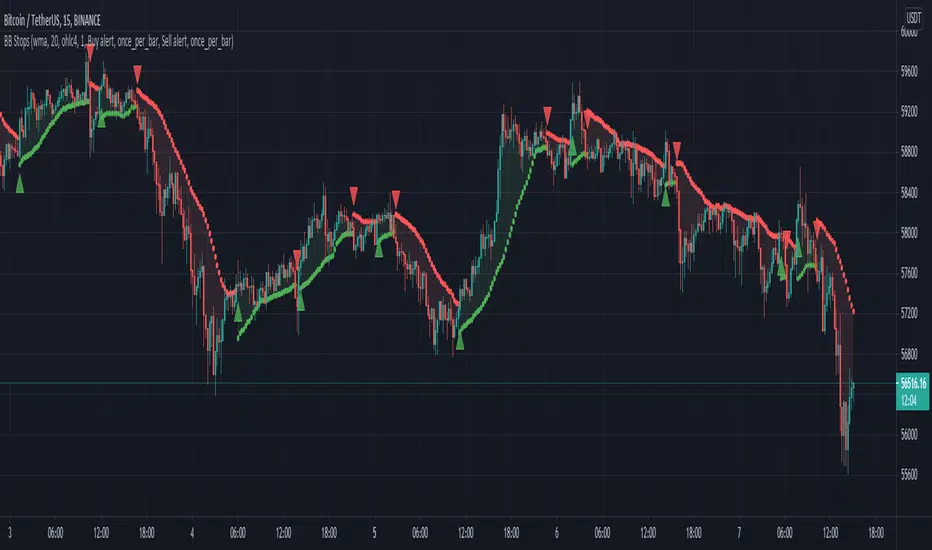
Bollinger Band stops - JDI didn't find a BB stops indicator on TV, so I wrote one myself.
You can select various ma types as a base anchor for the calculations.
This indicator can have various use cases similar to Supertrend or Parabolic SAR: as a trend indicator, as a training stop loss,...
JD.