CM_Williams_Vix_Fix_V3_Ultimate_Filtered_AlertsNew Williams Vix Fix - Major Update - Filtered Entries - Additional Alerts - And Much More...
***01-05-2015 Major Updates Include:
***ALL Features Available To Turn On/Off On The INPUTS Tab!!!
FILTERED ENTRIES -- Plus AGGRESSIVE FILTERED ENTRIES - HIGHLIGHT BARS AND ALERTS
*Alerts Enabled for 4 Different Criteria
*Ability To Plot Alerts True/False Conditions on top of the WVF Histogram
*Ability To Turn Off the Histogram and just see True/False Alerts Conditions.
*Ability to Turn All Price Bars Gray, and Color the Price Bars to Match the WVF Colors Exactly, Including All 3 Entry Types.
*Added Inputs To Adjust the 3 Numerical Inputs That Define The PRICE ACTION FILTER! Explained in Video.
*Main Video is 34 Minutes…However, the New Features Are Extensive and I Go Thru All Features In Depth.
*I Recommend Using the VSTOP Indicator. I Go Through How To Customize It In Video.
Videos:
Video: The Evolution of the Williams Vix Fix - 12 Minutes.
vimeopro.com
Video: Williams Vix Fix V3 - Major Update - Additional Alerts and Filtered Entries - 34 Minutes.
***Video Covers In Detail How To Use The Multiple Alerts And Plot Styles Available.
vimeopro.com
Posts To Reference…
New Video on How to Create Alerts W/ Any Custom Indicator.
www.tradingview.com
Great Confirming Indicator for the Williams Vix Fix
CM_WILLIAMS_VIX_FIX FINDS MARKET BOTTOMS
Support

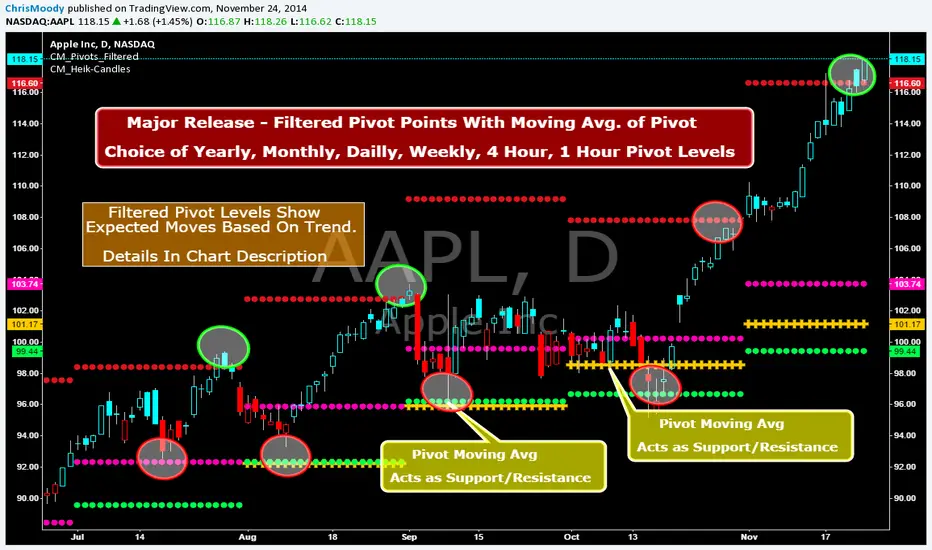
CM_Pivot Points_M-W-D-4H-1H_FilteredFamous Filtered Pivots Indicator -Many TimeFrames Available
CM_Pivot Points_M-W-D-4H-1H_Filtered
***Special Thanks to TheLark...AKA...The Coding Genius For Providing His Expertise...
***New Feature - Ability to turn On/Off Pivot Moving Average
***New Feature - Ability to turn On/Off Filtered Pivots (Explained Below)
Available Timeframes (Change In Inputs Tab):
1 Hour
4 Hour
Daily
Weekly
Monthly
Yearly
***All Features Available in Inputs Tab
-Ability to Plot just 1, or all Pivot Timeframes
-Defaults to Monthly Pivots
-Ability to turn On/Off Pivot Moving Average
-Ability to turn On/Off Filtered Pivots
-Ability to Plot S3 and R3 on 1 Hour and 4 Hour Pivots
***FILTERED PIVOTS!!!
-THIS IS A WAY TO FIND THE HIGHEST PROBABILITY MOVES
-IF CURRENT PIVOT IS GREATER THAN PREVIOUS PIVOT (INCLUDING MARKET THRESHOLD CALCULATION) THEN PIVOT, S1, & R2 PLOT
-IF CURRENT PIVOT IS LESS THAN PREVIOUS PIVOT (INCLUDING MARKET THRESHOLD CALCULATION) THEN PIVOT, S2, & R1 PLOT
-***THIS IS A WAY TO FILTER OUT PIVOTS AND ONLY PLOT THE LEVELS THAT ARE EXPECTED TO BE MAJOR SUPPORT AND RESISTANCE
***VIDEO COMING SOON WHERE i WILL GO OVER IN DETAIL THE THOUGHT PROCESS AND METHODOLOGY
CM ATR Stops/Bands - Multi-TimeFrameCM_MTF ATR Bands/Stops
Many Options Available Via Input Tab:
-Chart Defaults to Upper and Lower ATR's Based on Current Chart TimeFrame
-Ability to Plot either Upper and/or Lower ATR's
-Ability to Change the Time Frame ATR's are Based On!
-Ability to change Look Back Period and ATR Multiplier Individually for Both Time Frames
-This Gives you the ability to plot same Time Frame with (for ex.) a 5 ATR with a 1.5 Mult and a 14 ATR with a 2.0 Mult etc.
-Or you can plot Daily ATR's on a 60 minute Chart etc.
-ATR Multipliers are Calculated with Code that allows "Non Whole Numbers" Allowing Ability to use 1.5 ATR's, 1.8 ATR's etc.
***Endless # of Combinations can be used!!!!

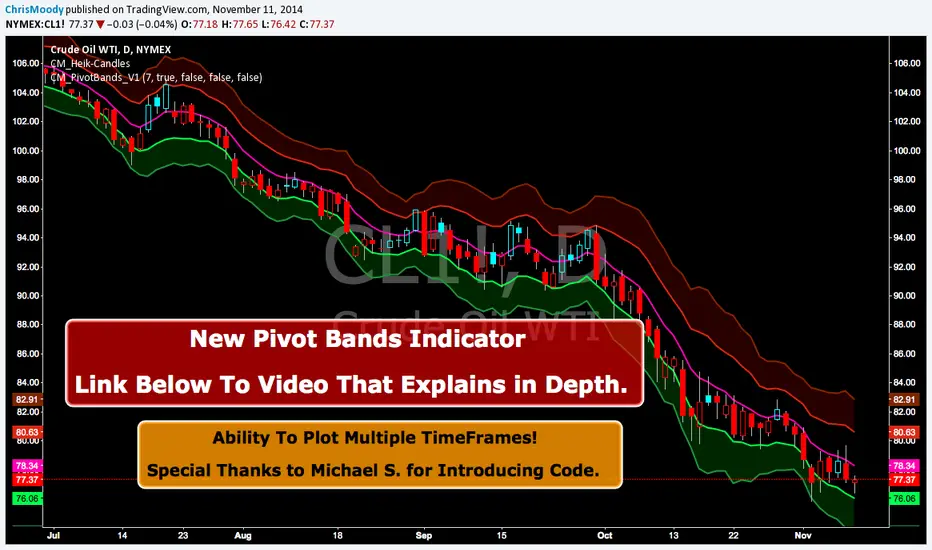
CM Pivot Bands V1CM_Pivot Bands V1
Special Thanks to Michael S for Introducing Code.
Instead of a Long Write Up I Recorded A Video Going Into Detail On V1 Of This Indicator. Please View To See My Initial Findings, My Thoughts For V2, And Items I Need YOUR Help With!!!
In Inputs Tab Indicator Has Ability to Turn On/Off Multiple TimeFrames…Thought Process Explained In Video.
Link To Video:
vimeopro.com
Link To PDF Mentioned In Video:
d.pr
CM ATR PercentileRankCM ATR PercentileRank - Great For Showing Market Bottoms.
When Increased Volatility to the Downside Reaches Extreme Levels it’s Usually a Sign of a Market Bottom.
This Indicator Takes the ATR and uses a different LookBack Period to calculate the Percentile Rank of ATR Which is a Great Way To Calculate Volatility
Be Careful Of Using w/ Market Tops. Not As Reliable.
***Ability to Control ATR Period and set PercentileRank to Different Lookback Period
***Ability to Plot Histogram Just Showing Percentiles or Histogram Based on Up/Down Close
Fuchsia Lines = Greater Than 90th Percentile of Volatility based on ATR and LookBack Period.
Red Lines = Warning — 80-90th Percentile
Orange Lines = 70-80th Percentile
Other Useful Indicators
Williams Vix Fix
CM_RSI EMA Is a Great Filter for Williams Vix Fix

CM Opening Range-Asia and Europe SessionCM Opening Range Asia AndEurope Sessions
Requested by rayhug1 to use Asia Range of 5pm Est to 2am Est...uses 540 minutes (5pm to 2am Est — 9 Hours) to calculate the Range...then breakouts trigger after 2am
-Ability to change Start and End Times to use any entire session.
---Defaults to 540 minutes (9 hours) but Opening Range Calculation can be changed to 1 hour, 2 hour etc. in Inputs tab
***Known Bug…Currently will NOT Plot accurately the U.S. Session from 0800 to 0759. Will Update Indicator when Fixed.
-Ability to Change the Start and End Times to Accommodate any session.
—Default is 1700 to 1659 (Asian Range)
—Europe Session 0200 to 0159
***All times are based on New York Time or Eastern Standard time … GMT-5
***Times will change based on Daylight Savings Time.

Earnings S/R Levels [LazyBear]These levels are based on price around earnings day. I have implemented support for 2 calculation modes:
Mode 1: Level = (low of 1 day prior to earnings + high of 1 day after earnings) / 2.0
Mode 2: Level = (hl2 of 1 day prior to earnings + hl2 of 1 day after earnings + close from earnings day) / 3.0
Chart above shows "Mode 1". Mode can be changed via options page.
This indicator was requested by user @mika2k1ff. I learnt more about this idea from @DanV and @TimWest (Thanks guys :)). BTW, TimWest has an indicators package, "Key Hidden Levels", that has this and more.
Do let me know how you use this, I am very intrigued by the potential this idea shows. Thanks.
For a complete list of my indicators:
- GDoc: docs.google.com
- Chart:

Cueing Off Support And Resistance Levels Cueing Off Support And Resistance Levels, by Thom Hartle
The related article is copyrighted material from Stocks & Commodities.

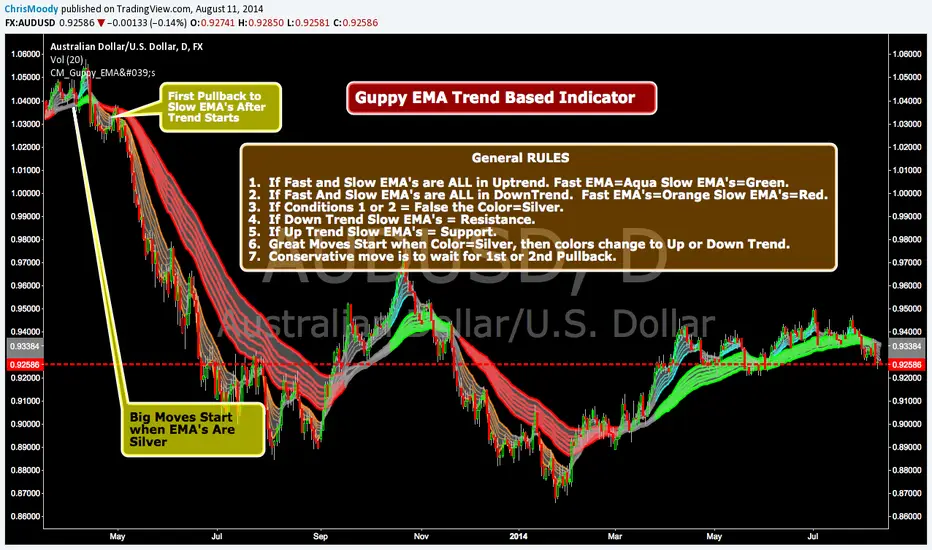
CM_Guppy_EMAGuppy EMA Trend Based Indicator Requested by 2use
General RULES
1. If Fast and Slow EMA's are ALL in Uptrend. Fast EMA=Aqua Slow EMA's=Green.
2. If Fast And Slow EMA's are ALL in DownTrend. Fast EMA's=Orange Slow EMA's=Red.
3. If Conditions 1 or 2 = False the Color=Silver.
4. If Down Trend Slow EMA's = Resistance.
5. If Up Trend Slow EMA's = Support.
6. Great Moves Start when Color=Silver, then colors change to Up or Down Trend.
7. Conservative move is to wait for 1st or 2nd Pullback.
CM_Williams_Vix_Fix Finds Market BottomsLarry Williams Developed This Incredible Indicator. It Gives The Same Readings The VIX does for Stock Index’s…But This Indicator Works on All Asset Classes.
I Customized The Settings Slightly To Create “Percentile” Based Highlight Bars…So You May Need To Adjust Slightly For Your Asset Class. These Are The Standard Settings Shown Here. Designed For Daily Charts…But Works GREAT On Intra-Day Charts!!!

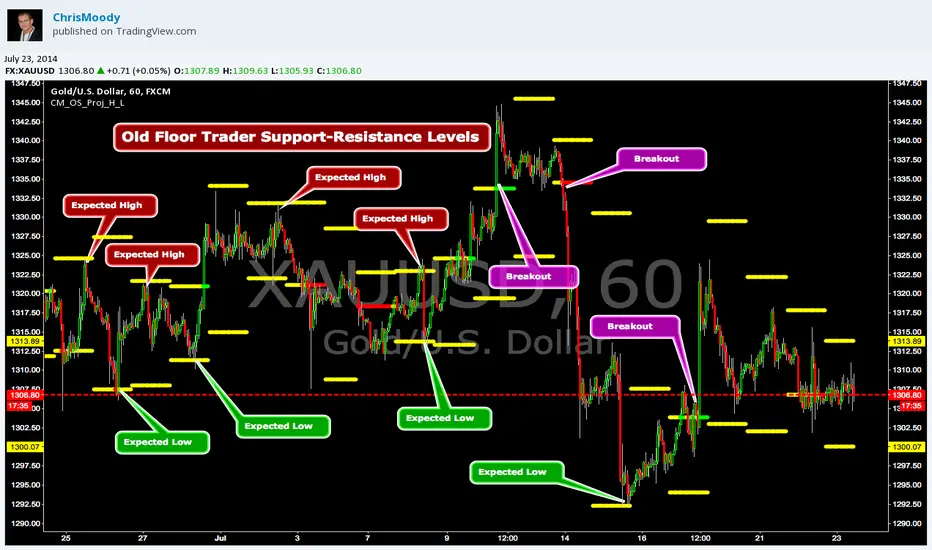
CM_OldSchool_Projected_high_LowHeard this story from Larry Williams…the trader who holds the record for winning the U.S. Trading Championship by turning $10K in to 2 Million.
A trader named Owen Taylor developed this formula as a Floor Trader before to calculate the Projected High and Low of the next day.
The formula worked so well…Owen charged other Traders 1K to get it.
I was pretty impressed with the results…so I coded it for the Weekly, Monthly, Quarterly, and Yearly Projected High Low.
While Owen considered these levels to be major support and resistance, Larry has developed many strategies based on the Breakout of the Projected High Low.
Therefore I coded it so the Levels would plot Yellow, and change to Green if the Projected High was taken out, and Red if the Projected Low was taken out.
***I’ve noticed on many instruments, Stocks, Index’s, Forex etc., depending on the instrument it works great as Support/Resistance or Breakouts.
***On a Daily Chart put the Quarterly and Yearly levels on SPY and EURUSD and go back about 10 years. Levels are pretty accurate.
CM_Pivot Points_CustomCustom Pivots Indicator - Plots Yearly, Quarterly, Monthly, Weekly, and Daily Levels.
I created this indicator because when you have multiple Pivots on one chart (For Example The Monthly, Weekly, And Daily Pivots), the only way to know exactly what pivot level your looking at is to color ALL S1 Pivots the same color, but create the plot types to look different. For example S1 = Bright Green with Daily being small circles, weekly being bigger circles, and monthly being even bigger crosses for example. This allows you to visually know exactly what pivot levels your looking at…Instantly without thinking. This indicator allows you to Choose any clor you want for any Pivot Level, and Choose The Plot Type.

Indicator: Relative Volume Indicator & Freedom Of MovementRelative Volume Indicator
------------------------------
RVI is a support-resistance technical indicator developed by Melvin E. Dickover. Unlike many conventional support and resistance indicators, the Relative Volume Indicator takes into account price-volume behavior in order to detect the supply and demand pools. These pools are marked by "Defended Price Lines" (DPLs), also introduced by the author.
RVI is usually plotted as a histogram; its bars are highlighted (black, by default) when the volume is unusually large. According to the author, this happens if the indicator value exceeds 2.0, thus signifying that a possible DPL is present.
DPLs are horizontal lines that run across the chart at levels defined by following conditions:
* Overlapping bars: If the indicator spike (i.e., indicator is above 2.0 or a custom value)
corresponds to a price bar overlapping the previous one, the previous close can be used as the
DPL value.
* Very large bars: If the indicator spike corresponds to a price bar of a large size, use its
close price as the DPL value.
* Gapping bars: If the indicator spike corresponds to a price bar gapping from the previous bar,
the DPL value will depend on the gap size. Small gaps can be ignored: the author suggests using
the previous close as the DPL value. When the gap is big, the close of the latter bar is used
instead.
* Clustering spikes: If the indicator spikes come in clusters, use the extreme close or open
price of the bar corresponding to the last or next to last spike in cluster.
DPLs can be used as support and resistance levels. In order confirm and refine them, RVI is used along with the FreedomOfMovement indicator discussed next.
Freedom of Movement Indicator
------------------------------
FOM is a support-resistance technical indicator, also by Melvin E. Dickover. FOM is the ratio of relative effect (relative price change) to the relative effort (normalized volume), expressed in standard deviations. This value is plotted as a histogram; its bars are highlighted (black, by default( when this ratio is unusually high. These highlighted bars, or "spikes", define the positioning of the DPLs.
Suggestions for placing DPLs are the same as for the Relative Volume Indicator discussed above.
Note that clustering spikes provide the strongest DPLs while isolated spikes can be used to confirm and refine those provided by the Relative Volume Indicator. Coincidence of spikes of the two indicator can be considered a sign of greater strength of the DPL.
More info:
S&C magazine, April 2014.
I am still trying these on various instruments to understand the workings more. Don't forget to share what you learn -- any use cases / ideal scenarios / gotchas, would love to hear them all.
