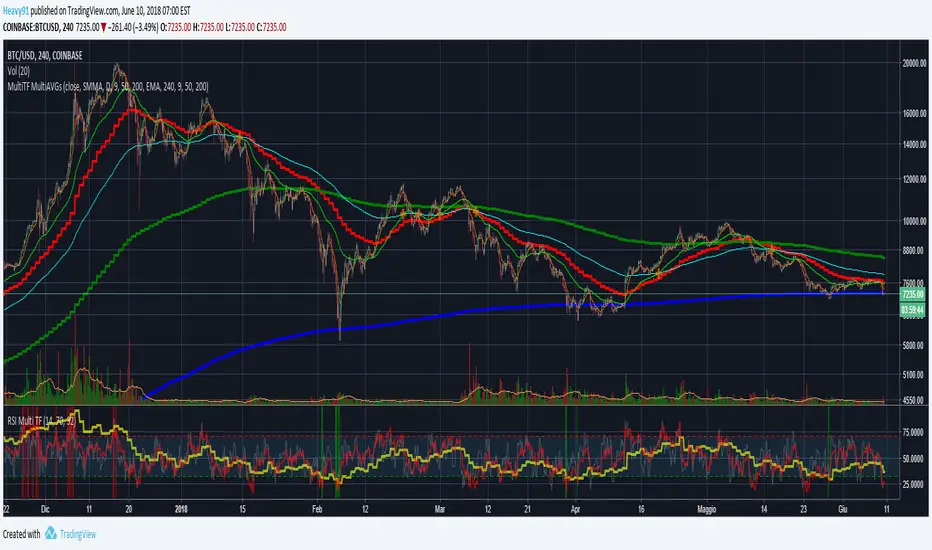
Ultimate 'Multi-Timeframe' Multi-AveragesPlots different kinds of averages (EMA, SMA, SMMA, WMA, VWMA) referred to a fixed timeframe/period indipendent from the one that you are watching (example: plot daily EMA on the 4h chart).
Highlights the crossing of averages.
Timeframe
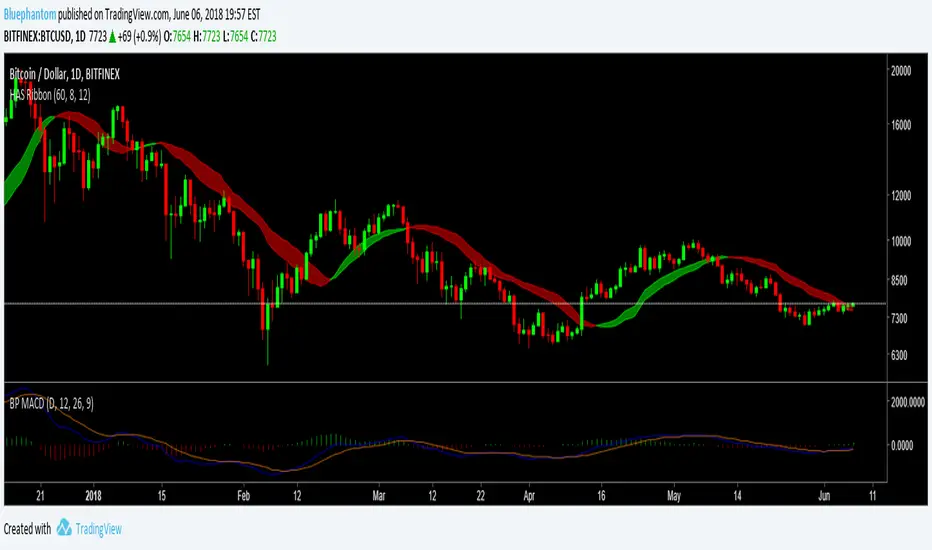
Heikin-Ashi VWMA Smoothed Trend Ribbon with Custom time framesThis is a Heikin - Ashi Smoothed Trend Ribbon.
I'm using the VWMA for its smoothing calculation.
The Ribbon is based on the open and close of the Heikin - Ashi candles and doesn't show the wicks.
I have also allowed the viewing of different time frames to the current chart layout.
If you have any comments and feedback please comment below.

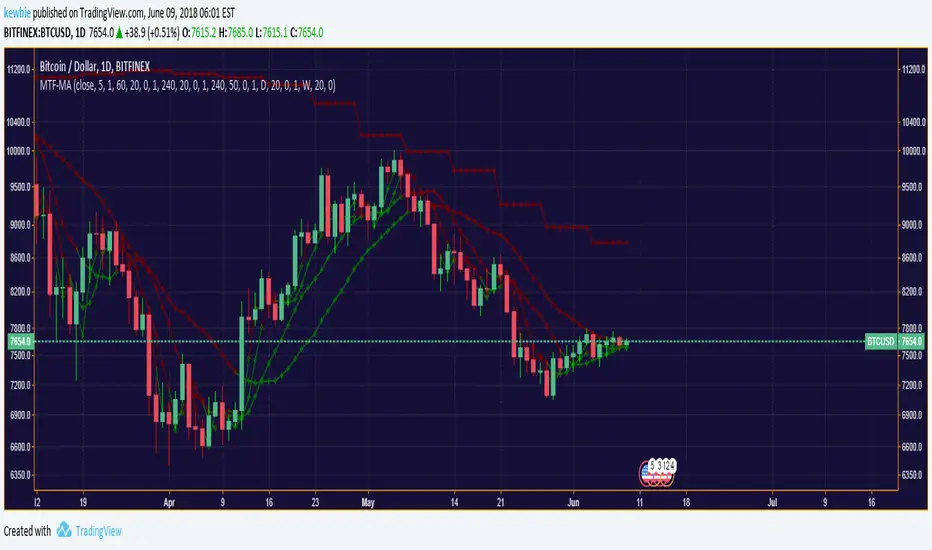
Multiple Timeframe Moving Average SystemModified code from ChrisMoody, RicardoSantos & Ricardo M Arjona.
Allows for multiple moving average types across custom time-frames.

EMAcrossover_RSI Buy/sell signal-TRXBTC_15min by rajista EMAcrossover_RSI Buy/sell signal Strategy
To be used in combination with Alerts script, both can be added to your tradingview charts (Chart time-frame should be set to 15min) like you add any other simple indicator.
Add this script to your favorites and once you have been granted access, you will be notified in your Tradingview notifications section, then you can go ahead and add these two scripts into your charts from your favorite section of Indicator menu in Tradingview.
Benefits of this strategy:
1> Fully automated buy/sell signals 24x7
2>Your trades will always be based on a certain entry and exit plan.
3>No emotions involved with these trading calls, so no chance of FOMO buying/Panic Sell
4>You can fully customize the settings with a simple click(customization details given below)
5>Its completely free of cost!!!
There are two parts of this automated trading call system:
1>Strategy script- Gives the buy/sell signals based on the settings provided.
2>Alert script- Gives Alert notifications in tradingview when a buy/sell call is made.
Principle of working is very simple to understand:
Stragey script makes:
Buy call - When the 9EMA crosses above the 21EMA or RSI level-20 is reached in 15min-Chart.
Sell call -When 9EMA crosses below the 21EMA or RSI level-70 is reached in 15min-Chart.
Above values of EMA's and RSI are default values , which can be changed easily in settings panel of Strategy script.
Alert Script allows you to add Alerts when these buy/sell calls are made.
To create a Buy call alert:
1> Click on the create alert icon in your chart (top-centre)
2>Click on Condition -drop down button and select EMAcross_rsi_Alerts
3>Below that bar you will see another bar titled "Buy"-click on its drop down menu and select "Crossing Down"
4>Below that bar right next to Value change 0 to 0.9.
5>Set expiration date for your alerts as per your wish
6>Ensure "Show Popup" and "Play sound" is checked
7>You can check option of sending the alert to your email also.
Finally click on create.
To create Sell Alert:
Repeat same process, except that, after step 2- Do this- change the "long" option to "short" by clicking on the drop down menu right next to the first bar.
Click on create, Finally both of your automated buy/sell call alerts will be configured.
I know its been 2-3 days since i tweeted about this strategy and now i am making it available, you can understand i had to put in a lot of working hours, towards creating the source code for the strategy script and then for alerts script and even more so towards finding the perfect default settings which can be used straight away by anyone, even if you are new in crypto trading, apart from the time which i dedicate to analyse charts and pass on the knowledge/info to you all.
My next post will be even more helpful to you people as i am currently testing "fully automated trading" yea you heard that right!! - This system will trade 24x7 for you guys/girls no matter wherever you are either you are sleeping or watching a movie, your trades would still be getting executed with a proper entery-exit plan on a crypto exchange.
TDI Complementary Overlay by YardleyRosetteMay 2018, Traders Dynamic Index Overlay Indicator ( Free Indicator )
The Full 'TDI' Complementary Overlay for all securities. FOREX, BITCOIN (CRYPTOCURRENCIES), STOCKS, etc.
This is the overlay of Traders Dynamic Index updated in my knowledge to optimal settings.
Added an "Xtreme" Phaser for noticing major moving average/trendline breakouts.
Added representation of Overbought/Sold level lines.
Moving Averages visually reordered.
Settings I found of moving averages to correlate the best with Traders Dynamic Index all in one overlay indicator.
Using KK_Traders Dynamic Index_Bar Highlighting which is the closest to Traders Dynamic Index Pro on MT4, I set the best alignment to Traders Dynamic Index with potential target price points as an overlay indicator representing Traders Dynamic Index components and a level as moving averages on price chart.
"Phaser", as in phase changing; shifting direction.
Especially for those who do not have TV PRO.
______________
El Índice Dinámico de Comerciantes encimadas a gráficas de precio.
En especial para quienes solo pueden usar 3 indicadores.
_____________

MTF Center of Gravity Grid [checkm8]Hello and welcome to my multi-timeframe center of gravity (COG) grid.
Center of gravity is a zero-lag oscillator created by John Ehlers and to get a better understanding of it, you can read his original works here: www.mesasoftware.com
My oscillator features a grid from four timeframes (selected by the user), to show the whether the center of gravity line is above or below its relative EMA. You can use this indicator as a tool to spot potential changes in the trend as they occur. In addition to this, the oscillator displays the COG line, with its relative EMA, on the current timeframe.
By default:
1) The fill between the COG and the EMA will be navy blue when the COG is dominant, and maroon when the EMA is dominant.
2) The grid will show fuchsia-colored blocks when the COG is above its relative EMA on the selected MTF timeframe, and orange when the COG is below the EMA.
If you have any questions, suggestions, or concerns, feel free to reach out.
Happy trading!

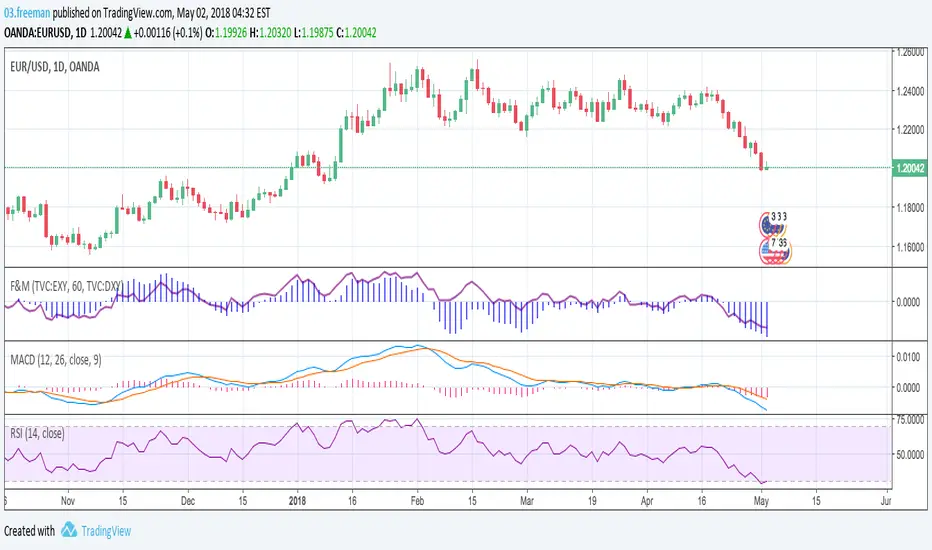
Strenght and MomentumThe scope of this script is to measure momentum and strenght of EURO and DOLLAR using their indexes.
Forza (line) above 0 means EURO is stonger than DOLLAR
Momento (histogram) above 0 means EURO has a positive momentum against DOLLAR
The added value to see MACD and RSI directly on EURUSD chart is that indexes consider also other pairs so their RSI and MACD has a larger view on forex markets.
Script has also an option for multi timeframes.
I think that could be used as filters for LONG or SHORT positions in lower time frames.
Single_Timeframe_3EMA + Current_Timeframe_3SMMAPlots 3 EMA from a larger timeframe (day, week) and 3 SMMA from the current one.
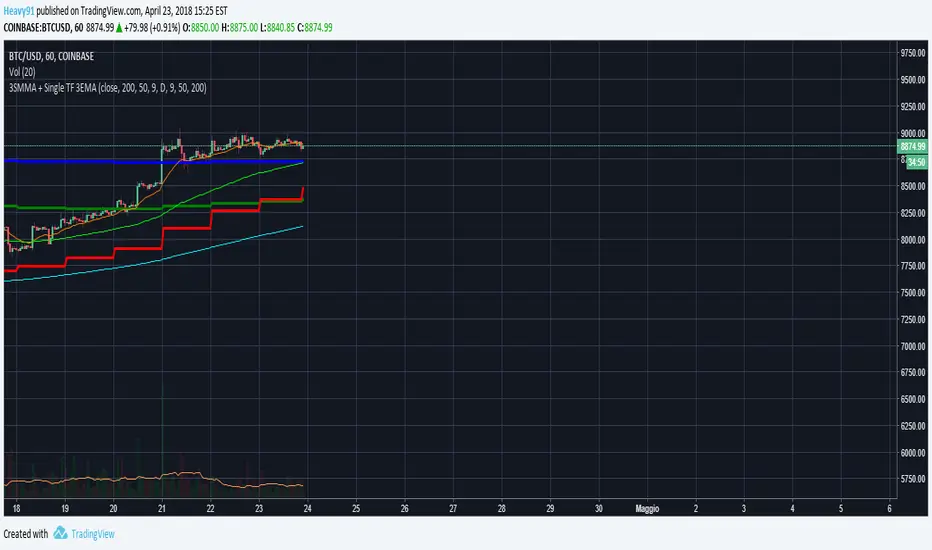
Single Timeframe 3EMA + Current Timeframe 3SMMA
Plots 3 exponential moving averages from a bigger timeframe (Day, Week) and 3 smoothed moving averages from the current timeframe.

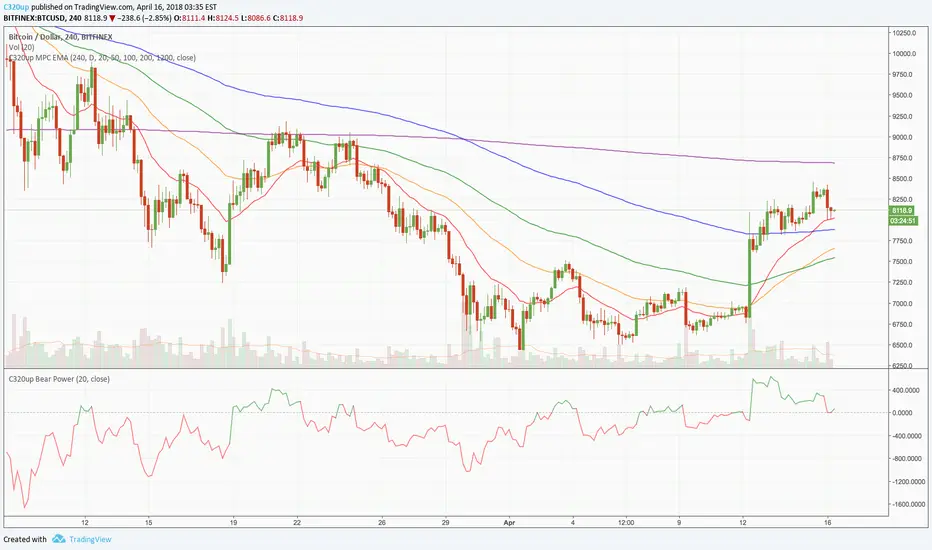
C320up MPC EMA 5 by Chart ResolutionC320up "MPC" EMA 5 by Chart Resolution
- This is a custom version of our C320up EMA by Chart Resolution.
This version has 5 EMA’s and is easier to quickly switch chart resolutions, this time using only 2 chart periods.
Why have filtered chart resolutions?
Some EMA’s don’t tend to give a useful indication at a given chart resolution, so any resolution not selected will not have the EMA lines appear on the screen.
Default resolutions are “240” Minutes (4 Hour), and “D” (1 Day).
With these settings the EMA lines will only appear on the 4 Hour and Daily charts.
Default EMA’s are 20, 50, 100, 200, and 1200.
Why 1200 you may ask. 1200 on the 4 Hour chart is equivalent to 200 on the Daily chart.
You can change these inputs to suit your requirements.
The first input is used to manually type in the chart resolution, as the TV built in drop downs don’t have all of the chart resolutions, 240 Minutes (4 Hour) for example.
If you don’t want them all to show on the screen, you can un-check them in the Style tab in settings.
Check out our scripts page for more indicators. (Including our Bear Power Indicator)
Any questions, just leave a comment.
If you want more control over the chart resolutions, try using this one:
"C320up EMA by Chart Resolution"
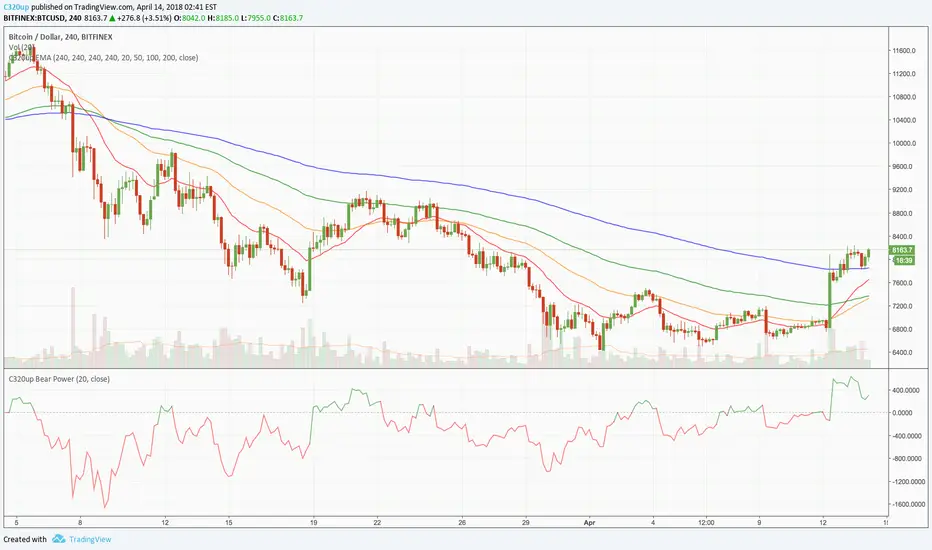
C320up EMA by Chart ResolutionC320up EMA by Chart Resolution
- You may only want your EMA’s to appear on specific chart resolutions.
Use this indicator to select up to four resolutions and four EMA’s.
Sometimes a certain EMA (Exponential Moving Average) doesn’t give a good indication on a smaller time frame or vice versa, so you can customise these to suit.
Default settings are “240” Minutes for all EMA’s to appear.
Default EMA’s are 20, 50, 100, and 200.
To change the resolution, type in one of these examples:
15 = 15 Minutes, 60 = 1 Hour, 240 = 4 Hours, D = Day, W = Week, M = Month, 2M = 2 Months, etc.
You could have just the one EMA appear on multiple time frames, or have 2 appear on 2 time frames, etc.
Check out our scripts page for more indicators.
Any questions, just leave a comment.
Simpler Trading MTF Trend 2018Any experienced trader knows that you can never get the whole ‘picture’ by looking at just one time frame. That is why we’ve created the Multi Time Frame Trend Analysis Indicator. With a glance at a single chart, you can determine across multiple timeframes the overall trend.
www.simplertrading.com

NeoButane Bitfinex BTC Longs vs. Shorts Tickers Simplified (MtF)With optional overlay for high/low candle values and daily resolution close. Now with MtF to add customization .
Made because I'm too lazy to constantly re-add tickers and to reduce noise.
C320up Strategy Tester Start TimeC320up Strategy Tester Start Time
This is a little snippet you can paste into your Strategy to set the testing start date and time.
It is not a Strategy per se, though is an example with the timestamp script included.
Instructions are fairly straight forward, and are listed in the script.
If for some reason you also wanted an end date, that too is possible. Just leave a note in the comments.
Disclaimer: We searched for a similar script on TV, and could not find anything at this point in time.
You can set your preferred date and time in the input section of the settings.
Enjoy!

Candle FMTFMultitimeframe candlesticks with shadows. Script draws each next candle gradually. Sorry for bad english. Good Luck in tradework!

TSP Cycles DoubleDouble Cycles
You can setup higher timeframe cycle period's as argument, default is M30
Always show daily EMAThis script will always plot the daily EMA regardless of which timeframe you are on.

Volume Weighted Average Range Bands [DW]This is an experimental study designed to identify the underlying trend bias and volatility of an instrument over any custom interval TradingView supports.
First, reset points are established at points where the opening price of the interval changes.
Next, Volume Weighted Average Price (VWAP) is calculated. It is the cumulative sum of typical price times volume divided by the cumulative volume. The cumulation starts over upon each reset point.
After that, Volume Weighted Average Range (VWAR) is calculated. The formula structure is the same as VWAP, except using range rather than typical price.
Lastly, the bands are calculated by multiplying the VWAR by the specified multiplier (approximate Golden Ratio by default) and by 1 through 5, then adding to and subtracting from the VWAP.
Custom Bar Colors are included.

Multi-Bollinger [DW]This is an experimental study designed to visualize trend activity and volatility using a set of two Bollinger Bands calculated with a basis moving average type of your choice.
The available moving averages in this script are:
-Exponential Moving Average
-Simple Moving Average
-Weighted Moving Average
-Volume Weighted Moving Average
-Hull Moving Average
-Least Squares Moving Average
-Arnaud Legoux Moving Average
-Coefficient of Variation Weighted Moving Average
-Fractal Adaptive Moving Average
-Kaufman's Adaptive Moving Average
In addition, a middle filter is calculated by taking the median of the two basis lines.
Multi-Timeframe functionality is included. You can choose any timeframe that Tradingview supports as the basis resolution for the bands.
Custom bar color scheme is included with four options to choose from.
