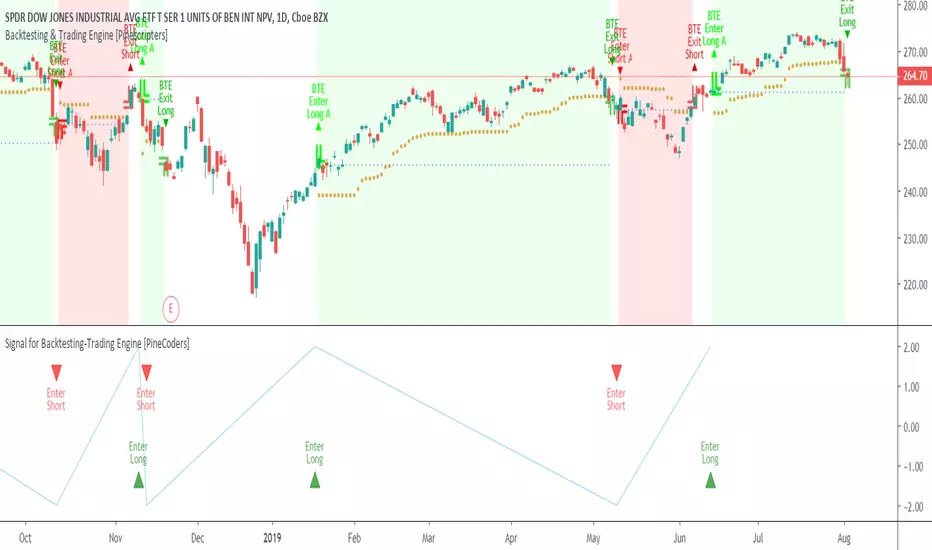
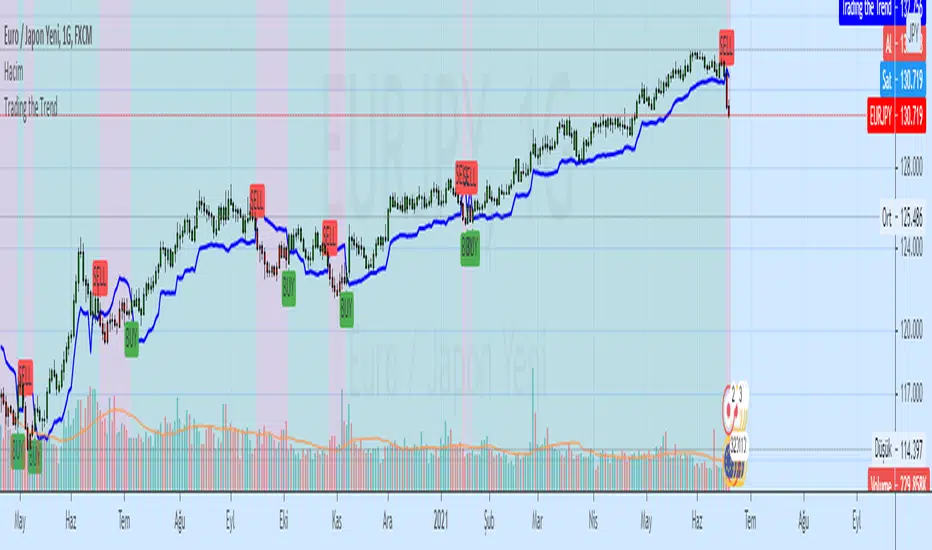
Signal for Backtesting-Trading Engine [PineCoders]This is a companion script to the PineCoders Backtesting-Trading Engine. It illustrates how to build a signal plot in another script, which can in turn be fed in the Engine to provide entry, exit, filter and stop information.
Connection to the Engine is done through its “External Indicator” input field at the very bottom of the Engine’s Settings/Inputs.
The Engine must be operating in study mode to be able to connect an external indicator to it.
The way this script builds the signal is straightforward, as you will see in the code. Two aspects are worth mentioning:
The “FudgeStop()” function used to fudge the stop value by one tick for the rare cases where it will match one of the protocol reserved values, i.e. 1, 2 or 3.
The priority and exclusivity given to the different types of signals in the signal-building “Signal = …” line. No two signals can be sent simultaneously through the signal plot, except for the entry and stop combination.
You can determine in this script’s Settings/Inputs the type of signals that will go through the signal plot.
This script respects the following protocol:
EXTERNAL SIGNAL PROTOCOL
Only one external indicator can be connected to a script; in order to leverage its use to the fullest, the engine provides options to use it as either an entry signal, an entry/exit signal or a filter. When used as an entry signal, you can also use the signal to provide the entry’s stop. Here’s how this works:
For filter state: supply +1 for bull (long entries allowed), -1 for bear (short entries allowed).
For entry signals: supply +2 for long, -2 for short.
For exit signals: supply +3 for exit from long, -3 for exit from short.
To send an entry stop level with an entry signal: Send positive stop level for long entry (e.g. 103.33 to enter a long with a stop at 103.33), negative stop level for short entry (e.g. -103.33 to enter a short with a stop at 103.33). If you use this feature, your indicator will have to check for exact stop levels of 1.0, 2.0 or 3.0 and their negative counterparts, and fudge them with a tick in order to avoid confusion with other signals in the protocol.
Remember that mere generation of the values by your indicator will have no effect until you explicitly allow their use in the appropriate sections of the Engine’s Settings/Inputs.
Look first. Then leap.
Trading


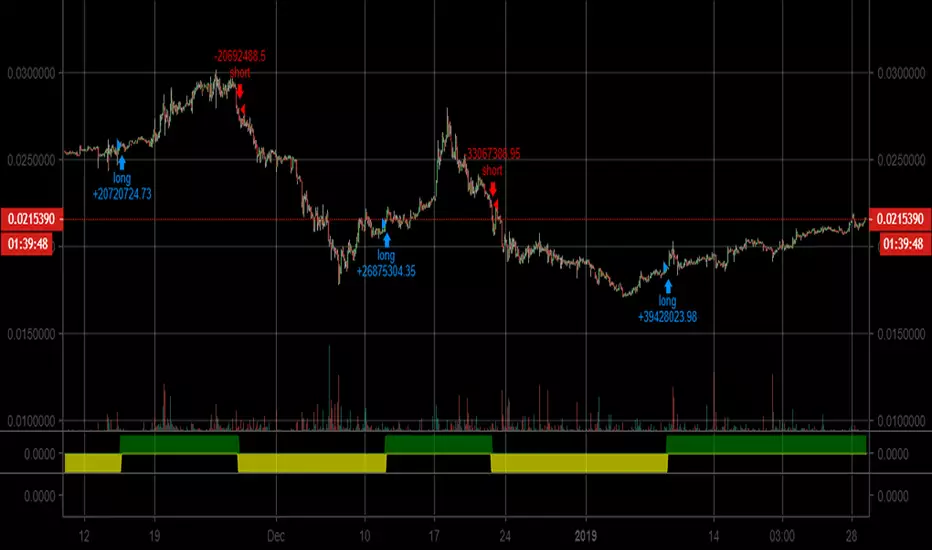
APEX - Swing Aura StrategyA backtester of my new strat, it's a hybrid swing/scalp strat that really looks for quick low profits. Will keep it hidden as it's a bit of a work in progress right now. Working on it to perform well enough with the Apex Trading bot, ran it for a day now and it ended the day on a 1.78% portfolio profit, so I'm really pleased with that.
As for details it's based on Keltner Channels, Bolingers Bands and a Ichimoku cloud. To spice it up there's even a Wave trend in there as well!
All the settings for the bits and parts are changeable so feel free to mess around with them, but will keep my sell triggers fixed for now, so no editing of those from within the script unfortunately.
Enjoy!


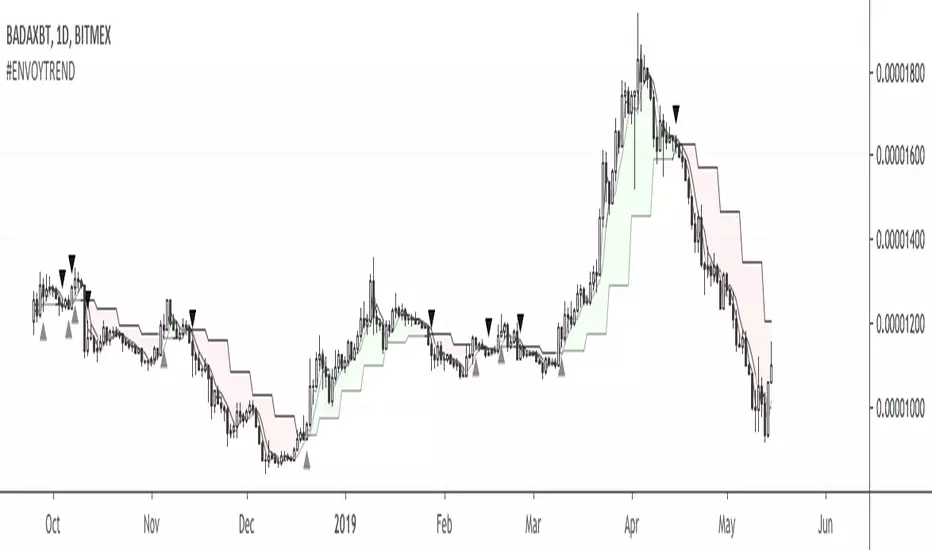
#ENVOYTREND#ENVOYTREND
Civilians don't like don't like simple strategies, but Envoys do.
With the collective #envoytrend trading strategy we ensure that no one is left behind when it comes to consistent profits. By working on the very same trades we bundle our efforts and help each other out. Maintaining an Envoy Account will give us reliable returns and teach us one of the most important lessons that we have to learn as a professional trader, which is consistency.
The indicator’s default settings show the trend cloud and the lines L, M and S with S crossing L being our main indication to enter a position. The general rule is that if S crosses over L we want to long as close to L as possible (if it shoots over by a lot we'd rather wait for a pullback to get in at a better price). If S crosses under L we want to short as close to L as possible (if it shoots under by a lot we'd rather wait for a pullback to get in at a better price). There are circumstances where we would want to take other lines into account like XL (which on some pairs can trump L), NEXT L (which is highly predictive but can give us a rough estimation where we might want to look for more aggressive, complimenting setups) or even M for very aggressive entries/exits on lower time frames. When price action goes utterly sideways so that we're getting back and forth signals we'd rather look for positions of strength within the narrow range. All our entries, exits, stops, take profits and additional plays in between are going to be discussed in the Envoy Academy, so no Envoy has to trade alone and can always ask for advise to get feedback on a position.
Enlist now.

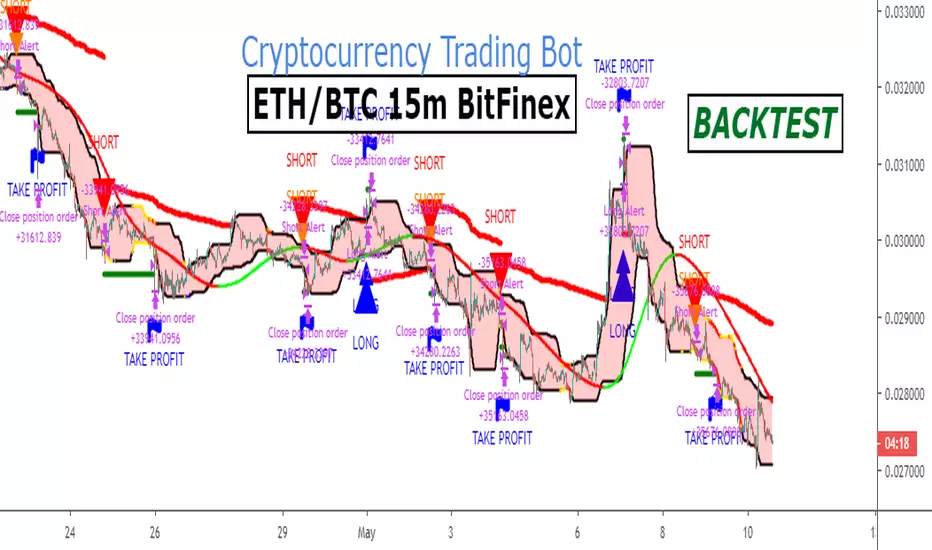
Ethereum FREE Backtest Version ETHBTC 15m BITFINEXA strategy for trading ETH/BTC in 15m timeframe.
The strategy includes long and short trades.
You can find the Alert Setup version below.
More info here .
-------------------------------------------------------------------------------
My website : blockchainfiesta.com
Automated Strategies for TradingView
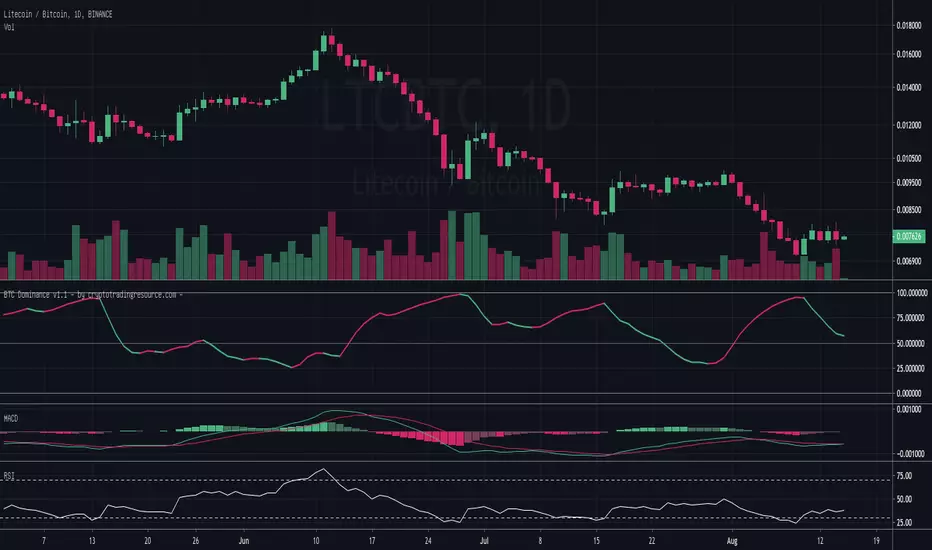
BTC Dominance - by @cryptomrdavis -Simple tool for your trading assets. Check the dominance from BTC agains other Alts and trade safe.
You can find a short description on the chart above.
Website coming soon: cryptotradingresource.com
Happy trading
+++ use this tool on your own risk. i'm not responsible for your loses. DYOR +++
____________________________________________________________________________
BTC: 1GVRDK3HHr9CKM5SF2CGpCNXFuavB3L4j9
ETH: 0x7b825fa752b9926D3E8397cDb1d9E5473D074646
XLM: GAXUQJSW55C7MAC4GI26NZUGIKSHFDVFRFKZCXPLMPY4HCADSDT55XK6
BCH: qz57n04ud6mn42u00aymqkku8tfh0lk4jv9c28mjvv
Advanced Candlestick Patterns [vitruvius]This is a very advanced indicator that detects most commonly used candlestick patterns. Please read this document carefully to understand how it works.
It is tailored to identify patterns that only have a great possibility of signaling a price movement. In other words, it can and will ignore some patterns, even though they satisfy the recognition conditions defined in the books. Candlestick patterns should also satisfy some other conditions in this indicator to be valid and you can modify those conditions.
This indicator is not only about identifying the candlestick patterns. By using the different choices, you can:
Avoid fake signals
Confirm patterns
Increase your possibility to win a trade
Reduce risk
Identify bullish/bearish movements better
Recommended Use
This indicator works best when you:
Use it in the daily time frame
Combine it with Support/Resistance areas
Note: For some candlestick patterns, you have the option of confirming the pattern with the next price action. In those cases, there will be obviously one bar delay (because it will wait for one more bar to close to confirm the pattern). However, it will mark the candlestick where it identifies the pattern and it will have ”Confirmed” in its text.
Important Note
This indicator does some serious calculations and checks for a lot of user inputs. Therefore, it might be a little slow. Please give it some time when it needs to do some computing.
MODULES
Trend Detection
Most of the patterns in this script are trend reversal patterns. So, recognition of the candlestick patterns depends heavily on the trend. In fact, even if you do not select a trend detection method, it will use the SMA method as default where it needs a certain trend in identifying a specific pattern.
It is possible to combine multiple trend detection methods. You can see how this affects the overall trend detection by enabling the background coloring.
Note: There might be some cases where a candle has a bullish/bearish confirmation of the same candlestick pattern . In those cases, the script is unable to identify the move and the user should decide if the identified pattern is bullish or bearish.
Below are the inputs of this module:
Color the background according to the trend?
If you select a trend detection method, it will color the background green for an uptrend and red for a downtrend .
Counter the trend when there is no obvious trend?
If you select multiple trend detection methods, there might be some cases where one of the methods indicates an uptrend and the other one indicates a downtrend . In that case, the script will continue with the previous trend (whatever the trend is one bar ago) by default . You can, however, reverse the trend in those cases by using this option. If you choose to reverse, you might catch the trend early .
Use MACD to detect the trend?
Use MACD to detect the trend. Whenever MACD delta is greater or equal to zero, it is an uptrend .
MACD Fast Length
Fast length of MACD.
MACD Slow Length
Slow length of MACD.
MACD Signal Smoothing
Signal smoothing value of MACD. Please note that it is set to 6 by default.
Use SMA to detect the trend?
Use SMA to detect the trend. If the price closes above the SMA line, it is an uptrend
SMA Length
Length of SMA.
Use the average price of previous candles to detect the trend?
If the average of open and close prices constantly go up for n bars that are determined by the next user input, it is an uptrend .
Number of candles to analyze
The number of bars ( n ) to analyze for the average price method.
Use the closing price of the previous candle to detect the trend?
If the difference between the current close and nth previous bar’s close is greater than the given threshold, it is an uptrend .
Position of the previous candle to analyze
Position of the bar (backward) to compare with the current close price.
Threshold for the closing price
The threshold value for closing price method.
Basic Candlestick Patterns
This module detects Doji, Spinning Top, Marubozu candlestick patterns. Also, you can set some specific options that are going to be used in all candlestick patterns.
Note: If you choose to manually enter the body height of a doji , you need to find the optimal value for different timeframes. Different timeframes have difference price action ranges.
Below are the inputs of this module:
Tolerate opening/closing price of the candle?
When a candlestick pattern needs to have a gap between two candles, you can tolerate the opening/closing prices of the one candle. This option is useful where the opening and closing prices are very close. This option is going to be used in all candlestick patterns.
Factor for tolerating opening/closing price
The more the factor is, the more the tolerance is.
Body/Height ratio for a candle to be considered as Bullish/Bearish
A bullish/bearish candle shouldn’t have too much shadow. You can use this option to determine the shadow length of a bullish/bearish bar. This option is going to be used in all candlestick patterns
Use basic candlestick pattern (Doji, Spinning Top, Marubozu)?
Detect doji, spinning top, marubozu candlestick patterns.
Manually set body of Doji?
You can manually set the body height of a doji. Otherwise, it will be calculated automatically. If you choose to use this option, then spinning top, and marubozu will also be calculated based on this.
Body of Doji
Body height of a bar to be considered as doji . Any bar with a body equal or less than the given value will be marked as doji. Only effective if you check the ”Manually set body of Doji?” option .
Verify a Doji by looking at the preceding candle?
If true, it will only mark dojis if the preceding candle is bullish or bearish.
Single Candlestick Patterns
This module detects Hammer, Hanging Man, Inverted Hammer, Shooting Star single candlestick patterns.
Below are the inputs of this module:
Confirm Single Candlestick Patterns with next closing price?
You can confirm a single candlestick pattern with the next closing price. That is, if the next candle closes above the previous one, it will confirm a bullish movement. If the next candle closes below the previous one, it will confirm a bearish movement.
Use Hammer and Hanging Man Single Candlestick Patterns?
Detect hammer and h anging man single candlestick patterns.
Use Inverted Hammer and Shooting Star Single Candlestick Patterns?
Detect inverted hammer and s hooting star single candlestick patterns.
Dual Candlestick Patterns
This module detects Engulfing, Tweezer Bottoms, Tweezer Tops, Harami, Inside Bar, Piercing Line, Dark Cloud Cover dual candlestick patterns.
Below are the inputs of this module:
Use Engulfing Dual Candlestick Pattern?
Detect engulfing dual candlestick pattern.
Validate Engulfing by comparing highs and lows?
If checked, the second bar must engulf the previous bar’s high/low also. If unchecked, the second bar should only engulf the real body of the first bar.
Use Tweezer Bottoms and Tops Dual Candlestick Patterns?
Detect tweezer bottoms and tweezer tops dual candlestick patterns.
Check the shadow equality of Tweezer Bottom and Tops?
Check if the shadows of the tweezer bars are about the same length.
Detect Harami Dual Candlestick Pattern?
Detect harami dual candlestick pattern.
Use High/Low of the second Harami candle instead of Open/Close price?
If checked, the body of the child must be within High and Low of the mother bar. Otherwise, only open/close prices will be checked.
Detect Inside Bar Dual Candlestick Pattern?
Detect inside bar dual candlestick pattern.
Treat Inside Bar as a reversal pattern?
If checked, inside bar will be treated as a bullish/bearish reversal pattern.
Check if the Inside bar formed in the upper/lower half of the Mother bar?
Check if the inside bar forms within the upper/lower body half of the mother. Then it will be treated as a bullish/bearish inside bar .
Detect the Inside Bar only if the previous candle closes outside of the Keltner channel?
This option effects identifying the inside bar . Such that, an inside bar will be detected only if the previous candle closes outside of Keltner Channel . Inside bars are effective when the market is extended and this is a nice way to check for that.
Confirm Inside Bar with the next close breaching the low/high of the inside bar?
Check if the next bar breaches inside bar’s high/low. Then it will be treated as a bullish/bearish inside bar .
Use Piercing Line and Dark Cloud Cover Dual Candlestick Patterns?
Detect Piercing Line and Dark Cloud Cover dual candlestick patterns.
Triple Candlestick Patterns
This module detects Morning Star , Evening Star, Three White Soldiers, Three Black Crows, Three Inside Up, Three Inside Down, Three Line Strike, Abandoned Baby, NR4, NR7 candlestick patterns.
Below are the inputs of this module:
Use Morning and Evening Star Triple Candlestick Pattern?
Detect morning and evening star triple candlestick patterns.
Don't allow the second candle's body to overlap with the first and third candle?
If checked, high and low of the second candle cannot overlap with the first and third candle for morning and evening star candlestick patterns.
The third candle must close beyond the midpoint of the first candle?
If checked, the third candle must close beyond the midpoint of the first candle for morning and evening star candlestick patterns.
Use Three White Soldiers and Three Black Crows Triple Candlestick Pattern?
Detect three white soldiers and three black crows triple candlestick pattern.
Compare bodies of Three White Soldiers and Three Black Crows candles?
You also have the possibility of comparing bodies of the candles in a way that every consecutive candle must have a bigger body than the previous candle.
Check if each candle (TWS&TBC) opens in the middle price range of the previous day?
You can check if each candle of three white soldiers and three black crows opens in the middle price range of the previous day.
Use Three Inside Up/Down Triple Candlestick Pattern?
Detect three inside up and three inside down triple candlestick pattern.
Check candles' bodies and closing prices for Three Inside Up/Down?
There are two different definitions for three inside up/down candlestick patterns. This option allows you to select one of those definitions. That is;
If unchecked , the second candle should make it up all the way to the midpoint of the first candle. Also, the third candle needs to close above the first candle’s high.
If checked , the second candle opens and closes within the real body of the first candle. Also, the third candle needs to close above the first candle's high.
Use Three Line Strike Candlestick Pattern?
Detect three line strike triple candlestick pattern.
Compare High/Lows instead of Open/Close for the Three Line Strike Pattern?
If checked, it will compare high/lows instead of open/close prices for the three line strike pattern.
Use Abandoned Baby Triple Candlestick Pattern?
Detect abandoned baby triple candlestick pattern. If you choose to tolerate opening and closing prices, high and low prices will also be tolerated for abandoned baby.
Use NR4 Candlestick Pattern?
Detect NR4 candlestick pattern.
Use NR7 Candlestick Pattern?
Detect NR7 candlestick pattern.
Confirm Narrow Range Candlestick Patterns with next closing price?
You can confirm NR4 and NR7 candlestick patterns with the next closing price. That way they will be identified as bullish or bearish patterns.
NOTES FROM THE AUTHOR
Please do not hesitate to contact me if you have any questions.
If you are not familiar with a specific candlestick pattern, try to google it. If you still need help, you can always contact me.
If you find a bug, or you think the indicator does not work as intended, please contact me with a screenshot of the chart. Also, please mention how you set up the user inputs.
If you have any ideas to further improve this indicator, please feel free to share it with me :)
LIKE , if you like it. SHARE if you think it would be useful for others too. FOLLOW for future updates and new indicators.

StdTrend (by JamieSteele)This strategy uses a multi-time-frame approach to trading.
The system trades in the direction of the long-term and intermediate term trend,
and enters trades on pullbacks counter to these trends.
The daily bars are colored based upon their intermediate term trend.
Red=Down Trend, Green=Up Trend.
For short-side trades, we look to capture small, consistent profits. This is necessary
given the extreme manipulation by governments' central banks in an effort to prop-up their
stock markets to give an appearance of an economy that is better than actually exists.
These governments look to limit all downside moves, so we capture small profits and then
re-short after the market resets.
For long-side trades the system stays in the trade until the trend is proven to be over.
Given the extreme valuations present in world markets today, extreme caution should be taken
on all trades, especially long-side trades. Use of derivatives are preferred (e.g. options,
which can be used to limit downside risk.) Naked put selling should be avoided, since huge
losses are possible selling naked puts in a market that is very overdue for a crash/large
price decline.)


Kenbunshoku Haki Mr.HokageCara menggunakannya Mudah Cukup Lihat garis Putih itu jika garis putih keluar dari BB dan posisi di atas maka Sell kalau di bawah Buy Cek gambar di atas

Turtles Modified AlertsAlerts for famous Turtle Trading Rules. Based on work from tmr0 and ossettia . It can be used with Autoview.
If you have any advice on how to further improve the script, please let me know by PM or comment below. Thanks!
Please hit on "Like" if you find this script useful so that others can find it easier. Thanks!
*** The information and script provided here are no recommendation to buy or sell. They are just an idea for educational and discussion purposes. ***

RSI + SMAx3Ceci est un script assez simple, un RSI comme celui qui est intégré mais avec la possibilité de tracer 3 droites de plus permettant ainsi de soulager certains chartiste qui pourrant régler la position de ces droites (horizontales) avec une parfaite précision.
S'ajoute à celà 3 moyennes mobiles arithmétique intégrées à l'indicateur RSI.
__________________________________________
This is a pretty simple script, with three lines to help relieve some chartists that make it possible to position these (horizontal) positions with perfect precision.
Add to this 3 arithmetic moving averages integrated in the RSI indicator.
__________________________________________
Este es un script bastante simple, un RSI como el que está integrado pero con la posibilidad de dibujar 3 líneas más, lo que permite liberar a algunos chartistas que pueden ajustar la posición de estas líneas (horizontal) con una precisión perfecta.
Agregue a esto 3 promedios móviles aritméticos integrados en el indicador RSI.
__________________________________________
Dies ist ein ziemlich einfaches Skript, ein RSI wie der, der integriert ist, aber mit der Möglichkeit, 3 weitere Linien zu zeichnen, wodurch einige Chartisten entlastet werden können, die die Position dieser Linien (horizontal) mit einer perfekten Genauigkeit einstellen können.
Hinzu kommen 3 in den RSI-Indikator integrierte arithmetische gleitende Durchschnitte.

ABV Scalper - Free Bitcoin Scalper IndicatorExcited to bring you this totally free to use indicator to be used as a scalper for Bitcoin!
You are required to use the following:
Use with Bitfinex charts
Use Heiken Ashi candles
Use the 30m timeframe
UTC time setting
This indicator does not take new entries on weekends given lower volatility in the market. However, if it enters a trade it will manage the position over the weekend for Stop Loss and Take Profit logic.
This indicator is setup to be fully automated!
If you love this indicator and the work we put behind it - please give it a like and share it with your network!

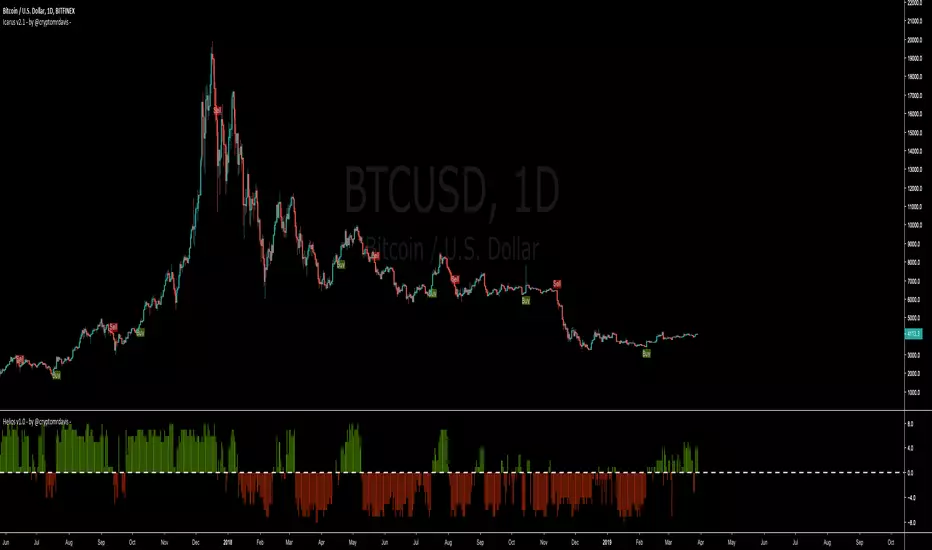
Icarus v2 - by @cryptomrdavis -This is the second version of this indicator. Now you have the ability to find the perfect settings for your asset. Just play around with those settings and if you find good ones, don't hesitate to share it with us.
Buy / Sell Signals will be plotted only once until the signal for open/close appears.
Reduce the noise with the ADX settings but there is still more room for better signals.
Catches most of the biggest moves quick but in the sideways they are still to much noise. Need to improve that. If you have some ideas just get at me.
Hope this tool is useful for you guys
Happy trading
+++ use this tool on your own risk. i'm not responsible for your loses. DYOR +++
____________________________________________________________________________
BTC: 1GVRDK3HHr9CKM5SF2CGpCNXFuavB3L4j9
ETH: 0x7b825fa752b9926D3E8397cDb1d9E5473D074646
XLM: GAXUQJSW55C7MAC4GI26NZUGIKSHFDVFRFKZCXPLMPY4HCADSDT55XK6
BCH: qz57n04ud6mn42u00aymqkku8tfh0lk4jv9c28mjvv
tippin.me
____________________________________________________________________________

zigzag%This is zigzag % , no repaint and no lag as it based on % changes
the main issue is the addition of take profit and stop loss together with trailing (thanks to Yatrader to his code)
set the zigzag% according to best fit of your graph for best results