Universal Trend+ [BackQuant]Universal Trend+
This indicator blends several well-known technical ideas into a single composite trend and momentum model. It can be show primarily as an overlay or a oscillator:
In which it produces two things:
a composite oscillator that summarizes multiple signals into one normalized score
a regime signal rendered on the chart as a colored ribbon with optional 𝕃 and 𝕊 markers
The goal is to simplify decision-making by having multiple, diverse measurements vote in a consistent framework, rather than relying on any single indicator in isolation.
What it does
Computes five independent components, each reading a different aspect of price behavior
Converts each component into a standardized bullish / neutral / bearish vote
Averages the available votes to a composite score
Compares that score to user thresholds to label the environment bullish, neutral, or bearish
Colors a fast/slow moving-average ribbon by the current regime, optionally paints candles, and can plot the composite oscillator in a lower pane
The five components (conceptual)
1)RSI Momentum Bias
A classic momentum gauge on a selectable source and lookback. The component emphasizes whether conditions are persistently strong or weak and applies a neutral buffer to avoid reacting to trivial moves. Output is expressed as a vote: bullish, neutral, or bearish.
2) Rate-of-Change Impulse
A smoothed rate-of-change that focuses on short bursts in acceleration. It is used to detect impulsive pushes rather than slow drift. Extreme readings cast a directional vote, mid-range readings abstain.
3) EMA Oscillator
A slope-style trend gauge formed by contrasting a fast and a slow EMA on a chosen source, normalized so that the sign and relative magnitude matter more than absolute price. A small dead-zone reduces whipsaws.
4) T3-Based Normalized Oscillator
A T3 smoother is transformed into a bounded oscillator via rolling normalization, then optionally smoothed by a user-selectable MA. This highlights directional drift while keeping scale consistent across symbols and regimes.
5) DEMA + ATR Bands State
A double-EMA core is wrapped in adaptive ATR bands to create a stepping state that reacts when pressure exceeds a volatility envelope. The component contributes an event-style vote on meaningful shifts.
Each component is designed to measure something different: trend slope, momentum impulse, normalized drift, and volatility-aware pressure. Their diversity is the point.
Composite scoring model
Standardization: Each component is mapped to -1 (bearish), 0 (neutral), or +1 (bullish) using bands and guards to cut noise.
Aggregation: The composite score is the average of the available votes. If a component is inactive on a bar, the composite uses the votes that are present.
Decision layer: Two user thresholds define your action bands.
Above the upper band → bullish regime
Below the lower band → bearish regime
Between the bands → neutral
This separation between measurement, aggregation, and decision avoids over-fitting any single threshold and makes the tool adaptable across assets and timeframes.
Plots and UI
Composite oscillator (optional lower pane): A normalized line that trends between bearish and bullish zones with user thresholds drawn for context.
Signal ribbon (on price): A fast/slow MA pair tinted by the current regime to give an at-a-glance market state.
Markers: Optional 𝕃 and 𝕊 labels when the regime flips.
Candle painting and background tint: Optional visual reinforcement of state.
Color and style controls: User inputs for long/short colors, threshold line color, and visibility toggles.
How it can be used
1) Regime filter
Use the composite regime to define bias. Trade only long in a bullish regime, only short in a bearish regime, and stand aside or scale down in neutral. This simple filter often reduces whipsaw.
2) Confirmation layer
Keep your entry method the same (breaks, pullbacks, liquidity sweeps, order-flow cues) but require agreement from the composite regime or a fresh flip in the 𝕃/𝕊 markers.
3) Momentum breakouts
Look for the composite oscillator to leave neutrality while the EMA oscillator is already positive and the ATR-band state has flipped. Confluence across components is the intent.
4) Pullback entries within trend
In a bullish regime, consider entries on shallow composite dips that recover before breaching the lower band. Reverse the logic in a bearish regime.
5) Exits and risk
Common choices are:
reduce on a return to neutral,
exit on an opposite regime flip, or
trail behind your own stop model (ATR, structure, session levels) while using the ribbon for context.
6) Multi-timeframe workflow
Select a higher timeframe for bias with this indicator, and time executions on a lower timeframe. The indicator itself stays on a single chart; you can load a second chart or pane if you prefer a strict top-down process.
Strengths
Diversified evidence: Five independent perspectives keep the model from hinging on one idea.
Noise control: Neutral buffers and a composite layer reduce reaction to minor wiggles.
Clarity: A single oscillator and a clearly colored ribbon present a complex assessment in a simple form.
Adaptable: Thresholds and lookbacks let you tune for faster or slower markets.
Practical tuning
Thresholds: Wider bands produce fewer regime flips and longer holds. Narrower bands increase sensitivity.
Lookbacks: Shorter lookbacks emphasize recent action; longer lookbacks emphasize stability.
T3 normalization window and volume factor: Increase the window to suppress noise on choppy symbols; tweak the factor to adjust the smoother’s response.
ATR factor for the band state: Raise it to demand more decisive pressure before registering a shift; lower it to respond earlier.
Alerts
Built-in alerts trigger when the regime flips long or short. If you prefer confirmed signals, set your alerts to bar close on your timeframe. Intrabar the composite can move with price; bar-close confirmation stabilizes behavior.
Limitations
Sideways markets: Even with buffers, any trend model can chop in range-bound conditions.
Lag vs sensitivity trade-off: Tighter thresholds react faster but flip more often; wider thresholds are steadier but later.
Asset specificity: Volatility regimes differ. Expect to retune ATR and normalization settings when switching symbols or timeframes.
Final Remarks
Universal Trend+ is meant to act like a disciplined voting committee. Each component contributes a different angle on the same underlying question: is the market pressing up, pressing down, or doing neither with conviction. By standardizing and aggregating those views, you get a single regime read that plays well with many entry styles and risk frameworks, while keeping the heavy math under the hood.
Trading

ATR% | Volatility NormalizerThis indicator measures true volatility by expressing the Average True Range (ATR) as a percentage of price. Unlike basic ATR plots, which show raw values, this version normalizes volatility to make it directly comparable across instruments and timeframes.
How it works:
Uses True Range (High–Low plus gaps) to capture actual market movement.
Normalizes by dividing ATR by the chosen price base (default: Close).
Multiplies by 100 to output a clean ATR% line.
Smoothing is flexible: choose from RMA, SMA, EMA, or WMA.
Optional Feature:
For comparison, you can toggle an auxiliary line showing the average absolute close-to-close % move, highlighting the difference between simplified and true volatility.
Why use it:
Track regime shifts: identify when volatility expands or contracts in % terms.
Compare volatility across different markets (equities, crypto, forex, commodities).
Integrate into risk management: position sizing, stop placement, or volatility filters for entries.
Interpretation:
Rising ATR% → expanding volatility, potential breakouts or unstable ranges.
Falling ATR% → contracting volatility, possible consolidation or range-bound conditions.
Sudden spikes → market “shocks” worth paying attention to.

Liquidity Swing Points [BackQuant]Liquidity Swing Points
This tool marks recent swing highs and swing lows and turns them into persistent horizontal “liquidity” levels. These are places where resting orders often accumulate, such as stop losses above prior highs and below prior lows. The script detects confirmed pivots, records their prices, draws lines and labels, and manages their lifecycle on the chart so you can monitor potential sweep or breakout zones without manual redrawing.
What it plots
LQ-H at confirmed swing highs
LQ-L at confirmed swing lows
Horizontal levels that can optionally extend into the future
Timed removal of old levels to keep the chart clean
Each level stores its price, the bar where it was created, its type (high or low), plus a label and a line reference for efficient updates.
How it works
Pivot detection
A swing high is confirmed when the highest high has swing_length bars on both sides that are lower.
A swing low is confirmed when the lowest low has swing_length bars on both sides that are higher.
Pivots are only marked after they are confirmed, so they do not repaint.
Level creation
When a pivot confirms, the script records the price and the creation bar (offset by the right lookback).
A new line is plotted at that price, labeled LQ-H or LQ-L.
Rendering and extension
Levels can be drawn to the most recent bar only or extended to the right for forward reference.
Label size and line color/transparency are configurable.
Lifecycle management
On each confirmed bar, the script checks level age.
Levels older than a chosen bar count are removed automatically to reduce clutter.
How it can be used
Liquidity sweeps: Watch for price to probe beyond a level then close back inside. That behavior often signals a potential fade back into the prior range.
Breakout validation: If price pushes through a level and holds on closes, traders may treat that as continuation. Retests of the level from the other side can serve as structure checks.
Context for entries and exits: Use nearby LQ-H or LQ-L as reference for stop placement or partial-take zones, especially when other tools agree.
Multi-timeframe mapping: Plot swing points on higher timeframes, then drill down to time entries on lower timeframes as price interacts with those levels.
Why liquidity levels matter
Prior swing points are focal areas where many strategies set stops or pending orders. Price often revisits these zones, either to “sweep” resting liquidity before reversing, or to absorb it and trend. Marking these areas objectively helps frame scenarios like failed breaks, successful breakouts, and retests, and it reduces the subjectivity of eyeballing structure.
Settings to know
Swing Detection Length (swing_length), Controls sensitivity. Lower values find more local swings. Higher values find more significant ones.
Bars until removal (removeafter), Deletes levels after a fixed number of bars to prevent buildup.
Extend Levels Right (extend_levels), Keeps levels projected into the future for easier planning.
Label Size (label_size), Choose tiny to large for chart readability.
One color input controls both high and low levels with transparency for context.
Strengths
Objective marking of recent structure without hand drawing
No repaint after confirmation since pivots are locked once the right lookback completes
Lightweight and fast with simple lifecycle management
Clear visuals that integrate well with any price-action workflow
Practical tips
For scalping: use smaller swing_length to capture more granular liquidity. Keep removeafter short to avoid clutter.
For swing trading: increase swing_length so only more meaningful levels remain. Consider extending levels to the right for planning.
Combine with time-of-day filters, ATR for stop sizing, or a separate trend filter to bias trades taken at the levels.
Keep screenshots focused: one image showing a sweep and reversal, another showing a clean breakout and retest.
Limitations and notes
Levels appear after confirmation, so they are delayed by swing_length bars. This is by design to avoid repainting.
On very noisy or illiquid symbols, you may see many nearby levels. Increasing swing_length and shortening removeafter helps.
The script does not assess volume or session context. Consider pairing with volume or session tools if that is part of your process.

Adaptive Valuation [BackQuant]Adaptive Valuation
What this is
A composite, zero-centered oscillator that standardizes several classic indicators and blends them into one “valuation” line. It computes RSI, CCI, Demarker, and the Price Zone Oscillator, converts each to a rolling z-score, then forms a weighted average. Optional smoothing, dynamic overbought and oversold bands, and an on-chart table make the inputs and the final score easy to inspect.
How it works
Components
• RSI with its own lookback.
• CCI with its own lookback.
• DM (Demarker) with its own lookback.
• PZO (Price Zone Oscillator) with its own lookback.
Standardization via z-score
Each component is transformed using a rolling z-score over lookback bars:
z = (value − mean) ÷ stdev , where the mean is an EMA and the stdev is rolling.
This puts all inputs on a comparable scale measured in standard deviations.
Weighted blend
The z-scores are combined with user weights w_rsi, w_cci, w_dm, w_pzo to produce a single valuation series. If desired, it is then smoothed with a selected moving average (SMA, EMA, WMA, HMA, RMA, DEMA, TEMA, LINREG, ALMA, T3). ALMA’s sigma input shapes its curve.
Dynamic thresholds (optional)
Two ways to set overbought and oversold:
• Static : fixed levels at ob_thres and os_thres .
• Dynamic : ±k·σ bands, where σ is the rolling standard deviation of the valuation over dynLen .
Bands can be centered at zero or around the valuation’s rolling mean ( centerZero ).
Visualization and UI
• Zero line at 0 with gradient fill that darkens as the valuation moves away from 0.
• Optional plotting of band lines and background highlights when OB or OS is active.
• Optional candle and background coloring driven by the valuation.
• Summary table showing each component’s current z-score, the final score, and a compact status.
How it can be used
• Bias filter : treat crosses above 0 as bullish bias and below 0 as bearish bias.
• Mean-reversion context : look for exhaustion when the valuation enters the OB or OS region, then watch for exits from those regions or a return toward 0.
• Signal confirmation : use the final score to confirm setups from structure or price action.
• Adaptive banding : with dynamic thresholds, OB and OS adjust to prevailing variability rather than relying on fixed lines.
• Component tuning : change weights to emphasize trend (raise DM, reduce RSI/CCI) or range behavior (raise RSI/CCI, reduce DM). PZO can help in swing environments.
Why z-score blending helps
Indicators often live on different scales. Z-scoring places them on a common, unitless axis, so a one-sigma move in RSI has comparable influence to a one-sigma move in CCI. This reduces scale bias and allows transparent weighting. It also facilitates regime-aware thresholds because the dynamic bands scale with recent dispersion.
Inputs to know
• Component lookbacks : rsilb, ccilb, dmlb, pzolb control each raw signal.
• Standardization window : lookback sets the z-score memory. Longer smooths, shorter reacts.
• Weights : w_rsi, w_cci, w_dm, w_pzo determine each component’s influence.
• Smoothing : maType, smoothP, sig govern optional post-blend smoothing.
• Dynamic bands : dyn_thres, dynLen, thres_k, centerZero configure the adaptive OB/OS logic.
• UI : toggle the plot, table, candle coloring, and threshold lines.
Reading the plot
• Above 0 : composite pressure is positive.
• Below 0 : composite pressure is negative.
• OB region : valuation above the chosen OB line. Risk of mean reversion rises and momentum continuation needs evidence.
• OS region : mirror logic on the downside.
• Band exits : leaving OB or OS can serve as a normalization cue.
Strengths
• Normalizes heterogeneous signals into one interpretable series.
• Adjustable component weights to match instrument behavior.
• Dynamic thresholds adapt to changing volatility and drift.
• Transparent diagnostics from the on-chart table.
• Flexible smoothing choices, including ALMA and T3.
Limitations and cautions
• Z-scores assume a reasonably stationary window. Sharp regime shifts can make recent bands unrepresentative.
• Highly correlated components can overweight the same effect. Consider adjusting weights to avoid double counting.
• More smoothing adds lag. Less smoothing adds noise.
• Dynamic bands recalibrate with dynLen ; if set too short, bands may swing excessively. If too long, bands can be slow to adapt.
Practical tuning tips
• Trending symbols: increase w_dm , use a modest smoother like EMA or T3, and use centerZero dynamic bands.
• Choppy symbols: increase w_rsi and w_cci , consider ALMA with a higher sigma , and widen bands with a larger thres_k .
• Multiday swing charts: lengthen lookback and dynLen to stabilize the scale.
• Lower timeframes: shorten component lookbacks slightly and reduce smoothing to keep signals timely.
Alerts
• Enter and exit of Overbought and Oversold, based on the active band choice.
• Bullish and bearish zero crosses.
Use alerts as prompts to review context rather than as stand-alone trade commands.
Final Remarks
We created this to show people a different way of making indicators & trading.
You can process normal indicators in multiple ways to enhance or change the signal, especially with this you can utilise machine learning to optimise the weights, then trade accordingly.
All of the different components were selected to give some sort of signal, its made out of simple components yet is effective. As long as the user calibrates it to their Trading/ investing style you can find good results. Do not use anything standalone, ensure you are backtesting and creating a proper system.

Signalgo Strategy ISignalgo Strategy I: Technical Overview
Signalgo Strategy I is a systematically engineered TradingView strategy script designed to automate, test, and manage trend-following trades using multi-timeframe price/volume logic, volatility-based targets, and multi-layered exit management. This summary covers its operational structure, user inputs, entry and exit methodology, unique technical features, and practical application.
Core Logic and Workflow
Multi-Timeframe Data Synthesis
User-Defined Timeframe: The user chooses a timeframe (e.g., 1H, 4H, 1D, etc.), on which all strategy signals are based.
Cross-Timeframe Inputs: The strategy imports closing price, volume, and Average True Range (ATR) for the selected interval, independently from the chart’s native timeframe, enabling robust multi-timeframe analysis.
Price Change & Volume Ratio: It calculates the percent change of price per bar and computes a volume ratio by comparing current volume to its 20-bar moving average—enabling detection of true “event” moves vs. normal market noise.
Hype Filtering
Anti-Hype Mechanism: An entry is automatically filtered out if abnormal high volume occurs without corresponding price movement, commonly observed during manipulation or announcement periods. This helps isolate genuine market-driven momentum.
User Inputs
Select Timeframe: Choose which interval drives signal generation.
Backtest Start Date: Specify from which date historical signals are included in the strategy (for precise backtests).
Take-Profit/Stop-Loss Configuration: Internally, risk levels are set as multiples of ATR and allow for three discrete profit targets.
Entry Logic
Trade Signal Criteria:
Price change magnitude in the current bar must exceed a fixed sensitivity threshold.
Volume for the bar must be significantly elevated compared to average, indicating meaningful participation.
Anti-hype check must not be triggered.
Bullish/Bearish Determination: If all conditions are met and price change direction is positive, a long signal triggers. If negative, a short signal triggers.
Signal Debouncing: Ensures a signal triggers only when a new condition emerges, avoiding duplicate entries on flat or choppy bars.
State Management: The script tracks whether an active long or short is open to avoid overlapping entries and to facilitate clean reversals.
Exit Strategy
Take-Profits: Three distinct profit targets (TP1, TP2, TP3) are calculated as fixed multiples of the ATR-based stop loss, adapting dynamically to volatility.
Reversals: If a buy signal appears while a short is open (or vice versa), the existing trade is closed and reversed in a single step.
Time-Based Exit: If, 49 bars after entry, the trade is in-profit but hasn’t reached TP1, it exits to avoid stagnation risk.
Adverse Move Exit: The position is force-closed if it suffers a 10% reversal from entry, acting as a catastrophic stop.
Visual Feedback: Each TP/SL/exit is plotted as a clear, color-coded line on the chart; no hidden logic is used.
Alerts: Built-in TradingView alert conditions allow automated notification for both entries and strategic exits.
Distinguishing Features vs. Traditional MA Strategies
Event-Based, Not Just Slope-Based: While classic moving average strategies enter trades on MA crossovers or slope changes, Signalgo Strategy I demands high-magnitude price and volume confirmation on the chosen timeframe.
Volume Filtering: Very few MA strategies independently filter for meaningful volume spikes.
Real Market Event Focus: The anti-hype filter differentiates organic market trends from manipulated “high-volume, no-move” sessions.
Three-Layer Exit Logic: Instead of a single trailing stop or fixed RR, this script manages three profit targets, time-based closures, and hard adverse thresholds.
Multi-Timeframe, Not Chart-Dependent: The “main” analytical interval can be set independently from the current chart, allowing for in-depth cross-timeframe backtests and system runs.
Reversal Handling: Automatic handling of signal reversals closes and flips positions precisely, reducing slippage and manual error.
Persistent State Tracking: Maintains variables tracking entry price, trade status, and target/stop levels independently of chart context.
Trading Application
Strategy Sandbox: Designed for robust backtesting, allowing users to simulate performance across historical data for any major asset or interval.
Active Risk Management: Trades are consistently managed for both fixed interval “stall” and significant loss, not just via trailing stops or fixed-day closes.
Alert Driven: Can power algorithmic trading bots or notify discretionary traders the moment a qualifying market event occurs.

Volumetric Support and Resistance [BackQuant]Volumetric Support and Resistance
What this is
This Overlay locates price levels where both structure and participation have been meaningful. It combines classical swing points with a volume filter, then manages those levels on the chart as price evolves. Each level carries:
• A reference price (support or resistance)
• An estimate of the volume that traded around that price
• A touch counter that updates when price retests it
• A visual box whose thickness is scaled by volatility
The result is a concise map of candidate support and resistance that is informed by both price location and how much trading occurred there.
How levels are built
Find structural pivots uses ta.pivothigh and ta.pivotlow with a user set sensitivity. Larger sensitivity looks for broader swings. Smaller sensitivity captures tighter turns.
Require meaningful volume computes an average volume over a lookback period and forms a volume ratio for the current bar. A pivot only becomes a level when the ratio is at least the volume significance multiplier.
Avoid clustering checks a minimum level distance (as a percent of price). If a candidate is too close to an existing level, it is skipped to keep the map readable.
Attach a volume strength to the level estimates volume strength by averaging the volume of recent bars whose high to low range spans that price. Levels with unusually high strength are flagged as high volume.
Store and draw levels are kept in an array with fields for price, type, volume, touches, creation bar, and a box handle. On the last bar, each level is drawn as a horizontal box centered at the price with a vertical thickness scaled by ATR. Borders are thicker when the level is marked high volume. Boxes can extend into the future.
How levels evolve over time
• Aging and pruning : levels are removed if they are too old relative to the lookback or if you exceed the maximum active levels.
• Break detection : a level can be removed when price closes through it by more than a break threshold set as a fraction of ATR. Toggle with Remove Broken Levels.
• Touches : when price approaches within the break threshold, the level’s touch counter increments.
Visual encoding
• Boxes : support boxes are green, resistance boxes are red. Box height uses an ATR based thickness so tolerance scales with volatility. Transparency is fixed in this version. Borders are thicker on high volume levels.
• Volume annotation : show the estimated volume inside the box or as a label at the right. If a level has more than one touch, a suffix like “(2x)” is appended.
• Extension : boxes can extend a fixed number of bars into the future and can be set to extend right.
• High volume bar tint : bars with volume above average × multiplier are tinted green if up and red if down.
Inputs at a glance
Core Settings
• Level Detection Sensitivity — pivot window for swing detection
• Volume Significance Multiplier — minimum volume ratio to accept a pivot
• Lookback Period — window for average volume and maintenance rules
Level Management
• Maximum Active Levels — cap on concurrently drawn levels
• Minimum Level Distance (%) — required spacing between level prices
Visual Settings
• Remove Broken Levels — drop a level once price closes decisively through it
• Show Volume Information on Levels — annotate volume and touches
• Extend Levels to Right — carry boxes forward
Enhanced Visual Settings
• Show Volume Text Inside Box — text placement option
• Volume Based Transparency and Volume Based Border Thickness — helper logic provided; current draw block fixes transparency and increases border width on high volume levels
Colors
• Separate colors for support, resistance, and their high volume variants
How it can be used
• Trade planning : use the most recent support and resistance as reference zones for entries, profit taking, or stop placement. ATR scaled thickness provides a practical buffer.
• Context for patterns : combine with breakouts, pullbacks, or candle patterns. A breakout through a high volume resistance carries more informational weight than one through a thin level.
• Prioritization : when multiple levels are nearby, prefer high volume or higher touch counts.
• Regime adaptation : widen sensitivity and increase minimum distance in fast regimes to avoid clutter. Tighten them in calm regimes to capture more granularity.
Why volume support and resistance is used in trading
Support and resistance relate to willingness to transact at certain prices. Volume measures participation. When many contracts change hands near a price:
• More market players hold inventory there, often creating responsive behavior on retests
• Order flow can concentrate again to defend or to exit
• Breaks can be cleaner as trapped inventory rebalances
Conditioning level detection on above average activity focuses attention on prices that mattered to more participants.
Alerts
• New Support Level Created
• New Resistance Level Created
• Level Touch Alert
• Level Break Alert
Strengths
• Dual filter of structure and participation, reducing trivial swing points
• Self cleaning map that retires old or invalid levels
• Volatility aware presentation using ATR based thickness
• Touch counting for persistence assessment
• Tunable inputs for instrument and timeframe
Limitations and caveats
• Volume strength is an approximation based on bars spanning the price, not true per price volume
• Pivots confirm after the sensitivity window completes, so new levels appear with a delay
• Narrow ranges can still cluster levels unless minimum distance is increased
• Large gaps may jump past levels and immediately trigger break conditions
Practical tuning guide
• If the chart is crowded: increase sensitivity, increase minimum level distance, or reduce maximum active levels
• If useful levels are missed: reduce volume multiplier or sensitivity
• If you want stricter break removal: increase the ATR based break threshold in code
• For instruments with session patterns: tailor the lookback period to a representative window
Interpreting touches and breaks
• First touch after creation is a validation test
• Multiple shallow touches suggest absorption; a later break may then travel farther
• Breaks on high current volume merit extra attention
Multi timeframe usage
Levels are computed on the active chart timeframe. A common workflow is to keep a higher timeframe instance for structure and a lower timeframe instance for execution. Align trades with higher timeframe levels where possible.
Final Thoughts
This indicator builds a lightweight, self updating map of support and resistance grounded in swings and participation. It is not a full market profile, but it captures much of the practical benefit with modest complexity. Treat levels as context and decision zones, not guarantees. Combine with your entry logic and risk controls.

DM Impulse Enhanced [BackQuant]DM Impulse Enhanced
What this is (and what it isn’t)
DM Impulse Enhanced is a signal-driven overlay that classifies market action into two practical regimes: Long (risk-on) and Cash (risk-off). It’s built around a proprietary impulse model from the directional-movement family, wrapped in a persistence test and a state machine. Because this script is private, the core mechanics are intentionally abstracted here; what follows explains how to read and use it without revealing the protected calculation.
Why traders use it
Many tools oscillate or describe “how stretched” price is; fewer make a firm, operational call that you can automate. DM Impulse Enhanced aims to do exactly that declare when upside pressure is broad and durable enough to justify a long bias, and when deterioration is strong enough to stand aside (cash/short discretion). The emphasis is on impulse persistence rather than one-off spikes.
What you see on the chart
• Long / Cash markers – Green up-triangles (Long) and red down-triangles (Cash) plot at the bar where the regime changes.
• Regime-tinted bars (optional) – Candles can be softly shaded green during Long and red during Cash for at-a-glance context.
• Trend ribbon (context only) – A narrow ribbon (fast/slow moving averages) is tinted by the current regime to show trend alignment; it does not generate signals on its own.
• No separate sub-pane – Signals are intended to sit directly on price for immediate decision-making.
How the logic behaves (high-level)
Impulse core – A directional-movement–based engine estimates the strength of buying vs. selling pressure over a user-defined horizon.
Persistence gate – Instead of reacting to a single reading, the model evaluates how consistently that impulse dominates across a configurable lookback range.
State machine – When persistence clears (or fails) a pair of thresholds, the model flips and stays in that regime until evidence justifies a change. This “stickiness” is intentional; it reduces whipsaws in choppy tape.
Inputs & controls
Calculation Settings
• DM Length – The base horizon for the impulse engine. Longer = smoother/steadier; shorter = quicker/more reactive.
• Start / End – Defines the span of the persistence check. Expanding the span asks the market to prove itself against more history before changing regime.
Signal Settings
• Long Threshold – The persistence level required to promote the model into Long.
• Short Threshold – The level that, once crossed to the downside, demotes the model into Cash. Using a cross-under event for risk-off helps avoid premature exits on noise.
Visual Settings
• Long / Short colours – Customize marker and shading hues.
• Color Bars? – Toggle candle tinting by regime (off if you prefer a clean chart).
Reading the signals
• Long prints only when the model observes sustained upside pressure across the configured span. Treat this as permission to engage with pullbacks, breakouts, or your preferred setups in the direction of the trend.
• Cash prints when downside deterioration is strong enough to invalidate the prior regime. It’s a risk-off directive—flatten, hedge, or switch to short strategies according to your plan.
• Regime persistence is a feature: once Long, the model won’t flip on minor dips; once Cash, it won’t re-arm on minor bounces. If you want more flips, shorten the spans and relax thresholds; if you want fewer, do the opposite.
Practical tuning guide
Match DM Length to your timeframe
– Intraday: smaller length for timely response.
– Swing/Position: larger length to filter desk-noise and track higher-timeframe flows.
Size the persistence span to your goal
– Narrow span: faster regime changes, more trades, more noise.
– Wide span: fewer, higher-conviction calls, longer holds.
Set realistic thresholds
– The Long threshold should be reachable with your chosen span; the Short threshold should be low enough to catch genuine deterioration but not so tight that it flips on every dip.
Decide on cosmetics
– Turn on bar tinting for discretionary reading, or keep it off when exporting screenshots or running other overlays.
Suggested workflows
• Trend-following with discipline – Trade only in the Long regime; use structure (higher lows, anchored VWAP, or pullbacks to your MA stack) for entries and the Cash flip as a portfolio-level exit.
• Risk overlay – Keep your normal strategy, but: reduce size when Cash appears; re-enable full risk only after Long reasserts.
• Multi-timeframe gating – Require Long on a higher timeframe (e.g., 4H or 1D), then take entries on a lower one. If the high-TF posts Cash, stand down.
How the ribbon fits in
The ribbon visualizes short- vs. intermediate-term trend in the same colour as the regime. It’s deliberately “dumb”: it does not change the signal, it just helps you see when price action and regime are in harmony (e.g., pullbacks during Long that hold above the ribbon).
Alerts included
• DM Impulse LONG – Triggers as the persistence measure clears the Long threshold.
• DM Impulse CASH – Triggers when deterioration crosses the Short threshold from above.
Configure alerts to fire on bar close if you want final (non-intrabar) decisions.
Strengths
• Actionable binary output – Long/Cash is unambiguous and easy to automate.
• Persistence-aware – Focuses on runs that endure, not one-bar excitement.
• Asset/timeframe agnostic – Works anywhere you trust directional-movement concepts (equities, futures, crypto, FX).
Limitations & cautions
• Not a reversal caller – It’s a regime classifier. If you need early bottoms/tops, pair it with your own exhaustion or liquidity tools.
• Parameter feasibility matters – If your thresholds are set beyond what your span can reasonably achieve, signals may rarely (or never) trigger.
• Chop happens – In mean-reverting or news-driven tape, expect more frequent flips unless you widen spans and thresholds.
• Intrabar movement – Like any responsive model, provisional intrabar states can appear before the bar closes. Use “bar close” alerts for finality.
Getting started (safe defaults you can adapt)
• Intraday bias – Shorter DM Length, modest span, moderately tight thresholds.
• Swing filter – Longer DM Length, wider span, stricter Long and sufficiently low Short.
• Conservative overlay – Keep thresholds firm and spans wide; use signals to scale risk rather than flip directions frequently.
Summary
DM Impulse Enhanced is a persistence-focused regime classifier built on directional-movement concepts. It answers a narrow question clearly “Risk-on or risk-off?” and stays with that answer until the evidence meaningfully changes. Use it as a bias switch, a portfolio risk overlay, or a gate for your existing entry logic, and size its spans/thresholds to the cadence of the market you trade.

EMA Oscillator [Alpha Extract]A precision mean reversion analysis tool that combines advanced Z-score methodology with dual threshold systems to identify extreme price deviations from trend equilibrium. Utilizing sophisticated statistical normalization and adaptive percentage-based thresholds, this indicator provides high-probability reversal signals based on standard deviation analysis and dynamic range calculations with institutional-grade accuracy for systematic counter-trend trading opportunities.
🔶 Advanced Statistical Normalization
Calculates normalized distance between price and exponential moving average using rolling standard deviation methodology for consistent interpretation across timeframes. The system applies Z-score transformation to quantify price displacement significance, ensuring statistical validity regardless of market volatility conditions.
// Core EMA and Oscillator Calculation
ema_values = ta.ema(close, ema_period)
oscillator_values = close - ema_values
rolling_std = ta.stdev(oscillator_values, ema_period)
z_score = oscillator_values / rolling_std
🔶 Dual Threshold System
Implements both statistical significance thresholds (±1σ, ±2σ, ±3σ) and percentage-based dynamic thresholds calculated from recent oscillator range extremes. This hybrid approach ensures consistent probability-based signals while adapting to varying market volatility regimes and maintaining signal relevance during structural market changes.
// Statistical Thresholds
mild_threshold = 1.0 // ±1σ (68% confidence)
moderate_threshold = 2.0 // ±2σ (95% confidence)
extreme_threshold = 3.0 // ±3σ (99.7% confidence)
// Percentage-Based Dynamic Thresholds
osc_high = ta.highest(math.abs(z_score), lookback_period)
mild_pct_thresh = osc_high * (mild_pct / 100.0)
moderate_pct_thresh = osc_high * (moderate_pct / 100.0)
extreme_pct_thresh = osc_high * (extreme_pct / 100.0)
🔶 Signal Generation Framework
Triggers buy/sell alerts when Z-score crosses extreme threshold boundaries, indicating statistically significant price deviations with high mean reversion probability. The system generates continuation signals at moderate levels and reversal signals at extreme boundaries with comprehensive alert integration.
// Extreme Signal Detection
sell_signal = ta.crossover(z_score, selected_extreme)
buy_signal = ta.crossunder(z_score, -selected_extreme)
// Dynamic Color Coding
signal_color = z_score >= selected_extreme ? #ff0303 : // Extremely Overbought
z_score >= selected_moderate ? #ff6a6a : // Overbought
z_score >= selected_mild ? #b86456 : // Mildly Overbought
z_score > -selected_mild ? #a1a1a1 : // Neutral
z_score > -selected_moderate ? #01b844 : // Mildly Oversold
z_score > -selected_extreme ? #00ff66 : // Oversold
#00ff66 // Extremely Oversold
🔶 Visual Structure Analysis
Provides a six-tier color gradient system with dynamic background zones indicating mild, moderate, and extreme conditions. The histogram visualization displays Z-score intensity with threshold reference lines and zero-line equilibrium context for precise mean reversion timing.
snapshot
4H
1D
🔶 Adaptive Threshold Selection
Features intelligent threshold switching between statistical significance levels and percentage-based dynamic ranges. The percentage system automatically adjusts to current volatility conditions using configurable lookback periods, while statistical thresholds maintain consistent probability-based signal generation across market cycles.
🔶 Performance Optimization
Utilizes efficient rolling calculations with configurable EMA periods and threshold parameters for optimal performance across all timeframes. The system includes comprehensive alert functionality with customizable notification preferences and visual signal overlay options.
🔶 Market Oscillator Interpretation
Z-score > +3σ indicates statistically significant overbought conditions with high reversal probability, while Z-score < -3σ signals extreme oversold levels suitable for counter-trend entries. Moderate thresholds (±2σ) capture 95% of normal price distributions, making breaches statistically significant for systematic trading approaches.
snapshot
🔶 Intelligent Signal Management
Automatic signal filtering prevents false alerts through extreme threshold crossover requirements, while maintaining sensitivity to genuine statistical deviations. The dual threshold system provides both conservative statistical approaches and adaptive market condition responses for varying trading styles.
Why Choose EMA Oscillator ?
This indicator provides traders with statistically-grounded mean reversion analysis through sophisticated Z-score normalization methodology. By combining traditional statistical significance thresholds with adaptive percentage-based extremes, it maintains effectiveness across varying market conditions while delivering high-probability reversal signals based on quantifiable price displacement from trend equilibrium, enabling systematic counter-trend trading approaches with defined statistical confidence levels and comprehensive risk management parameters.

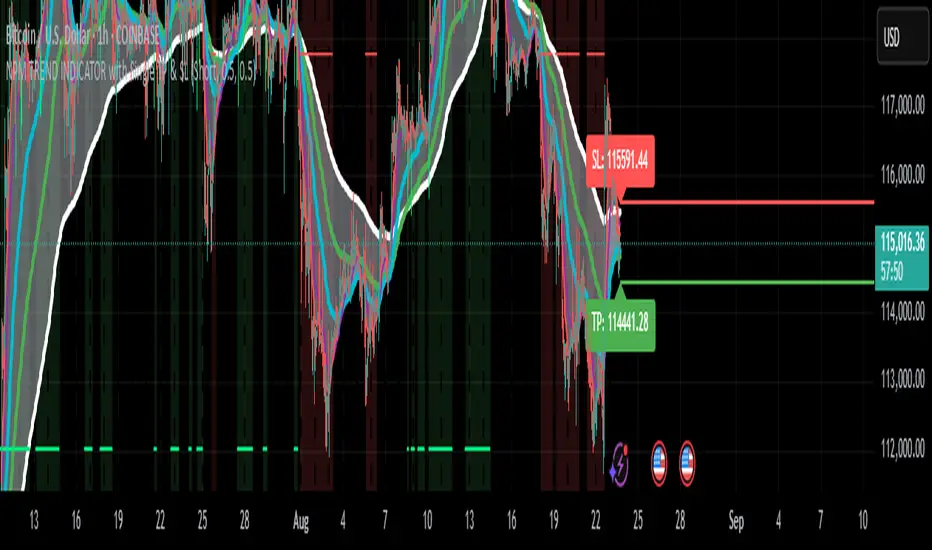
NPM Trend Indicator ProNPM Trend Indicator Pro
The NPM Trend Indicator Pro is a closed-source, professional-grade trend detection tool designed to help traders identify high-probability directional moves in the market. It combines multiple technical factors to generate clear, actionable trend signals while filtering out noise and reducing false entries.
What it does
Displays trend direction (uptrend, downtrend, or neutral) for the selected symbol.
Shows a confidence or strength score to indicate how reliable the trend signal is.
Highlights potential areas of market exhaustion or reversal based on aggregated trend analysis.
Provides visual cues on the chart to assist with trade timing and risk management.
How it works (concept-level)
Integrates multiple trend-detection methods, including moving average structures, momentum confirmation, and volatility assessment.
Uses adaptive filters to avoid false signals during sideways or choppy market conditions.
Includes zone awareness to help traders avoid entering trades too close to likely reaction points.
Aggregates all signals into a single output to give traders a concise, actionable overview.
How to use it
1. Apply the indicator to your chosen symbol.
2. Observe the trend direction and confidence score displayed on the chart.
3. Confirm that the trend aligns with your trading strategy and timeframe.
4. Use the visual cues for potential entry, exit, and risk management decisions.
Alerts
Optionally set alerts when trend direction changes or when the confidence score reaches a user-defined threshold.
Notes
Suitable for multiple markets, including forex, indices, crypto, and equities.
Can be used for intraday scalping, swing trading, or longer-term trend analysis depending on the trader’s selected timeframe.
⚠️ Disclaimer: This script is for educational purposes only and is not financial advice. Trading involves risk, and you can lose money. Always test strategies on a demo account and use proper risk management.
NPM Trend Dashboard NPM Trend Dashboard
The NPM Trend Dashboard is a closed-source tool designed to help traders quickly assess market conditions and make informed decisions. It combines trend detection, momentum, and volatility awareness into a clear interface, showing the current trend direction and strength for selected symbols.
What it does
Displays trend direction (uptrend, downtrend, or neutral) for each selected symbol.
Shows a confidence score or strength indicator to help gauge reliability.
Highlights potential areas of market exhaustion or reversal based on aggregated trend signals.
How it works (concept-level)
Combines multiple trend-detection methods such as moving average structure, momentum filters, and volatility assessment to generate an overall trend signal.
Uses adaptive filters to reduce noise and avoid false signals in choppy markets.
Incorporates zone awareness to account for areas where price may pause or reverse.
Aggregates signals into a single dashboard view to provide traders with a quick, actionable overview.
How to use it
1. Select symbols to monitor.
2. Switch to your desired timeframe to view trend information.
3. Observe trend direction and confidence score for each symbol.
4. Use the dashboard to supplement trade entries, exits, and risk management strategies.
Alerts
Optionally set alerts when trend direction changes or when confidence exceeds a user-defined threshold.
Notes
Suitable for multiple markets, including forex, indices, crypto, and equities.
Can be used for intraday scalping, swing trading, or longer-term trend analysis depending on the selected timeframe.
⚠️ Disclaimer: This script is for educational purposes only and is not financial advice. Trading involves risk, and you can lose money. Always test strategies on a demo account and practice proper risk management.

NPM Market PredictionMarket Prediction Indicator
The Market Prediction Indicator Script is a custom-built tool designed to give traders a clearer view of market direction and probability. It combines several technical concepts into one framework to help filter out noise, highlight potential opportunities, and improve trade timing.
What it does
Identifies whether the market is more likely trending or ranging.
Generates trade signals only when multiple factors align.
Assigns a confidence score to each signal for added clarity.
Plots guides for stop and target placement that adapt to market conditions.
Filters signals around potential reversal areas to reduce false entries.
What you see
Long/short markers when conditions align.
Confidence score labels for signals.
Adaptive stop/target guides.
Highlighted zones showing potential areas of reaction.
How to use it
1. Observe whether the indicator shows a trending or ranging environment.
2. Take signals when all conditions align and the confidence score meets your threshold.
3. Use the adaptive stop and target guides for risk management.
4. Optionally add higher timeframe confirmation for extra filtering.
Alerts
Long signal confirmed
Short signal confirmed
Target reached
Stop guide breached
Notes
This tool is designed for use across multiple markets and timeframes, from intraday setups to swing trading.
⚠️ Disclaimer: This script is for educational purposes only and not financial advice. Trading involves risk, and you can lose money. Always test on demo and manage risk carefully.

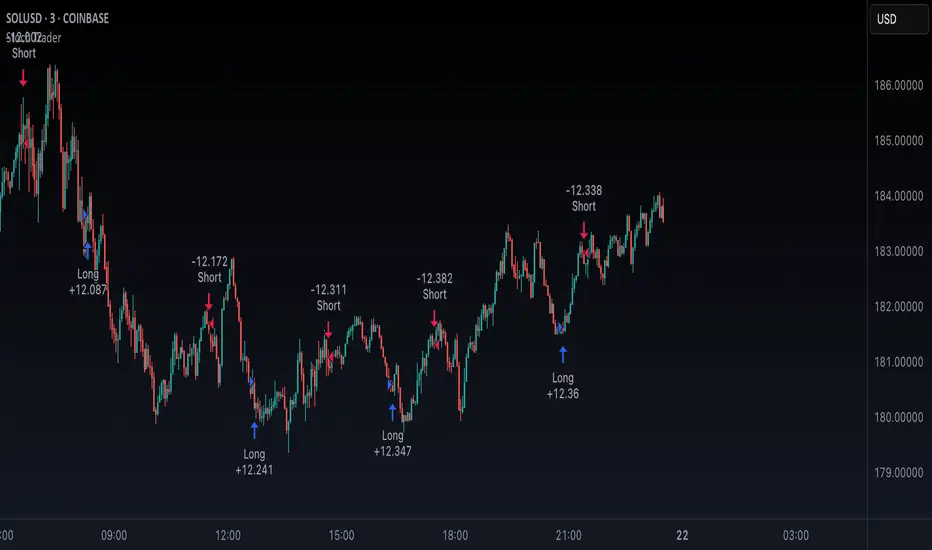
Stoch TraderSimple example strategy that has greater than 60% win rate on 1m, 3m, and 5m views. Using something as simple as this with leverage can produce decent returns within 15-30min. It's also very easy to lose money doing this.
Kio IQ [TradingIQ]Introducing: “Kio IQ ”
Kio IQ is an all-in-one trading indicator that brings momentum, trend strength, multi-timeframe analysis, trend divergences, pullbacks, early trend shift signals, and trend exhaustion signals together in one clear view.
🔶 The Philosophy of Kio IQ
Markets move in trends—and capturing them reliably is the key to consistency in trading. Without a tool to see the bigger picture, it’s easy to mistake a pullback for a breakout, a fakeout for the real deal, or random market noise as a meaningful price move.
Kio IQ cuts through that random market noise—scanning multiple timeframes, analyzing short, medium, and long-term momentum, and telling you on the spot whether a move is strong, weak, a trap, or simply a small move within a larger trend.
With Kio IQ, price action reveals its next move.
You’ll instantly see:
Which way it’s pushing — up, down, or stuck in the middle.
How hard it’s pushing — from fading weakness to full-blown strength.
When the gears are shifting — early warnings, explosive moves, smart pullbacks, or signs it’s running out of steam.
🔶 Why This Matters
Markets move in phases—sometimes they’re powering in one direction, sometimes they’re slowing down, and sometimes they’re reversing.
Knowing which phase you’re in can help you:
Avoid chasing a move that’s about to run out of steam.
Jump on a move when it’s just getting started.
Spot pullbacks inside a bigger trend (good for entries).
See when different timeframes are all pointing the same way.
🔶 What Kio IQ Shows You
Simple color-coded phases: “Strong Up,” “Up,” “Weak Up,” “Weak Down,” “Down,” “Strong Down.”
Clear visual signals
Full Shift: Strong momentum in one direction.
Half Shift: Momentum is building but not full power yet.
Pullback Shift: A small move against the trend that may be ending.
Early Scout / Lookout: First hints of a possible shift.
Exhaustion: Momentum is very stretched and may slow down.
Divergences: When price moves one way but momentum moves the opposite way—often a warning of a change.
Multi-Timeframe Table: See the trend strength for multiple timeframes (5m, current, 30m, 4h, 1D, and optional 1W/1M) all in one place.
Trend Strength %: A single number that tells you how strong the trend is across all timeframes.
Optional meters: A “momentum bar” and “trend strength gauge” for quick checks.
🔶 How It Works Behind the Scenes
Kio IQ measures price movement in different “speeds”:
Slow view: Big picture trend.
Medium view: The main engine for detecting the current phase.
Fast view: Catches recent changes in momentum.
Super-fast view: Finds tiny pullbacks inside the bigger move.
It compares these views to decide whether the market is strong up, weak up, weak down, strong down, or in between. Then it blends data from multiple timeframes so you see the whole picture, not just the current chart.
🔶 What You’ll See on the Chart
🔷 Full Shift Oscillator (FSO)
The image above highlights the Full Shift Oscillator (FSO).
The FSO is the cornerstone of Kio IQ, delivering mid-term momentum analysis. Using a proprietary formula, it captures momentum on a smooth, balanced scale — responsive enough to avoid lag, yet stable enough to prevent excessive noise or false signals.
The Key Upside Level for the FSO is +20, while the Key Downside Level is -20.
The image above shows the FSO above +20 and below -20, and the corresponding price movement.
FSML above +20 confirms sustained upside momentum — the market is being driven by consistent, broad-based buying pressure, not just a price spike.
FSML below -20 confirms sustained downside momentum — sellers are firmly in control across the market.
We do not chase the first sudden price move. Entries are only considered when the market demonstrates persistence, not impulse.
🔷 Half Shift Oscillator (HSO)
The image above highlights the Half Shift Oscillator (HSO).
The HSO is the FSO’s wingman — faster, more reactive, and designed to catch the earliest signs of strength, weakness, or momentum shifts.
While HSO reacts first, it is not a standalone confirmation of a major momentum change or trade-worthy strength.
Using the same proprietary formula as the FSO but scaled down, the HSO delivers smooth, balanced short-term momentum analysis. It is more responsive than the FSO, serving as the scout that spots potential setups before the main signal confirms.
The Key Upside Level for the FSO is +4, while the Key Downside Level is -4.
🔷 PlayBook Strategy: Shift Sync
Shift Sync is a momentum alignment play that triggers when short-term and mid-term momentum lock into the same direction, signaling strong directional control.
🔹 UpShift Sync – Bullish Alignment
HSO > +4 – Short-term momentum is firmly bullish.
FSO > +20 – Mid-term momentum confirms the bullish bias.
When both thresholds are met, buyers are in control and price is primed for continuation higher.
🔹 DownShift Sync – Bearish Alignment
HSO < -4 – Short-term momentum is firmly bearish.
FSO < -20 – Mid-term momentum confirms the bearish bias.
When both thresholds are met, sellers dominate and price is primed for continuation lower.
Execution:
Look for an entry opportunity in the direction of the alignment when conditions are met.
Avoid choppy conditions where alignment is frequently lost.
Why It Works
Think of the market as a tug-of-war between traders on different timeframes. Short-term traders (captured by the HSO) are quick movers — scalpers, intraday players, and algos hunting immediate edge. Mid-term traders (captured by the FSO) are swing traders, funds, and institutions who move slower but carry more weight.
Most of the time, these groups pull in opposite directions, creating chop and fakeouts. But when they suddenly lean the same way, the rope gets yanked hard in one direction. That’s when momentum has the highest chance to drive price further with minimal resistance.
Shift Sync works because it isolates those rare moments when multiple market “tribes” agree on direction — and when they do, price doesn’t just move, it flies.
Best Market Conditions
Shift Sync works best when the higher timeframe trend (daily, weekly, or monthly) is moving in the same direction as the alignment. This higher timeframe confluence increases follow-through potential and reduces the likelihood of false moves.
The image above shows an example of an UpShift Sync signal where the momentum table shows that the 1D momentum is bullish.
The image above shows bonus confluence, where the 1M and 1W momentum are also bullish.
The image above shows an example of a DownShift Sync signal where the momentum table shows that the 1D momentum is bearish. Bonus confluence also exists, where the 1W and 1M chart are also bearish.
Common Mistakes
Chasing late signals – Avoid entering if the Shift Sync trigger has been active for a long time. Instead, wait for a Shift Sync Pullback to look for opportunities to join in the direction of the trend.
Ignoring higher timeframe bias – Taking Shift Sync setups against the daily, weekly, or monthly trend reduces follow-through potential and increases the risk of a failed move.
🔷 Micro Shift Oscillator (MSO)
The image above highlights the Micro Shift Oscillator (MSO)
The MSO is the finishing touch to the FSO and HSO — the fastest and most reactive of the three. It’s built to spot pullback opportunities when the FSO and HSO are aligned, helping traders join strong price moves at the right time.
The MSO may reveal the earliest signs of a momentum shift, but that’s not its primary role. Its purpose is to identify retracement and pullback opportunities within the overarching trend, allowing traders to join the move while momentum remains intact.
🔷 Playbook Strategy: Shift Sync Pullback
Key Levels:
MSO Upside Trigger: +3
MSO Downside Trigger: -3
🔹 UpShift Pullback
Momentum Confirmation:
FSO > +20 – Mid-term momentum is strongly bullish.
HSO > +4 – Short-term momentum confirms alignment with the FSO.
Pullback Trigger:
MSO ≤ -3 – Signals a short-term retracement within the ongoing bullish trend and marks the earliest re-entry opportunity.
Entry Zone:
The blue arrow on the top chart shows where momentum remains intact while price pulls back into a zone primed for a move higher.
Setup Validity: Both FSO and HSO must remain above their bullish thresholds during the pullback.
Invalid Example:
If either the FSO or HSO drop below their bullish thresholds, momentum alignment breaks. No trade is taken.
🔹 DownShift Pullback
Momentum Confirmation:
FSO < -20 – Mid-term momentum is strongly bearish.
HSO < -4 – Short-term momentum aligns with the FSO, confirming seller dominance.
Pullback Trigger:
MSO ≥ +3 – Indicates a short-term retracement against the bearish trend, pointing to possible short-entry opportunities.
Entry Zone:
The purple arrow on the top chart marks valid pullback conditions — all three oscillators meet their bearish thresholds, and price is positioned to continue lower.
Setup Validity: Both FSO and HSO must remain below their bearish thresholds during the pullback.
Invalid Example:
If either oscillator rises above the bearish threshold, momentum alignment is lost and the MSO signal is ignored.
Why It Works
Even in strong trends, price rarely moves in a straight line. Supply and demand dynamics naturally create retracements as traders take profits, bet on reversals, or hedge positions.
While many momentum traders fear these pullbacks, they’re often the fuel for the next leg of the move — offering a “second chance” to join the trend at a more favorable price.
The Shift Sync Pullback pinpoints moments when both short-term (HSO) and mid-term (FSO) momentum remain firmly aligned, even as price moves temporarily against the trend. This alignment suggests the retracement is a pause, not a reversal.
By entering during a controlled pullback, traders often secure better entries, tighter stops, and stronger follow-through potential when the trend resumes.
Best Market Conditions:
Works best when the higher timeframe (daily, weekly, or monthly) is trending in the same direction as the pullback setup.
Consistent momentum is ideal — avoid erratic, news-driven chop.
Following a recent breakout (Gate Breaker setup) when momentum is still fresh.
Common Mistakes
Ignoring threshold breaks – Entering when either HSO or FSO dips through their momentum threshold often leads to taking trades in weakening trends.
Trading against higher timeframe bias – A pullback against the daily or weekly trend is more likely to fail; use higher timeframe confluence as a filter.
🔷 Macro Shift Oscillator (MaSO)
The chart above shows the MaSO in isolation.
While the MaSO is not part of any active Kio IQ playbook strategies, it delivers the clearest view of the prevailing macro trend.
MaSO > 0 – Macro trend is bullish. Readings above +4 signal extreme bullish conditions.
MaSO < 0 – Macro trend is bearish. Readings below -4 signal extreme bearish conditions.
Use the MaSO for context, not entries — it frames the environment in which all other signals occur
🔷 Shift Gates – Kio IQ Momentum Barriers
The image above shows UpShift Gates.
UpShift Gates mark the highest price reached during periods when the FSO is above +20 — moments when mid-term momentum is firmly bullish and buyers are in control.
UpShift Gates are upside breakout levels — key swing highs formed before a pullback during periods of strong bullish momentum. When price reclaims an UpShift Gate with momentum confirmation, it signals a potential continuation of the uptrend.
The image above shows DownShift Gates.
DownShift Gates Mark The Lowest Price Reached During Periods When The FSO Is Below -20 — Moments When Mid-Term Momentum Is Firmly Bearish And Sellers Are In Control.
DownShift Gates are downside breakout levels — key swing lows formed before an upside pullback during periods of strong bearish momentum. When price reclaims a DownShift Gate with momentum confirmation, it signals a potential continuation of the downtrend.
🔷 Playbook Strategy: Gate Breakers
Core Rule:
Long signal when price decisively closes beyond an UpGate (for longs) or DownGate (for shorts). The breakout must show commitment — no wick-only tests.
🔹 UpGate Breaker (UpGate)
Trigger: Price closes above the UpShift Gate level.
Bonus Confluence: MaSO > 0 at the moment of the break — confirms that the macro trend bias is in favor of the breakout.
Invalidation: Avoid taking the signal if the gate level forms part of a DownShift Rift (bearish divergence) — this signals underlying weakness despite the break.
The chart above shows valid UpGate Breakers.
The chart above shows an invalidated UpGate Breaker setup.
🔹 DownGate Breaker (DownGate)
Trigger: Price closes below the DownShift Gate level.
Bonus Confluence: MaSO < 0 at the moment of the break — confirms that the macro trend bias is in favor of the breakdown.
Invalidation: Avoid taking the trade if the gate level forms part of an UpShift Rift (bullish divergence) — this signals underlying strength despite the break.
The chart above shows a valid DownGate Breaker.
Why It Works
Key swing levels like Shift Gates attract a high concentration of resting orders — stop losses from traders caught on the wrong side and breakout orders from momentum traders waiting for confirmation.
When price decisively clears a gate with a strong close, these orders trigger in quick succession, creating a burst of directional momentum.
Adding the MaSO filter ensures you’re breaking gates with the prevailing macro bias, improving the odds that the move will continue rather than stall.
The divergence-based invalidation rule (Rift filter) prevents entries when underlying momentum is moving in the opposite direction, helping avoid “fake breakouts” that trap traders.
Best Market Conditions:
Works best in markets with clear trend structure and visible Shift Gates (not during chop).
Strongest when higher timeframe (1D, 1W, 1M) momentum aligns with the breakout direction.
MaSO > 0 for bullish breakouts, MaSO < 0 for bearish breakouts
Most reliable after a period of consolidation near the gate, where pressure builds before the break.
Common Mistakes
Trading wick-only tests – A breakout without a decisive candle close beyond the gate often fails.
Ignoring MaSO bias – Taking a break in the opposite macro direction greatly reduces follow-through odds.
Skipping the Rift filter – Entering when the gate forms part of a divergence setup exposes you to higher reversal risk.
Chasing extended moves – If price is already far beyond the gate by the time you see it, risk/reward is poor; wait for the next setup or a retest.
🔷 Shift Rifts - Kio IQ Divergences
This chart shows an UpShift Rift — a bullish divergence where price action and momentum part ways, signaling a potential trend reversal or acceleration.
Setup:
Price Action: Price is marking lower lows, indicating short-term weakness.
FSO Reading: The Full Shift Oscillator (FSO) is marking higher lows over the same period, showing underlying momentum strengthening despite falling prices.
The rift between price and the FSO suggests selling pressure is losing force while buyers quietly regain control.
When confirmed by broader trend alignment in Kio IQ’s multi-timeframe momentum table, the UpShift Rift becomes a setup for a bullish move.
This chart shows a DownShift Rift — a bearish divergence where price action and momentum split, signaling a potential downside reversal.
Setup:
Price Action: Price is marking higher highs, suggesting continued strength on the surface.
FSO Reading: The Full Shift Oscillator (FSO) is marking lower highs over the same period, revealing weakening momentum beneath the price advance.
The rift between price and momentum signals that buying pressure is fading, even as price makes new highs. This disconnect often precedes a momentum shift in favor of sellers.
When aligned with multi-timeframe bearish signals in Kio IQ’s momentum table, the DownShift Rift becomes a strong setup for downside continuation or reversal.
🔷 Playbook Strategy: Rift Reversal
The Rift Reversal is a divergence-based reversal play that signals when momentum is fading and an trend reversal is likely. It’s designed to catch early turning points before the broader market catches on.
Trader’s Note:
This strategy is not intended for beginners — it requires confidence in reading divergence and trusting momentum shifts even when price action still appears weak. Best suited for traders experienced in managing reversals, as entries often occur before the broader market confirms the move.
🔹 UpRift Reversal
Core Setup:
Price Action – Forms a lower low.
Momentum Rift – The FSO forms a higher low, signaling bullish divergence and weakening selling pressure.
Trigger:
A confirmed UpRift Reversal signal is printed when:
Bullish Divergence is detected — price makes a new low, but the oscillator fails to confirm.
Momentum begins turning up from the divergence low (marked on chart as ⇝)
The image above shows a valid UpRift Reversal play.
🔹 DownRift Reversal
Core Setup:
Price Action – Forms a higher high.
Momentum Rift – The FSO forms a lower high, signaling bearish divergence and weakening buying pressure.
Trigger
A confirmed DownRift Reversal signal is printed when:
Bearish Divergence is detected — price makes a new high, but the oscillator fails to confirm.
Momentum begins turning down from the divergence high (marked on chart as ⇝).
Why It Works
Shift Rifts work because momentum often fades before a price reverses.
Price is the final scoreboard — it reflects what has already happened. Momentum, on the other hand, is a leading indicator of pressure. When the FSO begins to move in the opposite direction of price, it signals that the dominant side in the market is losing steam, even if the scoreboard hasn’t flipped yet.
In an UpShift Rift, sellers keep pushing price lower, but each push has less force — buyers are quietly building pressure under the surface.
In a DownShift Rift, buyers keep marking new highs, but they’re spending more effort for less result — sellers are starting to take control.
These disconnects happen because large participants often scale into or out of positions gradually, creating momentum shifts before price reflects it. Shift Rifts capture those turning points early.
Best Market Conditions:
Best in markets that have been trending strongly but are starting to show signs of exhaustion.
Works well after a prolonged move into key support/resistance, where large players may take profits or reverse positions.
Higher win potential when the Rift aligns with higher timeframe momentum bias in Kio IQ’s multi-timeframe table.
Common Mistakes
Forcing Rifts in choppy markets – In sideways chop, small oscillations can look like divergences but lack conviction.
Ignoring multi-timeframe bias – Trading an UpShift Rift when higher timeframes are strongly bearish (or vice versa) reduces follow-through odds.
Entering too early – Divergences can extend before reversing; wait for momentum to confirm a turn (⇝) before making a trading decision.
Confusing normal pullbacks with Rifts – Not every dip in momentum is a divergence; the Rift requires a clear and opposing trend between price and FSO.
🔷 Shift Count – Momentum Stage Tracker
Purpose:
Shift Count measures how far a bullish or bearish push has progressed, from its first spark to potential exhaustion.
It tracks momentum in defined steps so traders can instantly gauge whether a move is just starting, picking up steam, fully extended, or at risk of reversing.
How It Works
Bullish Momentum:
Start (1–2) → New momentum emerging, early entry window.
Acceleration (3–4) → Momentum in full swing, best for holding or adding to a position.
Extreme Bullish Momentum / Final Stages (5) → Watch for signs of reversal or take partial profits.
Exhaust – Can only occur after 5 is reached, signaling that the rally may be losing steam.
Bearish Momentum:
Start (-1 to -2) → New selling pressure emerging.
Acceleration (-3 to -4) → Bear trend accelerating.
Extreme Bearish Momentum / Final Stages (-5) → Watch for reversal or scale out.
Exhaust – Can only occur after -5 is reached, signaling that the sell-off may be running out of force.
The chart above shows a full 5-UpShift count.
The chart above shows a full 5-DownShift count.
Why It’s Useful
Markets often move in momentum “steps” before reversing or taking a breather.
Shift Count makes these steps visible, helping traders:
Spot the early stages of a potential move.
Identify when a move is picking up steam.
Identify when a move is mature and vulnerable to reversal.
Combine with other Kio IQ strategies for better-timed entries and exits.
Why This Works
It’s visually obvious where you are in the momentum cycle without overthinking.
You can build rules like:
Only enter in Start phase when higher timeframe agrees.
Manage positions aggressively once in Acceleration phase.
Be ready to exit or fade in Exhaust phase.
Best Market Conditions
Trending markets where pullbacks are shallow.
Works best when combined with Shift Sync Pullback or Gate Breaker triggers to confirm timing.
Higher timeframe direction confluence.
Common Mistakes
Treating Exhaust as always a reversal — sometimes strong markets push past 5/-5 multiple times.
Ignoring higher timeframe bias — a “Start” on a 1-minute chart against a strong daily trend is much riskier.
🔷 Playbook Strategy: Exhaust Flip
Core idea: When Shift Count reaches 5 (or -5) and then prints Exhaust, momentum has likely climaxed, whether temporarily or leading to a full reversal. We take the first qualified signal against the prior move.
Trader’s Note:
This strategy is not intended for beginners — it requires confidence in trusting momentum shifts even when price action still appears strong. Best suited for traders experienced in managing reversals, as entries often occur before the broader market confirms the move.
🔹 UpExhaust Flip (fade a bullish run)
Setup:
Shift Count hits 5, then an Exhaust print occurs.
Invalidation
The local high is broken to the upside.
The chart above explains the UpExhaust Flip strategy in greater detail.
🔹 DownExhaust Flip (fade a bearish run)
Setup:
Shift Count hits -5, then an Exhaust print occurs.
Invalidation
The local low is broken to the downside.
The chart above explains the DownExhaust Flip strategy in greater detail.
Bonus Confluence (optional, not required)
Rift assist: An UpShift Rift (for longs) or DownShift Rift (for shorts) near Exhaust strengthens the flip.
MaSO context: Neutral or opposite-leaning MaSO helps. Avoid flips straight against a strong MaSO bias unless you have a structure break.
Why It Works
Exhaust marks climax behavior: the prior side has pushed hard, then failed to extend after meeting significant pushback. Liquidity gets thin at the edges; aggressive profit-taking meets early contrarians. A small confirmation (micro structure break or HSO turn) is often enough to flip the tape for a snapback.
Best Market Conditions
After extended, one-sided runs (multiple Shift Count steps without meaningful pullbacks).
Near Shift Gates or obvious swing extremes where trapped orders cluster.
When higher-timeframe momentum is neutral or softening (you’re fading the last thrust of a decisive move, not a fresh trend).
Common Mistakes
Fading too early: Taking the trade at 5 without waiting for the Exhaust.
Fading freight trains: Fighting a fresh Shift Sync in the same direction right after Exhaust (often just a pause).
No structure reference: Entering without a clear micro swing to anchor risk.
🔷 MTF Shift Table
The MTF Shift Table table provides a compact, multi-timeframe view of market momentum shifts. Each cell represents the current shift count within a given timeframe, while the classification label indicates whether momentum is strong, weak, or normal.
The chart above further outlines the MTF Shift Table.
Why It Works
Markets rarely move in a perfectly linear fashion — momentum develops, stalls, and transitions at different speeds across different timeframes. This table allows you to:
See momentum alignment at a glance – If multiple higher and lower timeframes show a sustained shift count in the same direction, the move has greater structural support.
Spot divergences early – A shorter timeframe reversing against a longer-term sustained count can warn of potential pullbacks or trend exhaustion before price confirms.
Identify “momentum stacking” opportunities – When shift counts escalate across timeframes in sequence, it often signals a stronger and more durable move.
Avoid false enthusiasm – A single timeframe spike without agreement from other periods may be noise rather than genuine momentum.
The Trend Score provides a concise, at-a-glance evaluation of an asset’s directional strength across multiple timeframes. It distills complex momentum and Shift data into a single, easy-to-read metric, allowing traders to quickly determine whether the prevailing conditions favor bullish or bearish continuation. The Trend Scale scales from -100 to 100.
How to Use It in Practice
Trend Confirmation – Confirm that your intended trade direction is backed by multiple timeframes maintaining consistent momentum.
Risk Timing – Reduce position size or take partial profits when lower timeframes begin shifting against the dominant momentum classification.
Multi-timeframe Confluence – Combine with other system signals (e.g., FSO, HSO) for higher-probability entries.
This table effectively turns a complex multi-timeframe read into a single, glanceable heatmap of momentum structure, enabling quicker and more confident decision-making.
The MTF Shift Table is the confluence backbone of every playbook strategy for Kio IQ.
🔷 Momentum Meter
The Momentum Meter is a composite gauge built from three of Kio IQ’s core momentum engines:
HSO – Short-term momentum scout
FSO – Mid-term momentum backbone
MaSO – Macro trend context
By combining these three readings, the meter provides the most strict and lagging momentum classification in Kio IQ.
It only flips direction when a composite score of all three oscillators reach defined thresholds, filtering out short-lived counter-moves and false starts.
Why It Works
Many momentum tools flip too quickly — reacting to short-lived spikes that don’t represent real directional commitment. The Momentum Meter avoids this by requiring alignment across short, mid, and macro momentum engines before it shifts bias.
This triple-confirmation rule filters out noise, catching only those moments when traders of all speeds — scalpers, swing traders, and long-term participants — are leaning in the same direction. When that happens, price movement tends to be more sustained and less prone to immediate reversal.
In other words, the Momentum Meter doesn’t just tell you “momentum looks good” — it tells you momentum looks good to everyone who matters, across all horizons.
How It Works
Blue = All three engines align bullish.
Pink = All three engines align bearish.
The meter ignores smaller pullbacks or temporary oscillations that might flip the faster indicators — it waits for total alignment before changing state.
Because of this strict confirmation requirement, the Momentum Meter reacts slower but delivers higher-conviction shifts.
How to Interpret Readings
Blue (Bullish Alignment):
Sustained buying pressure across short, mid, and macro views. Often marks the “full confirmation” stage of a move.
Pink (Bearish Alignment):
Sustained selling pressure across all views. Confirms sellers are in control.
Practical Uses
Trend Followers – Use as a “stay-in” confirmation once a position is already open.
Swing Traders – Great for filtering out low-conviction setups; if the Momentum Meter disagrees with your intended direction, conditions aren’t fully aligned.
Confluence and Direction Filter – The Momentum Meter can be used as a form of confluence i.e. blue = longs only, pink = shorts only.
Limitations
Will always turn after the faster oscillators (HSO/MSO). This is intentional.
Works best in trending markets — in choppy conditions it may lag shifts significantly.
Should be used as a bias filter, not a standalone entry signal.
🔷 Trend Strength Meter
The Trend Strength Meter is a compact visual gauge that scores the current trend’s strength on a scale from -5 to +5:
+5 = Extremely strong bullish trend
0 = Neutral, no clear trend
-5 = Extremely strong bearish trend
This is an optional tool in Kio IQ — designed for quick reference rather than as a primary trading trigger.
Why it works
Single-indicator trend reads can be misleading — they might look strong on one metric while quietly weakening on another. The Trend Strength Meter solves this by blending multiple inputs (momentum alignment, structure persistence, and multi-timeframe data) into one composite score.
This matters because trend health isn’t just about direction — it’s about persistence. A +5 or -5 score means the market is not only trending but holding that trend with structural support across multiple timeframes.
By tracking both direction and staying power, the Trend Strength Meter flags when a move is at risk of fading before price action fully confirms it — giving you a head start on adjusting your position or taking profits.
How It Works
The Trend Strength Meter evaluates multiple market inputs — including momentum alignment, price structure, and persistence — to assign a numeric value representing how firmly the current move is holding.
The scoring logic:
Positive values indicate bullish conditions.
Negative values indicate bearish conditions.
Higher magnitude (closer to ±5) = stronger conviction in that direction.
Values near zero suggest the market is in a transition or range.
How to Interpret Readings
+4 to +5 (Strong Up) – Trend is well-established, often with multi-timeframe agreement.
+1 to +3 (Up) – Bullish bias present, but not at maximum conviction.
0 (Neutral) – No dominant trend; could be consolidation or pre-shift phase.
-1 to -3 (Down) – Bearish bias present but moderate.
-4 to -5 (Strong Down) – Trend is firmly bearish, with consistent downside momentum.
Why It Works
A single timeframe or momentum reading can give a false sense of trend health.
The Trend Strength Meter aggregates multiple layers of market data into one simplified score, making it easy to see whether a move has the underlying support to continue — or whether it’s more likely to stall.
Because the score considers both direction and persistence, it can flag when a move is losing strength even before price structure fully shifts.
🔷 Kio IQ – Supplemental Playbook Strategies
These phases are part of the Kio IQ Playbook—situational tools that can help you anticipate potential momentum changes.
While they can be useful for planning and tactical adjustments, they are not primary trade triggers and should be treated as early, lower-conviction cues.
🔹 1. Scouting Phase (Light Early Cue)
Purpose: Provide the earliest possible hint that momentum may be shifting.
Upshift Trigger: FSO crosses above the 0 line.
Downshift Trigger: FSO crosses below the 0 line.
Why It Works
The 0 line in the Full Shift Oscillator (FSO) acts as a neutral momentum boundary.
When the FSO moves above 0, it suggests that medium-term momentum has shifted to bullish territory.
When it moves below 0, it suggests that medium-term momentum has shifted to bearish territory.
This crossover is often the first measurable sign of a momentum reversal or acceleration, well before slower indicators confirm it.
Think of it as "momentum poking its head above water"—you’re spotting the change before it becomes obvious on price alone.
Best Use
Works best when confirmed later by Lookout Phase or other primary Kio IQ signals.
Ideal for scouting in anticipation of potential opportunities.
Helpful when monitoring multiple assets and you want a quick filter for shifts worth watching.
Can act as a trade trigger when the MTF Shift Table shows confluence (i.e., UpShift Scouting Signal + Bullish MTF Table + High Trend Strength Score).
Common Mistakes
Acting on Scouting Phase signals against the MTF Shift Table as a stand-alone trade trigger. Without higher timeframe alignment or additional confirmation, many Scouting Phase crossovers can fade quickly or reverse, leading to premature entries.
Ignoring market context
A bullish Scouting Phase in a strong downtrend can easily fail.
Always check higher timeframe trend alignment.
Overreacting to noise: On lower timeframes, small fluctuations can create false scouting signals.
Best Practices
Filter with trend: Only act on Scouting Phases that align with the dominant higher timeframe trend.
Watch volatility: In low-volatility conditions, false scouting triggers are more likely.
🔹 2. Lookout Phase (Early Momentum Alert)
Purpose:
The Lookout Phase signals an early alert that momentum is potentially strengthening in a given direction. It’s more meaningful than the Scouting Phase, but still considered a preliminary cue.
Triggers:
Upshift: FSO crosses above the HSO.
Downshift: FSO crosses below the HSO.
Why It Works:
The Lookout Phase is designed to identify moments when mid-term momentum (FSO) overtakes short-term momentum (HSO). Since the FSO is smoother and reacts more gradually, its crossover of the faster-reacting HSO can indicate a shift from short-lived fluctuations to a more sustained directional move.
This makes it a valuable early read on momentum transitions—especially when supported by higher-timeframe context.
Best Practices:
Always check the MTF Shift Table for higher-timeframe alignment before acting on a Lookout Phase signal.
Look for confluence with the Momentum Meter
Treat Lookout Phase entries as probing positions—small, exploratory trades that can be scaled into if follow-through develops.
Common Mistakes:
Treating Lookout Phase signals as a definitive trade trigger without context
Entering solely on a Lookout Phase crossover, without considering the MTF Shift Table or broader market structure, can result in chasing short-lived momentum bursts that fail to follow through.
Ignoring prevailing higher-timeframe momentum
Trading a Lookout Phase signal that is counter to the dominant trend or higher-timeframe bias increases the risk of whipsaws and false moves.
🔶 Summary
Kio IQ is an all-in-one trading indicator that combines momentum, trend strength, multi-timeframe analysis, divergences, pullbacks, and exhaustion alerts into a clear, structured view. It helps traders cut through market noise by showing whether a move is strong, weak, a trap, or simply part of a larger trend. With tools like the Full Shift Oscillator, Multi-Timeframe Shift Table, Shift Gates, and Rift Divergences, Kio IQ simplifies complex market behavior into easy-to-read signals. It’s designed to help traders spot early shifts, align with momentum, and recognize when trends are building or losing steam—all in one place.
Paid script
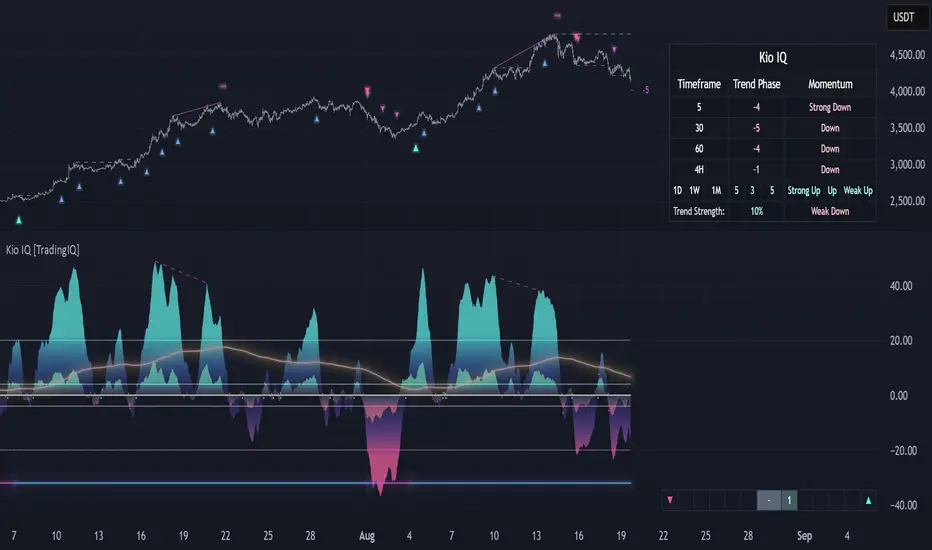
VWAP For Loop [BackQuant]VWAP For Loop
What this tool does—in one sentence
A volume-weighted trend gauge that anchors VWAP to a calendar period (day/week/month/quarter/year) and then scores the persistence of that VWAP trend with a simple for-loop “breadth” count; the result is a clean, threshold-driven oscillator plus an optional VWAP overlay and alerts.
Plain-English overview
Instead of judging raw price alone, this indicator focuses on anchored VWAP —the market’s average price paid during your chosen institutional period. It then asks a simple question across a configurable set of lookback steps: “Is the current anchored VWAP higher than it was i bars ago—or lower?” Each “yes” adds +1, each “no” adds −1. Summing those answers creates a score that reflects how consistently the volume-weighted trend has been rising or falling. Extreme positive scores imply persistent, broad strength; deeply negative scores imply persistent weakness. Crossing predefined thresholds produces objective long/short events and color-coded context.
Under the hood
• Anchoring — VWAP using hlc3 × volume resets exactly when the selected period rolls:
Day → session change, Week → new week, Month → new month, Quarter/Year → calendar quarter/year.
• For-loop scoring — For lag steps i = , compare today’s VWAP to VWAP .
– If VWAP > VWAP , add +1.
– Else, add −1.
The final score ∈ , where N = (end − start + 1). With defaults (1→45), N = 45.
• Signal logic (stateful)
– Long when score > upper (e.g., > 40 with N = 45 → VWAP higher than ~89% of checked lags).
– Short on crossunder of lower (e.g., dropping below −10).
– A compact state variable ( out ) holds the current regime: +1 (long), −1 (short), otherwise unchanged. This “stickiness” avoids constant flipping between bars without sufficient evidence.
Why VWAP + a breadth score?
• VWAP aggregates both price and volume—where participants actually traded.
• The breadth-style count rewards consistency of the anchored trend, not one-off spikes.
• Thresholds give you binary structure when you need it (alerts, automation), without complex math.
What you’ll see on the chart
• Sub-pane oscillator — The for-loop score line, colored by regime (long/short/neutral).
• Main-pane VWAP (optional) — Even though the indicator runs off-chart, the anchored VWAP can be overlaid on price (toggle visibility and whether it inherits trend colors).
• Threshold guides — Horizontal lines for the long/short bands (toggle).
• Cosmetics — Optional candle painting and background shading by regime; adjustable line width and colors.
Input map (quick reference)
• VWAP Anchor Period — Day, Week, Month, Quarter, Year.
• Calculation Start/End — The for-loop lag window . With 1→45, you evaluate 45 comparisons.
• Long/Short Thresholds — Default upper=40, lower=−10 (asymmetric by design; see below).
• UI/Style — Show thresholds, paint candles, background color, line width, VWAP visibility and coloring, custom long/short colors.
Interpreting the score
• Near +N — Current anchored VWAP is above most historical VWAP checkpoints in the window → entrenched strength.
• Near −N — Current anchored VWAP is below most checkpoints → entrenched weakness.
• Between — Mixed, choppy, or transitioning regimes; use thresholds to avoid reacting to noise.
Why the asymmetric default thresholds?
• Long = score > upper (40) — Demands unusually broad upside persistence before declaring “long regime.”
• Short = crossunder lower (−10) — Triggers only on downward momentum events (a fresh breach), not merely being below −10. This combination tends to:
– Capture sustained uptrends only when they’re very strong.
– Flag downside turns as they occur, rather than waiting for an extreme negative breadth.
Tuning guide
Choose an anchor that matches your horizon
– Intraday scalps : Day anchor on intraday charts.
– Swing/position : Month or Quarter anchor on 1h/4h/D charts to capture institutional cycles.
Pick the for-loop window
– Larger N (bigger end) = stronger evidence requirement, smoother oscillator.
– Smaller N = faster, more reactive score.
Set achievable thresholds
– Ensure upper ≤ N and lower ≥ −N ; if N=30, an upper of 40 can never trigger.
– Symmetric setups (e.g., +20/−20) are fine if you want balanced behavior.
Match visuals to intent
– Enabling VWAP coloring lets you see regime directly on price.
– Background shading is useful for discretionary reading; turn it off for cleaner automation displays.
Playbook examples
• Trend confirmation with disciplined entries — On Month anchor, N=45, upper=38–42: when the long regime engages, use pullbacks toward anchored VWAP on the main pane for entries, with stops just beyond VWAP or a recent swing.
• Downside transition detection — Keep lower around −8…−12 and watch for crossunders; combine with price losing anchored VWAP to validate risk-off.
• Intraday bias filter — Day anchor on a 5–15m chart, N=20–30, upper ~ 16–20, lower ~ −6…−10. Only take longs while score is positive and above a midline you define (e.g., 0), and shorts only after a genuine crossunder.
Behavior around resets (important)
Anchored VWAP is hard-reset each period. Immediately after a reset, the series can be young and comparisons to pre-reset values may span two periods. If you prefer within-period evaluation only, choose end small enough not to bridge typical period length on your timeframe, or accept that the breadth test intentionally spans regimes.
Alerts included
• VWAP FL Long — Fires when the long condition is true (score > upper and not in short).
• VWAP FL Short — Fires on crossunder of the lower threshold (event-driven).
Messages include {{ticker}} and {{interval}} placeholders for routing.
Strengths
• Simple, transparent math — Easy to reason about and validate.
• Volume-aware by construction — Decisions reference VWAP, not just price.
• Robust to single-bar noise — Needs many lags to agree before flipping state (by design, via thresholds and the stateful output).
Limitations & cautions
• Threshold feasibility — If N < upper or |lower| > N, signals will never trigger; always cross-check N.
• Path dependence — The state variable persists until a new event; if you want frequent re-evaluation, lower thresholds or reduce N.
• Regime changes — Calendar resets can produce early ambiguity; expect a few bars for the breadth to mature.
• VWAP sensitivity to volume spikes — Large prints can tilt VWAP abruptly; that behavior is intentional in VWAP-based logic.
Suggested starting profiles
• Intraday trend bias : Anchor=Day, N=25 (1→25), upper=18–20, lower=−8, paint candles ON.
• Swing bias : Anchor=Month, N=45 (1→45), upper=38–42, lower=−10, VWAP coloring ON, background OFF.
• Balanced reactivity : Anchor=Week, N=30 (1→30), upper=20–22, lower=−10…−12, symmetric if desired.
Implementation notes
• The indicator runs in a separate pane (oscillator), but VWAP itself is drawn on price using forced overlay so you can see interactions (touches, reclaim/loss).
• HLC3 is used for VWAP price; that’s a common choice to dampen wick noise while still reflecting intrabar range.
• For-loop cap is kept modest (≤50) for performance and clarity.
How to use this responsibly
Treat the oscillator as a bias and persistence meter . Combine it with your entry framework (structure breaks, liquidity zones, higher-timeframe context) and risk controls. The design emphasizes clarity over complexity—its edge is in how strictly it demands agreement before declaring a regime, not in predicting specific turns.
Summary
VWAP For Loop distills the question “How broadly is the anchored, volume-weighted trend advancing or retreating?” into a single, thresholded score you can read at a glance, alert on, and color through your chart. With careful anchoring and thresholds sized to your window length, it becomes a pragmatic bias filter for both systematic and discretionary workflows.

Daily Seasonality Strength + Prediction TableDaily Seasonality Strength + Prediction Table
Return Estimates:
This indicator uses historical price data to calculate average returns for each day (of the week or month) and uses these to predict the next day’s return.
Seasonality Strength:
It measures seasonality strength by comparing predicted returns with actual returns, using the inverse of MSE (higher values mean stronger seasonality).
supports up to 10 assets
This script is for informational and educational purposes only. It does not constitute financial, investment, or trading advice. I am not a financial advisor. Any decisions you make based on this indicator are your own responsibility. Always do your own research and consult with a qualified financial professional before making any investment decisions.
Past performance is no guarantee of future results. The value of the instruments may fluctuate and is not guaranteed
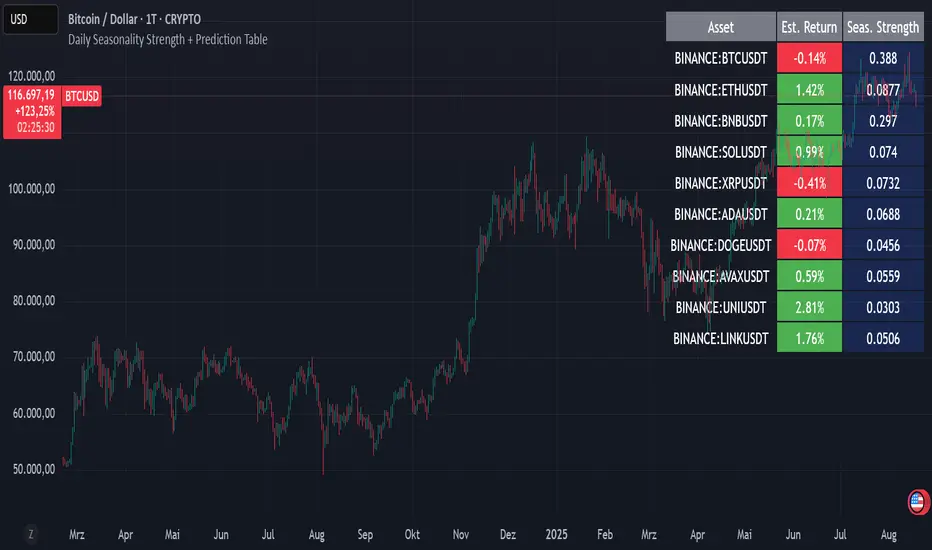
Volume Profile Grid [Alpha Extract]A sophisticated volume distribution analysis system that transforms market activity into institutional-grade visual profiles, revealing hidden support/resistance zones and market participant behavior. Utilizing advanced price level segmentation, bullish/bearish volume separation, and dynamic range analysis, the Volume Profile Grid delivers comprehensive market structure insights with Point of Control (POC) identification, Value Area boundaries, and volume delta analysis. The system features intelligent visualization modes, real-time sentiment analysis, and flexible range selection to provide traders with clear, actionable volume-based market context.
🔶 Dynamic Range Analysis Engine
Implements dual-mode range selection with visible chart analysis and fixed period lookback, automatically adjusting to current market view or analyzing specified historical periods. The system intelligently calculates optimal bar counts while maintaining performance through configurable maximum limits, ensuring responsive profile generation across all timeframes with institutional-grade precision.
// Dynamic period calculation with intelligent caching
get_analysis_period() =>
if i_use_visible_range
chart_start_time = chart.left_visible_bar_time
current_time = last_bar_time
time_span = current_time - chart_start_time
tf_seconds = timeframe.in_seconds()
estimated_bars = time_span / (tf_seconds * 1000)
range_bars = math.floor(estimated_bars)
final_bars = math.min(range_bars, i_max_visible_bars)
math.max(final_bars, 50) // Minimum threshold
else
math.max(i_periods, 50)
🔶 Advanced Bull/Bear Volume Separation
Employs sophisticated candle classification algorithms to separate bullish and bearish volume at each price level, with weighted distribution based on bar intersection ratios. The system analyzes open/close relationships to determine volume direction, applying proportional allocation for doji patterns and ensuring accurate representation of buying versus selling pressure across the entire price spectrum.
🔶 Multi-Mode Volume Visualization
Features three distinct display modes for bull/bear volume representation: Split mode creates mirrored profiles from a central axis, Side by Side mode displays sequential bull/bear segments, and Stacked mode separates volumes vertically. Each mode offers unique insights into market participant behavior with customizable width, thickness, and color parameters for optimal visual clarity.
// Bull/Bear volume calculation with weighted distribution
for bar_offset = 0 to actual_periods - 1
bar_high = high
bar_low = low
bar_volume = volume
// Calculate intersection weight
weight = math.min(bar_high, next_level) - math.max(bar_low, current_level)
weight := weight / (bar_high - bar_low)
weighted_volume = bar_volume * weight
// Classify volume direction
if bar_close > bar_open
level_bull_volume += weighted_volume
else if bar_close < bar_open
level_bear_volume += weighted_volume
else // Doji handling
level_bull_volume += weighted_volume * 0.5
level_bear_volume += weighted_volume * 0.5
🔶 Point of Control & Value Area Detection
Implements institutional-standard POC identification by locating the price level with maximum volume accumulation, providing critical support/resistance zones. The Value Area calculation uses sophisticated sorting algorithms to identify the price range containing 70% of trading volume, revealing the market's accepted value zone where institutional participants concentrate their activity.
🔶 Volume Delta Analysis System
Incorporates real-time volume delta calculation with configurable dominance thresholds to identify significant bull/bear imbalances. The system visually highlights price levels where buying or selling pressure exceeds threshold percentages, providing immediate insight into directional volume flow and potential reversal zones through color-coded delta indicators.
// Value Area calculation using 70% volume accumulation
total_volume_sum = array.sum(total_volumes)
target_volume = total_volume_sum * 0.70
// Sort volumes to find highest activity zones
for i = 0 to array.size(sorted_volumes) - 2
for j = i + 1 to array.size(sorted_volumes) - 1
if array.get(sorted_volumes, j) > array.get(sorted_volumes, i)
// Swap and track indices for value area boundaries
// Accumulate until 70% threshold reached
for i = 0 to array.size(sorted_indices) - 1
accumulated_volume += vol
array.push(va_levels, array.get(volume_levels, idx))
if accumulated_volume >= target_volume
break
❓How It Works
🔶 Weighted Volume Distribution
Implements proportional volume allocation based on the percentage of each bar that intersects with price levels. When a bar spans multiple levels, volume is distributed proportionally based on the intersection ratio, ensuring precise representation of trading activity across the entire price spectrum without double-counting or volume loss.
🔶 Real-Time Profile Generation
Profiles regenerate on each bar close when in visible range mode, automatically adapting to chart zoom and scroll actions. The system maintains optimal performance through intelligent caching mechanisms and selective line updates, ensuring smooth operation even with maximum resolution settings and extended analysis periods.
🔶 Market Sentiment Analysis
Features comprehensive volume analysis table displaying total volume metrics, bullish/bearish percentages, and overall market sentiment classification. The system calculates volume dominance ratios in real-time, providing immediate insight into whether buyers or sellers control the current price structure with percentage-based sentiment thresholds.
🔶 Visual Profile Mapping
Provides multi-layered visual feedback through colored volume bars, POC line highlighting, Value Area boundaries, and optional delta indicators. The system supports profile mirroring for alternative perspectives, line extension for future reference, and customizable label positioning with detailed price information at critical levels.
Why Choose Volume Profile Grid
The Volume Profile Grid represents the evolution of volume analysis tools, combining traditional volume profile concepts with modern visualization techniques and intelligent analysis algorithms. By integrating dynamic range selection, sophisticated bull/bear separation, and multi-mode visualization with POC/Value Area detection, it provides traders with institutional-quality market structure analysis that adapts to any trading style. The comprehensive delta analysis and sentiment monitoring system eliminates guesswork while the flexible visualization options ensure optimal clarity across all market conditions, making it an essential tool for traders seeking to understand true market dynamics through volume-based price discovery.

Price Acceleration Matrix [QuantAlgo]🟢 Overview
The Price Acceleration Matrix indicator is an advanced momentum analysis tool that measures the rate of change in price velocity across multiple timeframes simultaneously. It transforms raw price data into velocity measurements for each timeframe, then calculates the acceleration of these velocities to identify when momentum is building or deteriorating. By analyzing acceleration alignment across all three timeframes, the system can distinguish between strong directional moves (all timeframes accelerating in the same direction) and weak, choppy movements (mixed acceleration signals). This multi-timeframe acceleration matrix provides traders with early warning signals for momentum shifts, trend continuation and reversal opportunities across different timeframes and asset classes.
🟢 How It Works
The indicator employs a three-stage calculation process that transforms price data into actionable acceleration signals. First, it calculates velocity (rate of price change) for each of the three user-defined timeframes by measuring the percentage change in price over the specified lookback periods. These velocity calculations are normalized by their respective timeframe lengths to ensure fair comparison across different periods.
In the second stage, the system calculates acceleration by measuring the change in velocity from one bar to the next for each timeframe, effectively capturing the second derivative of price movement. This acceleration data reveals whether momentum is building (positive acceleration) or deteriorating (negative acceleration) at each timeframe level.
The final stage creates the acceleration matrix score by evaluating alignment across all three timeframes. When all timeframes show positive acceleration, the system averages them for maximum bullish signal strength. When all show negative acceleration, it averages them for maximum bearish signal strength. However, when acceleration signals are mixed across timeframes, the system applies a penalty by dividing the average by two, indicating consolidation or conflicting momentum forces. The resulting signal is then smoothed using an Exponential Moving Average and scaled to the -3 to +3 range using a user-defined threshold parameter.
🟢 How to Use
1. Signal Interpretation and Momentum Analysis
Positive Territory (Above Zero): Indicates accelerating upward momentum with bullish bias and favorable conditions for long positions
Negative Territory (Below Zero): Signals accelerating downward momentum with bearish bias and favorable conditions for short positions
Extreme Levels (±2 to ±3): Represent maximum acceleration alignment across all timeframes, indicating high-probability momentum continuation
Moderate Levels (±1 to ±2): Suggest building momentum with good timeframe alignment but less conviction than extreme readings
Near Zero (-0.5 to +0.5): Indicates mixed signals, consolidation, or momentum exhaustion requiring caution
2. Overbought/Oversold Zone Analysis
Above +2 (Overbought Zone): Markets showing extreme bullish acceleration may be due for profit-taking or short-term pullbacks
Below -2 (Oversold Zone): Markets showing extreme bearish acceleration may present reversal opportunities or bounce potential
Zone Exits: When acceleration retreats from extreme zones, it often signals momentum exhaustion and potential trend changes
🟢 Pro Tips for Trading
→ Early Momentum Detection: Watch for acceleration crossing above zero after periods of negative readings, as this often precedes major price movements by several bars, providing early entry opportunities before traditional indicators signal.
→ Momentum Exhaustion Signals: Exit or take profits when acceleration reaches extreme levels (±2.5 or higher) and begins to decline, even if price continues in the same direction, as momentum deterioration typically precedes price reversals.
→ Acceleration Divergence Strategy: Look for divergences between price highs/lows and acceleration peaks/troughs, as these often signal weakening momentum and potential reversal opportunities before they become apparent on price charts.
→ Threshold Optimization: Adjust the acceleration threshold based on asset volatility - higher thresholds (0.7-1.0) for volatile assets to reduce false signals, lower thresholds (0.3-0.5) for stable assets to maintain sensitivity.
→ Alert-Based Trading: Utilize the built-in alert system for bullish/bearish reversals (±2 level crosses) and trend changes (zero line crosses) to capture momentum shifts without constant chart monitoring, especially effective for swing trading approaches.
→ Risk Management Integration: Reduce position sizes when acceleration readings are weak (below ±1.0) and increase allocation when strong acceleration alignment occurs (above ±2.0), as signal strength correlates directly with probability of successful trades.

SONIC R BREAK FINAL (VER5)
Purpose: Capture breakouts through Support/Resistance (S/R) zones based on Pivot and filter signals using EMA 34 (High/Low/Close), EMA 89, volume, and candle structure. Includes a Higher Timeframe (H4) RSI risk warning (visual only, does not block entries).
How it works
S/R zones from Pivot
Draws Resistance and Support using ta.pivothigh/ta.pivotlow with Left/Right Bars.
S/R lines are locked with offset to reduce repaint.
EMA trend filters
EMA34 High/Low/Close build a “EMA 34 band”.
EMA89 works as the main trend filter.
Trend conditions:
Long: close above all EMA34 High/Low/Close and EMA89.
Short: close below all EMA34 High/Low/Close and EMA89.
Volume filter (optional)
Signal valid only if Volume > SMA(Volume, n).
Wick filter
Each wick (upper/lower) ≤ 50% of candle range to avoid weak breakouts.
Higher TF RSI risk (H4)
Fetches RSI from a higher timeframe (default H4).
If RSI exceeds threshold, breakout labels turn gray (risk warning only).
Anti-repeat mechanism
Each new pivot resets trigger.
Each S/R level triggers only once until the next pivot is formed.
Signals & Alerts
Label “B” (green) below candle: breakout above Resistance, valid EMA/Volume/Wick conditions.
Label “S” (red) above candle: breakout below Support, valid EMA/Volume/Wick conditions.
Gray labels = H4 RSI risk warning.
Unified alert: “S/R Breakout (Unified)” with message B=Buy, S=Sell, Gray=Risk.
Parameters
Show Breaks: toggle breakout detection.
Left/Right Bars: pivot sensitivity.
Require Volume > Average + Volume MA Length: volume filter.
Use H4 RSI Risk Warning: enable higher TF RSI check.
RSI Length, Higher TF (minutes), RSI thresholds for Buy/Sell risk.
Usage tips
Prioritize trades in the same direction as EMA89 and EMA34 trend.
Works on M5 to H4; best combined with RSI H4 when trading M15/M30.
Place SL behind the S/R just broken, TP by fixed RR or EMA trailing.
Increase Left/Right Bars for stronger zones and less noise in sideways markets.
Notes
Pivot still has repaint element (mitigated by offset).
This indicator is not financial advice. Always combine with proper risk management.
Version
Clean v4: added wick ≤50% filter, H4 RSI risk coloring, volume filter, anti-repeat pivot trigger, unified alert, EMA34 H/L/C background shading.
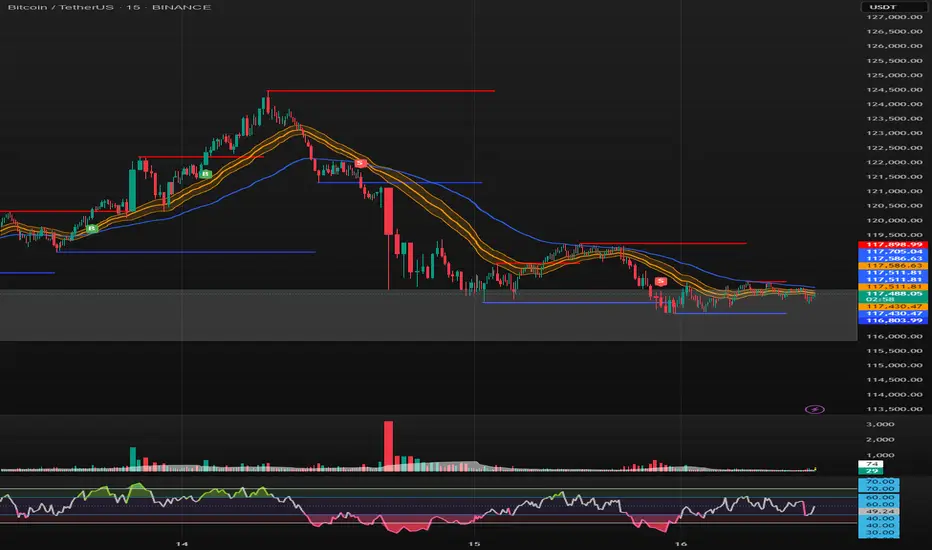
Trading Dashboard Position managementWhat This Script Does: A Simple Overview
Imagine you want a small, neat box on your trading chart that automatically calculates and displays key price levels for a potential trade. This script does exactly that.
It creates a "Trade Dashboard" that uses a popular volatility indicator called the Average True Range (ATR) to suggest:
A potential Entry price.
A Stop Loss level to limit potential losses.
Three different Target levels for taking profits.
You can customize everything, from how these levels are calculated to how the dashboard looks.

Trading StreetTrading Street Indicator
Trading Street is a comprehensive trading indicator that combines session timing analysis with technical trend analysis. It provides traders with visual cues for optimal trading times and market direction, making it perfect for forex and crypto trading.
Key Features
🕐 Trading Session Detection
Asia Session: 05:30 - 14:30 IST (Indian Standard Time)
London Session: 12:30 - 20:30 IST
New York Session: 18:30 - 02:30 IST (overnight)
Visual Session Backgrounds: Each session is highlighted with distinct colors
Session Overlap Handling: Smart precedence system (NY > London > Asia)
📊 Technical Analysis
50 EMA (Exponential Moving Average): Default golden line for trend analysis
Customizable EMA: Adjustable length (1-200 periods)
Trend Background: Green when price > EMA (bullish), Red when price < EMA (bearish)
Visual Trend Signals: Background colors change based on price vs EMA relationship
🎨 Customization Options
Session Colors: Customize Asia (green), London (blue), New York (orange)
EMA Settings: Adjust color, width, and length
Transparency Control: Adjust background opacity (0-100%)
Individual Toggles: Turn sessions and EMA on/off independently
How to Use
For Session Trading:
Identify Active Sessions: Look for colored backgrounds indicating active trading sessions
Session Overlaps: London-New York overlap (18:30-20:30 IST) is typically high volatility
Session Transitions: Watch for session changes for potential breakout opportunities
For Trend Analysis:
EMA Trend: Golden EMA line shows overall market direction
Background Colors:
Green background = Bullish trend (price above EMA)
Red background = Bearish trend (price below EMA)
Trend Confirmation: Use EMA alignment with session timing for better entries
Trading Strategy:
Session + Trend Alignment: Best trades when session activity aligns with EMA trend
Session Transitions: Look for breakouts during session changes
High Volatility Periods: London-New York overlap often provides best opportunities
Settings
Session Settings:
Show Asia Session: Toggle Asia session background
Show London Session: Toggle London session background
Show New York Session: Toggle New York session background
Background Transparency: Adjust opacity (0-100%)
EMA Settings:
Show EMA: Toggle EMA line on/off
EMA Length: Adjust period (1-200, default: 50)
EMA Color: Customize line color
EMA Line Width: Adjust thickness (1-4)
Best Timeframes
Recommended: 15M, 1H, 4H, Daily
Best for: Forex pairs, Crypto, Major indices
Optimal Use: Combine with price action and support/resistance levels
Pro Tips
Session Awareness: Trade during active sessions for better liquidity
Trend Confirmation: Use EMA trend to confirm session-based setups
Risk Management: Avoid trading during low-activity periods
Multi-Timeframe: Use on higher timeframes for trend, lower for entries
Technical Details
Pine Script Version: v5
Overlay: True (displays on main chart)
Timezone: IST (Indian Standard Time)
Compatibility: All TradingView instruments
Perfect for traders who want to combine session timing with technical analysis for better trading decisions! 🚀

EMA Deviation Strategy📌 Strategy: EMA Deviation Strategy
The EMA Deviation Strategy identifies potential reversal points by measuring how far the current price deviates from its Exponential Moving Average (EMA). It dynamically tracks the minimum and maximum deviation levels over a user-defined lookback period, and enters trades when price reaches extreme zones.
🔍 Core Logic:
• Buy Entry: When price deviates significantly below the EMA, approaching the historical minimum deviation — signaling a potential rebound.
• Sell Entry: When price deviates significantly above the EMA, nearing the historical maximum deviation — signaling a possible pullback.
• Optional Take Profit / Stop Loss: Manage risk with customizable exit levels.
⚙️ Customizable Inputs:
• EMA length and lookback period
• Threshold sensitivity for entry signals
• Take profit and stop loss percentages
📈 Best Used For:
• Mean reversion setups
• Assets with cyclical or range-bound behavior
• Identifying short-term overbought/oversold conditions
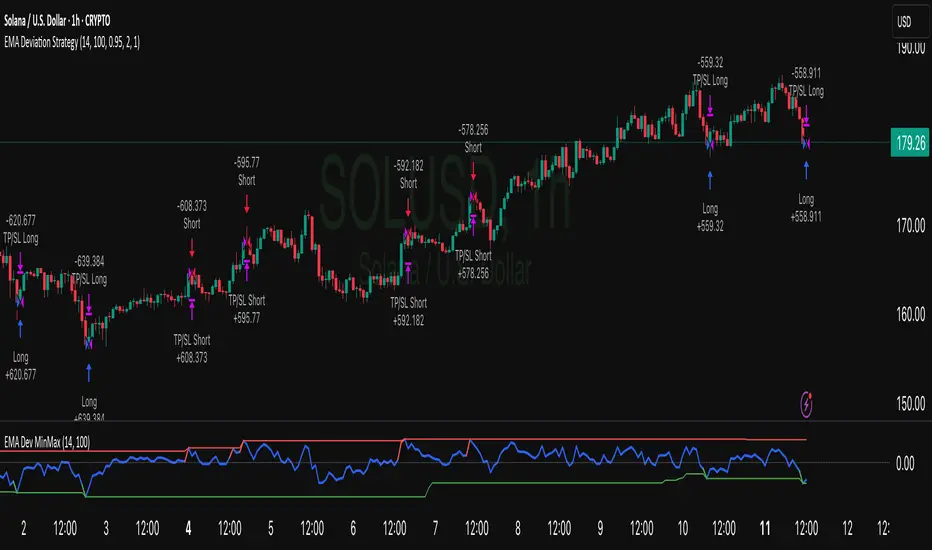
Recent Range DetectorOverview
The Recent Range Detector is a specialized indicator designed to identify when an asset is currently range-bound, providing traders with clear support and resistance levels for range trading strategies. Unlike traditional indicators that focus on trend detection, this tool specifically answers the question: "Is the price range-bound right now, and what are the exact trading levels?"
Key Features
✅ Smart Range Detection - Uses a multi-factor scoring system to identify legitimate ranges
✅ Dynamic Support/Resistance Levels - Automatically calculates and displays key trading levels
✅ Range Quality Scoring - Provides confidence levels (Strong/Moderate/Weak Range)
✅ Touch Validation - Counts actual price touches to confirm range reliability
✅ Breakout Detection - Alerts when price exits the established range
✅ Visual Clarity - Clean boxes, lines, and labels for easy interpretation
How It Works
The indicator analyses recent price action using three core metrics:
Touch Quality (40%) - How many times price has respected support/resistance levels
Containment Quality (40%) - What percentage of recent bars stayed within the range
Recent Respect (20%) - Whether the latest price action confirms the range
These combine into a Range Score (0-1) that determines range strength and reliability.
Settings & Parameters
Range Lookback Period (Default: 15)
Number of bars to analyse for range detection
Shorter periods = more responsive to recent ranges
Longer periods = more stable, fewer false signals
Range Tolerance (Default: 2.0%)
Tolerance for price touches around exact highs/lows
Lower values = stricter range requirements
Higher values = more flexible range detection
Minimum Touches (Default: 3)
Required number of support/resistance touches for valid range
Higher values = more confirmed ranges, fewer signals
Lower values = more sensitive, earlier detection
Visual Options
Show Range Box: Displays the range boundaries
Show Support/Resistance Lines: Extends levels into the future
Understanding the Output
Range Score (0.000 - 1.000)
0.7+ = Strong Range (Green) - High confidence range trading setup
0.5-0.7 = Moderate Range (Yellow) - Decent range with some caution
0.3-0.5 = Weak Range (Orange) - Low confidence, be careful
<0.3 = Not Ranging - Avoid range trading strategies
Range Status Classifications
Strong Range - Perfect for range trading strategies
Moderate Range - Good range with normal risk
Weak Range - Marginal range, use smaller positions
Not Ranging - Price is trending or too choppy for range trading
Key Metrics in Info Table
Range Size (%) - Size of the range relative to price level
5-15% = Ideal range size for most strategies
<5% = Tight range, lower profit potential
>15% = Wide range, higher profit potential but more risk
Support/Resistance Levels - Exact price levels for entries/exits
Use these as your key trading levels
Support = potential buy zone
Resistance = potential sell zone
Total Touches - Number of times price respected the levels
3-5 touches = Newly formed range
6-10 touches = Well-established range
10+ touches = Very strong, reliable range
Price Position (%) - Current location within the range
0-20% = Near support (potential long opportunity)
80-100% = Near resistance (potential short opportunity)
40-60% = Middle of range (wait for better entry)
Visual Elements
Range Box
Green Box = Strong Range (Score ≥ 0.7)
Yellow Box = Moderate Range (Score 0.5-0.7)
Orange Box = Weak Range (Score 0.3-0.5)
Support/Resistance Lines
- Horizontal lines showing exact trading levels
- Extend into the future for forward guidance
- Colour matches the range strength
Background Colouring
- Subtle background tint during range periods
- Helps quickly identify ranging vs trending markets
Breakout Signals
- 📈 RANGE BREAK UP - Price breaks above resistance
- 📉 RANGE BREAK DOWN - Price breaks below support
- Only appears for confirmed ranges (Score ≥ 0.5)
Trading Applications
Range Trading Strategy
1. Look for Range Score ≥ 0.5
2. Buy near support (Price Position 0-20%)
3. Sell near resistance (Price Position 80-100%)
4. Set stops just outside the range
5. Exit on breakout signals
Breakout Strategy
1. Identify strong ranges (Score ≥ 0.7)
2. Wait for volume-confirmed breakout
3. Enter in breakout direction
4. Use previous resistance as support (or vice versa)
Market Context
- Strong ranges often occur after trending moves
- Use higher timeframes to confirm overall market structure
- Combine with volume analysis for better entries/exits
Best Practices
What to Look For
✅ Range Score ≥ 0.5 for trading consideration
✅ Multiple touches (5+) for confirmation
✅ Clear price rejection at levels
✅ Reasonable range size (5-15% for most assets)
✅ Recent price respect of boundaries
What to Avoid
❌ Trading ranges with Score < 0.3
❌ Very tight ranges (<3% size) - low profit potential
❌ Ranges with only 1-2 touches - not confirmed
❌ Ignoring breakout signals
❌ Trading against the higher timeframe trend
Alerts Available
- Range Detected - New range formation
- Range Break Up - Upward breakout
- Range Break Down - Downward breakout
- Range Ended - Range condition ended
Timeframe Recommendations
- Daily Charts - Best for swing trading ranges
- 4H Charts - Good for intermediate-term ranges
- 1H Charts - Suitable for day trading ranges
- Lower Timeframes - May produce more noise
Conclusion
The Recent Range Detector eliminates guesswork in range identification by providing objective, quantified range analysis. It's particularly valuable for traders who prefer range-bound strategies or need to identify when trending strategies should be avoided.
Remember: No indicator is perfect. Always combine with proper risk management, volume analysis, and broader market context for best results.
Disclaimer
This indicator is for educational purposes only and should not be considered as financial advice. Trading involves risk, and past performance does not guarantee future results. Always conduct your own research and consider your risk tolerance before making any trading decisions.

Fundur - Trend LinesFundur - Trend Lines: Complete Trading Indicator Guide
Indicator Overview
The Fundur - Trend Lines is an advanced multi-layered trend analysis system that combines adaptive trend line technology, momentum analysis, and intelligent signal generation into one comprehensive trading tool. This indicator goes beyond traditional moving averages by utilizing volatility-adjusted trend lines that dynamically adapt to market conditions, providing traders with precise trend strength measurements and actionable trading signals.
What Makes Trend Lines Unique?
The Trend Lines indicator introduces Adaptive Trend Line Technology - a sophisticated methodology that uses Average True Range (ATR) calculations to create trend lines that respond intelligently to market volatility. Unlike static indicators, Trend Lines provides dynamic analysis that adapts its sensitivity based on current market conditions, offering more accurate trend identification and strength assessment.
Core Methodology
The indicator operates on the principle that trend strength can be quantified by analyzing the relationship between multiple adaptive trend lines, momentum indicators, and market structure. By combining Alignment Analysis , Distance Measurements , Momentum Confirmation , and Volatility Expansion Potential , the system generates a comprehensive trend strength score from 0-100% with corresponding trading signals.
Key Features
🎯 Adaptive Trend Line System Slow Trend Line : Primary trend direction with lower sensitivity for major trend identification Fast Trend Line : Higher sensitivity trend line for early trend change detection Volatility Adaptation : Both lines automatically adjust to market volatility using ATR calculations Cloud Visualization : Colored areas between trend lines show trend strength and direction
📊 Comprehensive Trend Strength Analysis Quantified Strength (0-100%) : Precise trend strength measurement combining multiple factors Alignment Score : Measures agreement between multiple trend line systems Distance Analysis : Evaluates price proximity to trend lines using ATR normalization Momentum Integration : Incorporates Awesome Oscillator for momentum confirmation Squeeze Factor : Identifies volatility expansion potential for breakout opportunities
🧠 Intelligent Signal Generation Position Signals : Clear ADD LONG, ADD SHORT, REDUCE, HOLD recommendations Risk Zone Classification : STRONG, MEDIUM, WEAK trend categorization Trend Direction : Bullish, Bearish, or Neutral trend identification Dynamic Updates : Real-time signal adjustments based on changing conditions
⚡ Enhanced Momentum Analysis Smoothed Momentum : Configurable momentum smoothing to reduce noise Acceleration Detection : Identifies momentum acceleration and deceleration Divergence Alerts : Detects price-momentum divergences for reversal warnings Directional Bias : Momentum confirmation for trend direction validation
🔍 Advanced Market Structure Detection Momentum Squeeze : Identifies low-volatility periods preceding major moves Volatility Expansion : Detects when markets break out of consolidation phases Trend Weakness Detection : Early warning system for deteriorating trends Structure Transition : Identifies when trends change character or direction
🎨 Professional Visual Interface Comprehensive Analysis Table : All key metrics displayed in organized format Visual Strength Bar : Graphical representation of trend strength Color-Coded Components : Intuitive color scheme for quick analysis Customizable Display : Flexible positioning and sizing options
Setup Guide
Step 1: Adding the Indicator
Open TradingView and navigate to your desired chart Click the "Indicators" button or press "/" key Search for "Fundur - Trend Lines" Add the indicator to your chart
Step 2: Basic Configuration
Main Features Settings ✅ Show Trend Analysis Table : ON (Essential for comprehensive analysis) ✅ Enable Trend Strength Analysis : ON (Core functionality) ✅ Generate Trading Signals : ON (For position management guidance)
Trend Lines Display ✅ Show Slow Trend Line : ON (Primary trend identification) ✅ Show Fast Trend Line : ON (Early signal detection) Trend Cloud Transparency : 89% (Default recommended, adjust for visibility)
Table Positioning Table Position : Top Right (recommended for most setups) Table Size : Normal (adjust based on screen size)
Step 3: Advanced Analysis Configuration
Enhanced Features (Optional) ✅ Enhanced Momentum Analysis : ON (for more accurate signals) ✅ Divergence Detection : ON (for reversal warnings) ⚠️ Momentum Squeeze Analysis : OFF initially (can add visual complexity)
Sensitivity Settings Divergence Sensitivity : 5 (Default - lower = more sensitive) Momentum Smoothing : 3 (Default - higher = smoother signals)
Step 4: Alert Configuration
Essential Alerts (Recommended) Trading Signal Alerts : Enable for position changes Trend Strength Change Alerts : Enable for trend monitoring Strength Change Threshold : 15% (Default recommended)
Advanced Alerts (Optional) Divergence Alerts : Enable for reversal warnings Early Weakness Alerts : Enable for risk management Momentum Squeeze Alerts : Enable for breakout opportunities Trend Line Cross Alerts : Enable for level-based signals
Basic Trading Guide
Understanding Trend Strength
The indicator's foundation is the Trend Strength Score - a quantified measurement (0-100%) that combines four key factors:
Strong Trends (75%+ Strength) 🟢 Characteristics : High alignment, close price-to-trend proximity, strong momentum Signals : ADD LONG (bullish) or ADD SHORT (bearish) Strategy : Aggressive position building, trend continuation trades Risk : Lower risk due to strong trend confirmation
Medium Trends (35-75% Strength) 🟡 Characteristics : Mixed signals, moderate alignment, transitional phases Signals : HOLD current positions Strategy : Conservative approach, wait for clearer signals Risk : Medium risk, requires careful monitoring
Weak Trends (Below 35% Strength) 🔴 Characteristics : Poor alignment, distant from trend lines, weak momentum Signals : REDUCE positions or CLOSE Strategy : Risk reduction, position unwinding Risk : High risk, trend likely changing or failing
Entry Strategies
Primary Strategy: Trend Continuation Entries Setup : Strong trend strength (75%+) with clear directional bias Entry Trigger : ADD LONG or ADD SHORT signal confirmation Direction : Follow the trend direction (Bullish ⬆ or Bearish ⬇) Timing : Enter on signal generation or price pullback to trend lines
Stop Loss Placement Conservative Method : Beyond the opposite trend line Aggressive Method : Below/above recent swing points For Long Positions : Below the Slow Trend Line For Short Positions : Above the Slow Trend Line Dynamic Adjustment : Move stops with trend line progression
Profit Taking Strategy
For Long Positions (Bullish Trend): Take 50% profits when trend strength begins declining from peak Take another 25% when trend strength drops below 60% Close remaining position when REDUCE signal appears Trail stops using Fast Trend Line for remaining position
For Short Positions (Bearish Trend): Take 50% profits when trend strength begins declining from peak Take another 25% when trend strength drops below 60% Close remaining position when REDUCE signal appears Trail stops using Fast Trend Line for remaining position
Alternative Strategy: Divergence-Based Reversal Entries Setup : Bullish or bearish divergence detected with weakening trend strength Entry : On trend direction change confirmation Risk Management : Tight stops due to counter-trend nature Targets : Opposite trend line or previous swing levels
Risk Management Framework
Position Sizing Based on Trend Strength Strong Trends (75%+) : Full position size (within risk tolerance) Medium Trends (35-75%) : Reduced position size (50-75% of normal) Weak Trends (Below 35%) : Minimal or no new positions Transitional Periods : Smallest position sizes due to uncertainty
Dynamic Risk Adjustment Increasing Strength : Can add to positions gradually Decreasing Strength : Begin profit-taking and position reduction Rapid Strength Loss : Quick position reduction or exit Divergence Warning : Tighten stops and prepare for reversal
Analysis Setups
Setup 1: Scalping Configuration (1-5 minute charts)
Settings Optimization: Momentum Smoothing: 2 (more responsive) Divergence Sensitivity: 3 (higher sensitivity) Enhanced Momentum Analysis: ON All alerts: ON for rapid signal updates
Visual Settings: Table Size: Small (less screen space) Table Position: Top Right Trend Cloud Transparency: 85% (subtle background)
Trading Approach: Focus on quick ADD signals in strong trends Use Fast Trend Line for entry timing Quick profit-taking at first sign of strength decline Very tight risk management due to lower timeframe noise
Setup 2: Day Trading Configuration (5-15 minute charts)
Settings Optimization: All default settings work well Enable Momentum Squeeze Analysis for breakout identification Divergence Detection: ON for reversal warnings Trend Strength Change Threshold: 12% (more sensitive)
Visual Settings: Table Size: Normal Show all trend analysis components Trend Cloud Transparency: 89% (default)
Trading Approach: Wait for clear trend strength above 65% before entering Use momentum squeeze breakouts for early entries Hold positions through medium strength phases Exit on REDUCE signals or strength below 40%
Setup 3: Swing Trading Configuration (1-4 hour charts)
Settings Optimization: Momentum Smoothing: 4 (smoother for higher timeframe) Divergence Sensitivity: 7 (less sensitive, higher quality signals) Enhanced Momentum Analysis: ON Early Weakness Alerts: ON (important for swing trades)
Visual Settings: Table Size: Normal or Large Focus on trend strength and direction components Enable all visual features for comprehensive analysis
Trading Approach: Require trend strength above 70% for new positions Hold through temporary strength dips if above 50% Use divergence signals for early exit warnings Focus on major trend changes for position adjustments
Setup 4: Position Trading Configuration (4H-Daily charts)
Settings Optimization: Momentum Smoothing: 5 (maximum smoothing) Divergence Sensitivity: 10 (only high-quality divergences) Strength Change Threshold: 20% (major changes only) Focus on trend direction and strength alerts
Visual Settings: Table Size: Large (detailed analysis) Clean visual setup focusing on major components Minimal clutter for long-term perspective
Trading Approach: Only enter on very strong trends (80%+ strength) Hold through significant strength fluctuations Focus on major trend direction changes Use weekly/monthly trend alignment for confirmation
Setup 5: Multi-Asset Analysis Configuration
For Forex Pairs: Standard settings work well due to 24-hour markets Pay attention to session-based strength changes Use momentum squeeze for breakout trading Enable all alert types for continuous monitoring
For Cryptocurrency: Reduce momentum smoothing (2-3) due to high volatility Increase divergence sensitivity (3-4) for early warnings Focus on strength changes above 20% threshold Use squeeze analysis for breakout opportunities
For Stock Indices: Standard settings appropriate for most indices Enable early weakness alerts for risk management Consider market hours for signal validity Use higher timeframes for better signal quality
Visual Components
Trend Analysis Table Trend Strength : Percentage with visual strength bar Trend Signal : Current position recommendation Risk Zone : STRONG/MEDIUM/WEAK classification Alignment : Trend line agreement analysis Distance : Price proximity to trend lines Momentum : Current momentum direction and strength
Trend Lines and Clouds Colored Clouds : Green for bullish trends, red for bearish trends Cloud Intensity : Opacity reflects trend strength Dynamic Colors : Automatically adjust based on trend direction
Momentum Squeeze Visualization Yellow Highlights : Above and below price during squeeze periods Squeeze Indication : Identifies low-volatility consolidation Breakout Preparation : Visual cue for potential explosive moves
Alert System
Trading Signal Alerts ADD LONG : Strong bullish trend confirmed ADD SHORT : Strong bearish trend confirmed REDUCE : Trend weakness detected, position reduction recommended HOLD : Maintain current positions, no change needed
Trend Analysis Alerts Strength Increase : Trend gaining momentum Strength Decrease : Trend losing momentum Early Weakness : Warning of potential trend deterioration Trend Direction Change : Major trend shift detected
Technical Alerts Bullish Divergence : Price falling but momentum rising Bearish Divergence : Price rising but momentum falling Momentum Squeeze Start : Volatility contraction beginning Momentum Squeeze End : Breakout from low volatility period Trend Line Cross : Price crossing above/below trend lines
Setting Up Alerts Enable desired alert types in indicator settings Create TradingView alerts using "Fundur - Trend Lines" as source Configure notification methods (email, SMS, app notifications) Test alerts with paper trading before live implementation Adjust alert frequency settings to avoid spam
Best Practices
Trend Strength Interpretation Above 75% : High confidence trades, full position sizes 50-75% : Moderate confidence, reduced positions Below 50% : Low confidence, minimal or no positions Rapid Changes : Pay attention to sudden strength shifts
Signal Management Don't Chase : Wait for clear signals rather than predicting Confirm with Price Action : Use chart patterns for additional confirmation Respect Risk Zones : Adjust position sizes based on trend classification Monitor Alignment : Strong alignment increases signal reliability
Multi-Timeframe Integration Higher Timeframe Bias : Use daily/weekly for overall trend direction Lower Timeframe Entries : Use hourly/15min for precise entry timing Confirmation Requirement : Ensure alignment between timeframes Conflict Resolution : Higher timeframe takes precedence
Common Mistakes to Avoid
Signal Misinterpretation Ignoring Trend Strength : Don't trade weak signals (below 60%) Fighting the Trend : Don't go against strong trend directions Overreliance on Single Component : Consider all analysis factors Impatience : Wait for clear STRONG trend classification
Risk Management Errors Fixed Position Sizes : Adjust sizes based on trend strength Ignoring REDUCE Signals : Take profits when indicator suggests No Stop Losses : Always use stops beyond trend lines Overleveraging Weak Signals : Use smaller positions in MEDIUM zones
Technical Analysis Errors Ignoring Divergences : Pay attention to momentum warnings Missing Squeeze Opportunities : Watch for breakout setups Poor Timeframe Selection : Match timeframe to trading style Alert Fatigue : Don't enable too many alerts simultaneously
Advanced Techniques
Divergence Trading Early Reversal Detection : Use divergences to anticipate trend changes Confirmation Required : Wait for trend strength decline confirmation Tight Risk Management : Use smaller positions for counter-trend trades Quick Exits : Take profits rapidly on divergence trades
Momentum Squeeze Strategies Breakout Preparation : Position before squeeze resolution Direction Bias : Use trend direction for breakout direction Volume Confirmation : Combine with volume analysis when possible False Breakout Protection : Use tight stops for failed breakouts
Multi-Component Analysis Alignment Priority : Perfect alignment (100%) provides highest confidence Distance Consideration : Closer to trend lines = higher probability Momentum Confirmation : Rising momentum supports trend direction Squeeze Integration : High squeeze factor increases breakout potential
Dynamic Position Management Scaling In : Add to positions as trend strength increases Scaling Out : Reduce positions as trend strength decreases Stop Trailing : Move stops with Fast Trend Line progression Profit Optimization : Use strength peaks for profit-taking timing
Conclusion
The Fundur - Trend Lines indicator represents a sophisticated approach to trend analysis, combining adaptive trend line technology with comprehensive strength measurement and intelligent signal generation. By quantifying trend strength through multiple analytical components, this indicator provides traders with objective, data-driven insights for making informed trading decisions.
The indicator's strength lies in its ability to adapt to changing market conditions while providing clear, actionable signals. The comprehensive trend strength analysis removes guesswork from trend trading, allowing traders to size positions appropriately and manage risk effectively based on quantified market conditions.
Success with the Trend Lines indicator comes from understanding that trend strength is dynamic and requires continuous monitoring. The 0-100% strength scale provides an objective framework for position management, while the multi-component analysis ensures robust signal generation across different market conditions.
Remember that this indicator works best when combined with proper risk management, position sizing, and market context awareness. Start with conservative settings and smaller position sizes while learning the indicator's behavior in different market environments. The comprehensive alert system helps maintain awareness of changing conditions, but successful trading still requires discipline and adherence to your trading plan.
For optimal results, practice with the indicator across different timeframes and market conditions, always prioritizing risk management over profit potential, and maintaining realistic expectations about market behavior and indicator performance.
