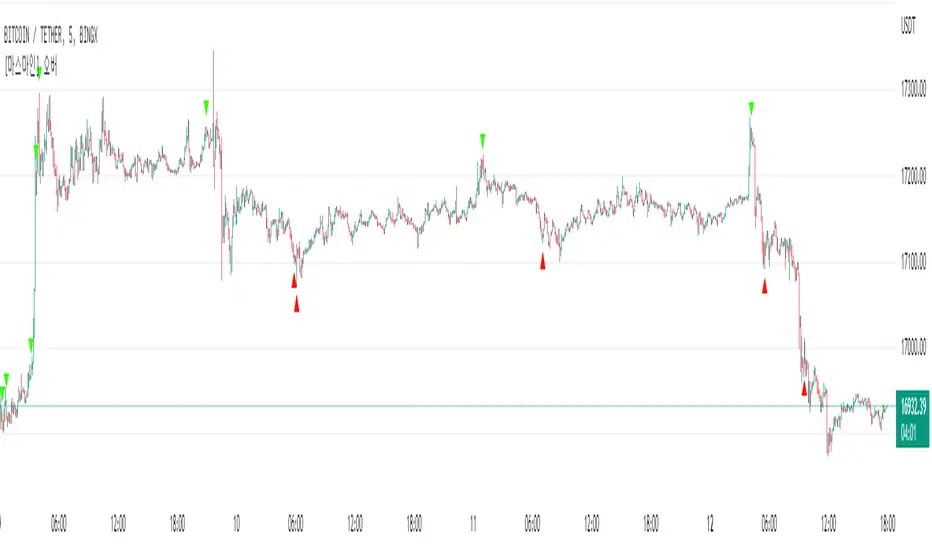
MarsMine_OverThis indicator marks the area where the overbought/oversold section of the Stochastic RSI and the overbought/oversold section of the RSI overlap with arrows.
If an upward arrow appears on the indicator, it can be recognized that both StoRSI and RSI have entered the oversold zone.
When a down arrow appears, both the StoRSI and RSI can be considered to have entered the overbought zone.
This is a good signal to identify the direction of the future trend.
이 지표는 Stochastic RSI의 과매수/과매도 구간과 RSI의 과매수/과매도 구간이 겹치는 구간을 화살표로 표기 해주는 지표 입니다.
해당 지표에서 상승 화살표가 출현할 경우에는 StoRSI와 RSI 모두 과매도 구간에 진입했다고 인식할 수 있으며,
하락 화살표가 출현할 경우에는 StoRSI와 RSI 모두 과매수 구간에 진입했다고 인식할 수 있습니다.
이는 추후 추세의 방향성을 파악할 수 있는 좋은 시그널 입니다.
Trend
Wunder Trend Reversal botWunder Trend Reversal bot
1. Wunder Trend Reversal Bot - this has only one goal to find a reversal of the trend.
2. The strategy determines, based on the specified value for the filter, a market reversal based on the price actions of the previous bars.
3. A short EMA is used to filter false signals after the reversal signal was received. Crossing the EMA and changing its direction confirms the trend change.
4. There are 2 ways to calculate stop loss and take profit. You can choose one of them:
- Classic stop loss and take profit in a fixed percentage
- ATR stop loss and take pro
5. ATR uses risk reward (R:R) to calculate take profit. The script calculates the risk-reward based on a certain stop loss level and uses it to calculate the take profit
6. A function for calculating risk on the portfolio (your deposit) has been added to the script. When this option is enabled, you get a calculation of the entry amount in dollars relative to your Stop Loss. In the settings, you can select the risk percentage on your portfolio. The loss will be calculated from the amount that will be displayed on the chart.
For example. Deposit - $1000, you set the risk to 1%. SL 5%. Entry volume will be $200. The loss at SL will be $10.10$ this is your 1% risk or 1% of the deposit.
Important! The risk per trade must be less than the Stop Loss value. If the risk is greater than SL, then you should use leverage.
The amount of funds entering the trade is calculated in dollars. This option was created if you want to send the dollar amount from Tradingview to the exchange. However, putting your volume in dollars you get the incorrect net profit and drawdown indication in the backtest results, as TradingView calculates the backtest volume in contracts.
To display the correct net profit and drawdown values in Tradingview Backtest results, use the ”Volume in contracts” option.

RSItrendRSItrend is a trend indicator based on the standard RSI.
The logic of building the indicator: We build a channel based on the RSI extremes. The exit of the RSI from the channel up is the beginning of the uptrend, the exit of the RSI from the channel down is the beginning of the downtrend. In the downtrend, the candles are colored blue, in the uptrend - orange.
Possible use of the indicator:
I recommend using it with heiken ashi
On small timeframes, you can trade using extremes that are easy to determine by the indicator, as shown in the example given.
On the higher timeframes above the day, you can simply buy an orange bar, sell a blue one. Add a few money management techniques and make a profit.

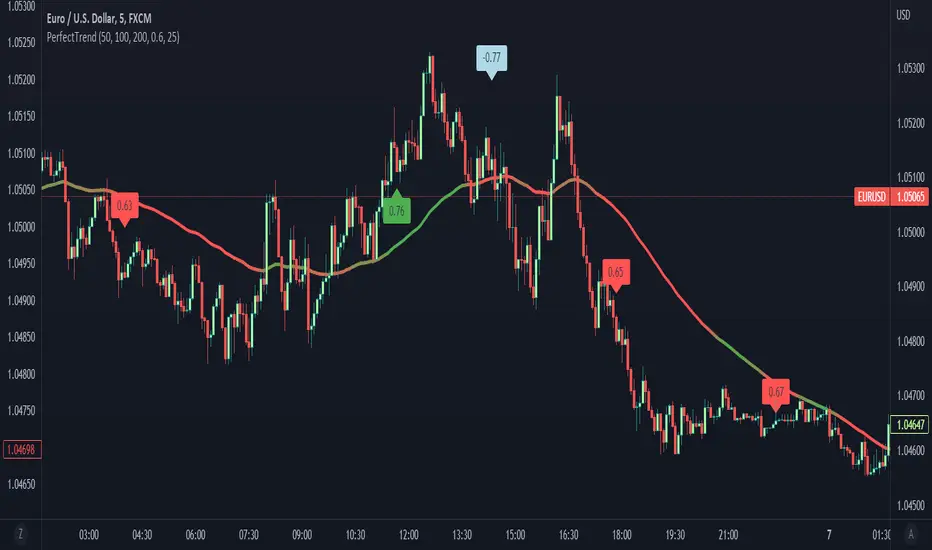
CorrelationTrendThis indicator is a correlation based trend classifier.
How does it work:
- The software measures a correlation between 3 moving averages and the price.
- If there is a significant correlation and the price is moving upwards, the Moving average displayed on the chart is going to be green and if it is moving downwards, it is going to be red. And, if the correlation is not significant, the price is going to have yellow/orange shade.
- In case there is a strong negative correlation (= strong divergence between price and moving average), you will receive a light blue label on the chart. Such events can indicate possible reversals in the market
How to read correlation:
- The correlation value ranges from -1 to 1
- If the value is either bigger than 0.5 or lower than -0.5, the correlation is considered as significant and as the value is closer to 1 or -1, its significancy rises.
Correlation is larger than 0.5 --> means that there is a positive relationship between the direction of price and moving averages (there is a trend)
Correlation is lower than -0.5 --> means that there is a divergence between the direction of price and moving average(possible sudden change of the trend)
What can you see on the chart:
- Moving average--> based on its color you can get a sense of the trend
- Red/Green labels--> after the correlation value surpasses positive Precision trigger (defined in inputs), it creates a label to let you know of such event
- Light blue labels--> after the correlation is lower than negative Precision trigger (defined in inputs), it creates a label to let you know of possible price reversion
- Label on the current bar--> this label displays the current correlation value
Inputs:
- First MA Period = period of the first moving average
- Second MA Period = period of the second moving average
- Third MA Period = period of the third moving average
- Analysis span = number of bars used for computing
- Show flags = set to "true" if you wish to see the labels, otherwise set to "false"
- Show MA = set to "true" if you wish to see the moving average, otherwise set to "false"
Additional info:
- This indicator on its own should not be used as a source of entry signal
- Its main purpose is to give you a sense of the current trend and possible price reversions
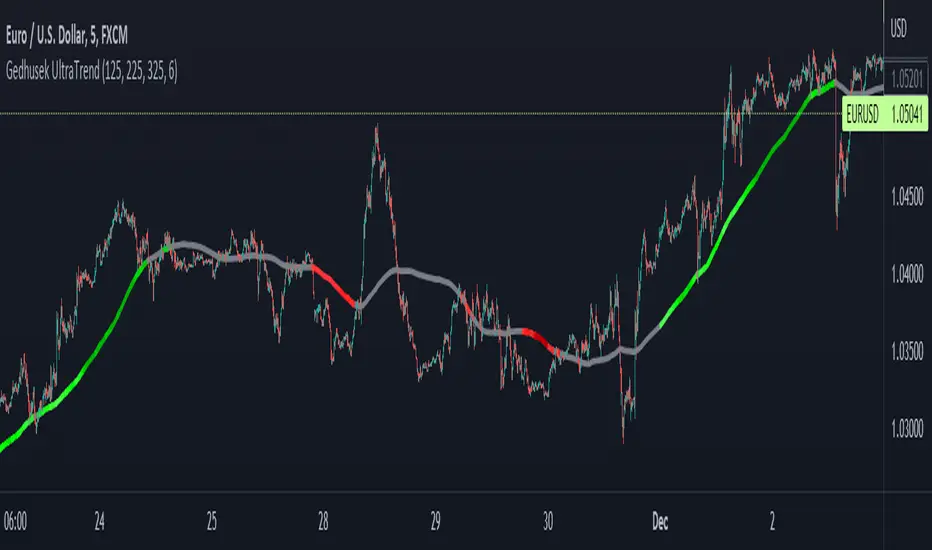
Gedhusek UltraTrendThis indicator serves a purpose of a trend recognizer. It is able to tell you whether the market is bullish, bearish or if the price goes sideways.
Process of determining the trend:
- The indicator uses 3 moving averages to determine the trend
- For each of these averages, there is calculated value change over a certain period. So, if the value of Moving average was 100 and now it is 110, the change is going to be +10
- After these calculations are done, all three of these values are summed up into one
- Based on this value we can determine whether the overall sentiment is bullish or bearish (if the value is larger than 0, the sentiment is bullish and if it is bellow 0, it is bearish)
- One more metric is used when determining the overall trend, and that is the ATR indicator. This indicator represents a certain movement threshold that has to be surpassed in order to have a valid trend
- So all of this can be summed up into this -> if the summed up value of the value shift of 3 moving averages over certain period is larger than ATR value for certain period, the trend is considered as bullish and if this summed up value is lower than ATR value *-1, the trend is considered as bearish. In case the summed value is smaller than ATR value and larger than ATR value *-1, there is no trend.
-----------------------------------------------------------------------------------------
How to use the Indicator:
- The indicator should be used as a tool for giving you a generic feel about the current trend
- It is not a signal providing system
- It can be adjusted for any trading style by changing the Periods in input menu. (As the values are lower, it will give you more short time trend and vice versa)
- It is a great tool to combine with any trend following strategy
-----------------------------------------------------------------------------------------
Which markets and TimeFrame:
- The UltraTrend Indicator works on all of the markets and all of the TF
- I usually use it on 15min and 1H TF, but that is solely my preference
-----------------------------------------------------------------------------------------
Inputs:
First Period = Period of the first MA
Second Period = Period of the second MA
Third Period = Period of the third MA
ATR Period = Period of the ATR
Supertrend Rally RollercoasterSupertrend indicator is a trend following indicator similar to moving averages. You can use this on any timeframe if there is enough market data.
What about the Supertrend Rally Rollercoaster?
The main objective of this indicator is to avoid fake trends as much as possible and find the best bull and bear runs.
The best timeframe is the 15 minute timeframe.
This indicator consist of 4 Supertrend periods. The most important period of this indicator is the fourth period. This is the period that determines the overall trend for the timeframe.
The rest of the bands can be used as confirmations to the trend, determine trade entries, and possible as trade exits and scalping.
The main use of this indicator is to be used with value lines and contraction zones, as showed in the picture below.
So basically the average price or the mean is the value line produced by the contraction. The expansion follows, and then you must wait for the actual trend.
If price is below the value line then you wait for a uptrend and preferably a proper entry. Then you ride it up to the value line as TP, or you can
also let it continue on riding, but your preference.
If price is above value then, you wait for a downtrend and then short to value. This is the main trading strategy behind this indicator and what it has intended for.
The indicator also comes with alerts on when the trend changes and also on the arrows which are take profit symbols.
On an uptrend you will see red take profit signals which work with RSI. They tell you when a possible trend reversal can take place.
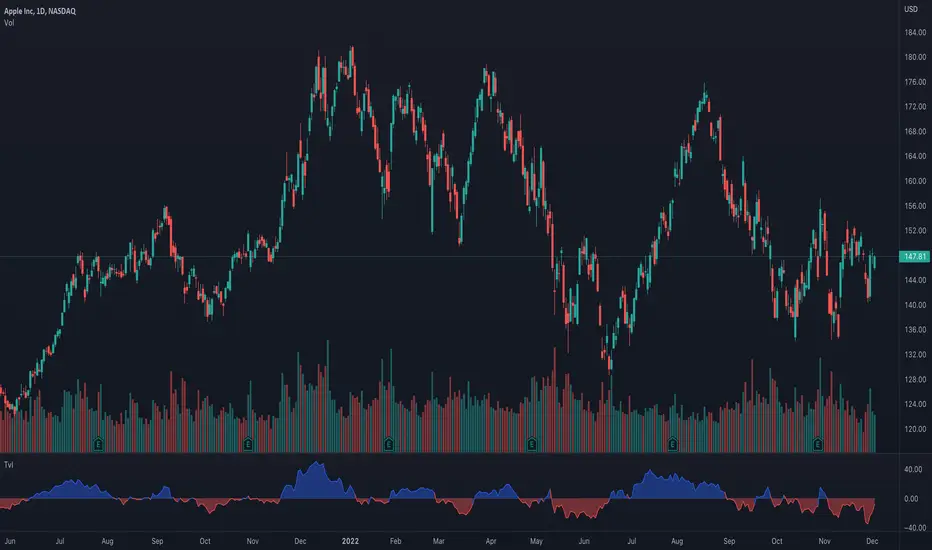
Ticker vs IndexI was exploring a simple idea how I can visualize the ticker performance against the underlying Index (or any other ticker) performance.
how it works:
When the line is moving up (blue zone), the ticker is performing better than the underlying index (e.g. SPX)(configurable).
When the line is moving down (red zone), the ticker is performing worse than the underlying index.
How to use it:
Use as confirmation always in conjunction with other (main) indicators, avoid "buy" when indicator is in the red zone
Also, crossing over the zero line is often an indication for an upcoming upward move
Try to different SMA length - default is 20 but 10 was often showing better results
(No financial advise, for testing purposes only)
Extended Recursive Bands StrategyThe original indicator was created by alexgrover .
All credit goes to alexgrover for creating the indicator that this strategy uses.
This strategy was posted because there were multiple requests for it, and no strategy based on this indicator exists yet.
The Recursive Bands Indicator, an indicator specially created to be extremely efficient, I think you already know that calculation time is extra important in algorithmic trading, and this is the principal motivation for the creation of the proposed indicator. Originally described in Alex's paper "Pierrefeu, Alex (2019): Recursive Bands - A New Indicator For Technical Analysis", the indicator framework has been widely used in his previous uploaded indicators, however it would have been a shame to not upload it, however user experience being a major concern for me, I decided to add extra options, which explain the term "extended".
The Indicator
The indicator displays one upper and one lower band, every common usages applied to bands indicators such as support/resistance , breakout, trailing stop, etc, can also be applied to this one. Length controls how reactive the bands are, higher values will make the bands cross the price less often.
In order to provide more flexibility for the user alexgrover added the option to use various methods for the calculation of the indicator, therefore the indicator can use the average true range , standard deviation, average high-low range, and one totally exclusive method specially designed for this indicator.
Added logic:
We have implemented a logic that checks whether the bands have been following in the same direction for a set amount of bars. This logic must be true before it can enter trades. This is completely new code that was written by us entirely, and it makes a huge difference on strategy performance.
Strategy Long conditions:
1 — Price low is below the the lower band.
2 — The lower band keeps increasing in value until the 'lookback' setting amount of bars is reached.
Strategy Short conditions:
1 — Price high is above the upper band.
2 — The upper band keeps decreasing in value until the 'lookback' setting amount of bars is reached.
Strategy Properties:
We have set a default commission of 0.06% because these are Bybit's fees. The strategy uses an order size of 10% of equity, since drawdown is very low like this. We also use a 10 tick slippage to keep results realistic and account for this. All other settings were left as default apart from initial capital, just to decrease the size of the numbers.

Futures SignalThis is a Futures Signal Indictor works using support & resistance and market trend, it is designed for all type of markets (crypto, forex, stock etc.) and works on all commonly used timeframes (preferably on 5 Min, 15 Min Candles).
How it works Futures Signal Indictor :
Core logic behind this indicator is to finding the Support and Resistance , we find the Lower High (LH) and Higher Low (HL) to find the from where the price reversed (bounced back) and also we use a custom logic for figuring out the peak price in the last few candles. Based on the multiple previous Support and Resistance (HH, HL, LL LH) we calculate a price level, this price level is used a major a factor for entering the trade. Once we have the price level we check if the current price crosses that price level, if it crossed then we consider that as a long/short entry (based on whether it crosses resistance or support line that we calculated). Once we have pre long/short signals we further filter it based on the market trend to prevent too early/late signals. Along with this if we don't see a clear trend we do the filtering by checking how many support or resistance level the price has bounced off.
Stop Loss and Take Profit: We have also added printing SL and TP levels on the chart to make the it easier for everyone to find the SL/TP values. Script calculates the SL value by checking the previous support level for LONG trade and previous resistance level for SHORT trades. Take profit are calculated in 0.5 ratio as of now.

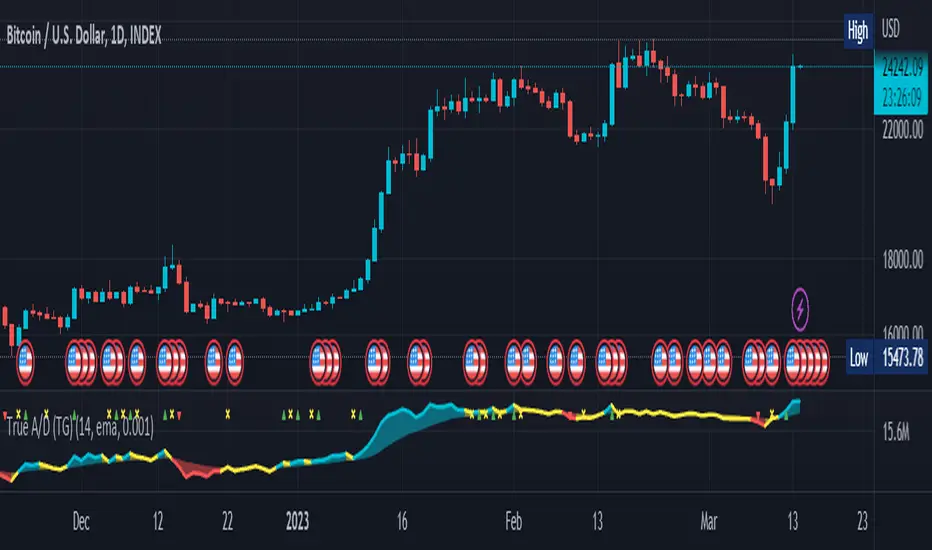
True Accumulation/Distribution (TG fork)An accumulation/distribution indicator that works better against gaps and with trend coloring.
Accumulation/Distribution was developed by Marc Chaikin to provide insight into strength of a trend by measuring flow of buy and sell volume .
The fact that A/D only factors current period's range for calculating the volume multiplier causes problem with price gaps. They are ignored or even misinterpreted.
True Accumulation/Distribution solves the problem by using True Range instead of only relying on current period's high and low.
Most of the time, True A/D reverts to producing the same values as the original A/D. The difference between True A/D and original A/D can be better seen when a gap has occurred, True A/D has handles it better than Accumulation/Distribution which a bearish close in period's range cause it to misinterpret the strong buy pressure as sell volume
The Moving Average Cloud is simply the filling between the moving average and the True A/D. This feature was inspired by D7R ACC/DIST closed-source indicator, kudos to D7R for making such neat visual indicators (but unfortunately all closed source!).
This indicator was made to extend the original work by adding MTF support and a moving average cloud and coloring.
If you like this indicator, please show the original author RezzaHmt some love:
Musashi_Katana=== Musashi-Katana ===
This tool was designed to fit my particular trading style and personal theories about the "Alchemy of the markets" and ''Harmonic Structure'.
Context
When following a Technical approach to to surf the markets, there are teachings that must be understood before reaching a confort-zone, this usually happen the possible worst way by constant experimentation, it hurts.
Here few technical hints:
- Align High timeframes with lower timeframes:
This simple concept relax a lot complexity of finding of a trend bias. Musashi-Katana allows you to use technical indicator corresponding to specific timeframes, like daily weekly or yearly. They wont change when you change the chart's timeframe, its very useful as you know where you're standing in the long term, Its quite relaxing.
- Use volume:
The constant usage of volume will allow you to sync with the market's breathing. This shows you the mass of money flowing into and out of the market, is key if you want to understand momentum. This tool can help here, as it have multi-period vwaps. You can use yearly, monthly for swing trading, and even weekly if you enjoy scalping.
Useful stuff:
- You have access to baselines, AMA and Kijun-sen with the possibility of adding ATR bands.
- AMAs come as two lines strategies for different approaches, fast medium or slow.
- You can experiment with normal and multi timeframe moving averages and other trend tools.
Final Note
If used correctly Musashi-Katana is a very powerful tool, which makes no sense as there is no correct usage. Don't add everything at the same time, experiment, combine stuff, every market is different.
Backtest every possible strategy before using it, see what works and doesn't. This gives you a lot of peace, specially while you're at the tip of the spear surfing the markets
--> I personally use this in combination with 'Musashi_Slasher (Mometum+Volatility)', as it gives me volatility and momentum in a very precise way.

Band of Filtered RS by Mustafa ÖZVERBand of Filtered RS by Mustafa ÖZVER
This code shows a range (max-min values) price may get if we get strong movements. These values is based on RSI (Relative Strange Index). And also these are calculated using RSI, if we get trades to make rsi is equal to 25 (or rsi down limit) or 75 (rsi up limit) or any value you set, how much will price value get? This code calculate these and shows these to you on graph.
This price are between these band limits because we expect cross reaction to hard movements on price.
For scalping, we can use these values as
long signal when price under down limit,
short signal when price over up limit,
But only these values can not guarantee good results for trading. BE CAREFUL

ASFX A2 Entry (Beta)This script is a counter intuitive pullback system.
Directional bias:
The system is suitable for trading markets where a strong trend is present.
The trend is measured by the SMA of the RSI (middle of the TDI) also known as the L50.
When this SMA is above 50 the market is deemed bullish.
When this SMA is below 50 the market is deemed bearish.
The duration of time above and below the center 50 accentuates the current directional bias.
When each EMA is below its longer term EMA, the market is said to be in full trend bearish.
When each EMA is above its longer term EMA, the market is said to be in full trend bullish.
The EMAs and TDIs run in the background so as to allow the trader to focus on signals.
Letter gradings and colour are applied to the trend strength with A being the highest.
Counter trend signals are available if the trader wishes.
Signal painting can be selected and deselected by letter.
The letter grading system is covered by selecting the rules feature in the settings which will bring up a table.
The rules table will give more detail as to the specifics of the system if the trader wishes to see them.
Signal:
The signal occurs when we have our directional bias and a candle breaks the 21 EMA and closes in the direction opposite to our bias.
The midway point of the candle body must close however in the direction of our bias (below for shorts, above for longs)
Hypothesis and example:
We want to join a strong trend at the best possible price.
If we are in an uptrend we can join on a break and close of a candle below the 21 EMA, if the uptrend is to continue this would be a 'cheap' price for long positions
If we are in a downtrend we can join on a break and close of a candle above the 21 EMA, if the downtrend is to continue this would be an 'expensive' price for short positions.

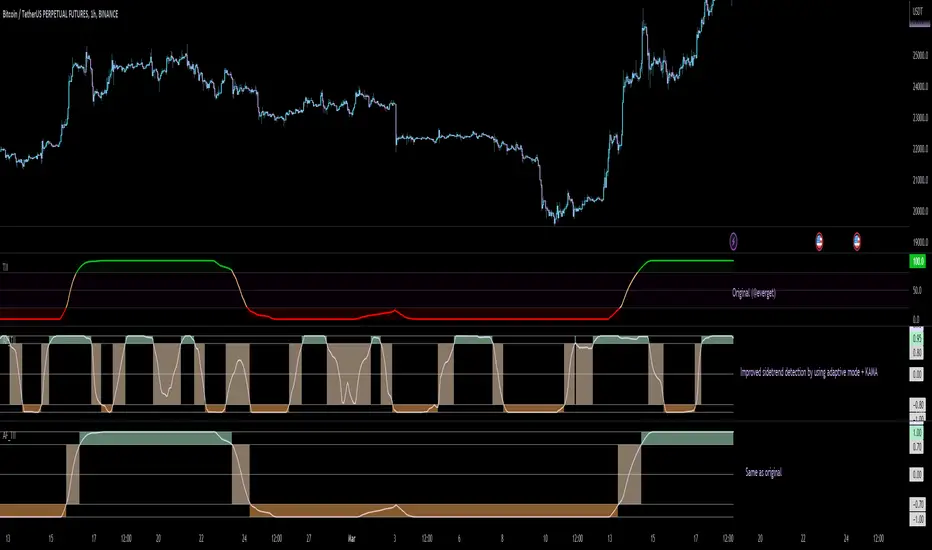
Adaptive Fisherized Trend Intensity Index Introduction
Here, I modified the script "Trend Intensity Index" (TII) of @everyget.
TTI was developed by M.H. Pee, who also published other trend analysis indicators like the Trend Trigger/Continuation Factor
It helps to determine how strong the current trend is.
The stronger the trend, the higher the chance the price may continue moving in the current direction.
Features
Adaptive mode (based on Ehlers dominant cycle determination) => automatically determines the length
Inverse Fisher Transform => gives sharper signals
Customizable MA Types => discover the impact of different ma bases
Hann Window and NET smoothing => state-of-the-art smoothing
Trend Visualization => shows you the up/down/side trend
Usage
This indicator here offers a perfect trend filtering system. It is capable of up/down/side trend detection.
There are a lot of trend indicators which don't respect sidetrends, which makes this indicator pretty useful.
A lot of traders use trend-following trading systems.
A trader will usually make his/her entry in the market during a strong trend and ride it, until the TII provides an indication of a reversal.
For mean-revertive trading systems, you could use TII to just trade in side trend.
A lot of mean-revertive signal emitters like Bollinger Bands or RSI work most of the times better in side trend.
Furthermore, every timeframe could be used, but higher timeframes have more impact because trends are stronger there.
Signals
Green zone (Top) => Etablished bullish trend
"Peachy" Zone (Middle) => Sidetrend/flat market
Red Zone (Bottom) => Etablished bearish trend
Enjoy guys!
(Let me know your opinions!)
--
Credits to:
@blackcat1402
@DasanC
@cheatcountry
@everget
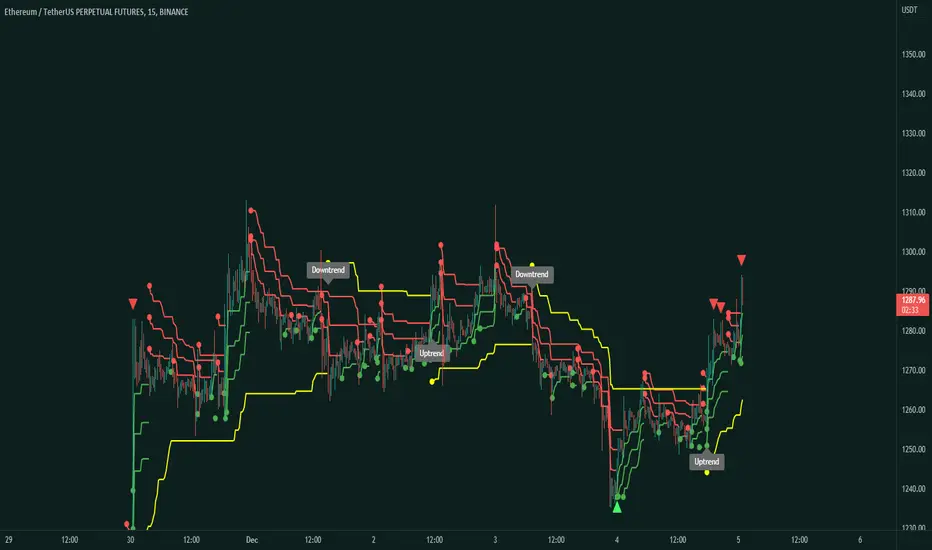
Super Synchronicity x Musa MoneyThe goal of this indicator is to display a simple and easy method that gives traders a logical strategy that can be applied in many different ways.
This indicator uses fractal support and resistance created by close above or close below candle structures. This indicator displays sell/buy boxes that represents entries and take profit levels. It also shows multi-timeframe breakouts and structure points. In an buy box (green) the bottom of the box symbolizes the stop loss and the top of the box symbolizes the buy entry. In a sell box (red) the bottom of the box symbolizes the entry and the top of the box symbolizes the stop loss. The lines drawn are support and resistance areas on current and higher timeframe showing market structure and trend.
How to use it:
You must choose a higher timeframe and a lower timeframe. The lower timeframe will be in synchronicity with the higher timeframes trend. The boxes that appear will either be green or red depending on the higher timeframes trend. These boxes will represent your entries. The lavender boxes represents your exit. The dark colored boxes represents a higher probability trade than the light colored boxes bases on market structure (higher highs and higher lows or lower higher and lower lows).

Trend & atr day & calcHi!
Why for what and how in this script?
At the time of publication the script consists of three modules, it may increase in the future.
1. Bottom left corner : daytime ATR module
(idea and basis of the author's script - ???)
- The size of the daily ATR based on 14 bars;
- intraday ATR progress;
- colour indication of the progress status, for easier visual perception (green < 70%, yellow 70-90 and red over 90% of ATR)
By evaluating the progress of the daily ATR, it is possible to suggest and expedient to enter/exit/hold a trade.
2. Top right: trend module
The trend is calculated based on Bill Williams' alligator indicator
- trend status on specified timeframes for the current ticker;
- colour indication for visual perception (green - growing trend, yellow - alligator is sleeping, red - downtrend)
Do not forget that the alligator is based on moving averages with the resulting consequences.
Its purpose is to assess the state of the trend on other ticker TFs, without additional actions (switching to another screen or TF)
3. In the bottom left corner - risk and position calculator
(based on an idea of the risk calculator by @andrei.bunulu)
It helps to determine the advisability of entering the trade and also what size position to enter into the trade, within money management strategy chosen.
- The calculator works in two directions: long deal and short deal (short deal calculation is enabled by check-box in settings)
- two calculation methods:
a. based on the set stop loss % (default is 0.3%), in this mode the stop and takeout level is automatically calculated (default is 1 / 3).
b. by entering the desired price levels (entry, stop and take profit points)
To make this work correctly please do not forget to choose the type of calculation (% or price) in the settings, and the currency symbol (for visual representation in the results).
The calculator can take into account the set commissions and spreads.
When hovering over the module - tooltips are displayed.
Each module can be enabled / disabled in the settings.
The size and arrangement of the modules is made for joint use with the script - "Abnormal Bar".
/// а по-русски это так ///
Привет!
Зачем для чего и как в этом скрипте?
На момент публикации скрипт состоит из трех модулей, возможно в будущем увеличится.
1. В левом нижнем углу : модуль дневного ATR
(идея и основа скрипт автора - ???)
- размер дневной ATR на основании 14 баров;
- прогресс ATR внутри дня;
- цветовая индикация состояния прогресса, для более простого визуального восприятия (зеленый < 70%, желтый 70-90 и красный более 90% ATR)
Оценивая прогресс дневного ATR, можно предположить и целесообразности входа / выхода / удержания из сделки.
2. В правом верхнем углу: модуль тренда
Тренд рассчитывается на основе индикатора - аллигатор Билла Вильямса
- состояние тренда на указанных таймфреймах для текущего тикера;
- цветовая индикация для визуального восприятия (зеленый - растущий тренд, желтый - аллигатор спит, красный - нисходящий тренд)
Не забываем, что аллигатор построен на основе скользящих средних с вытекающими последствиями.
Назначение - оценить состояние тренда на других ТФ тикера, без дополнительных действий (переключения на другой экран или ТФ)
3. В нижнем левом углу - калькулятор рисков и позиции
(на основе идеи калькулятора аuthor: @andrei.bunulu)
Помогает определить целесообразность входа в сделку, а также каким размером позиции входить в сделку, в рамках выбранной стратегии мани менеджмента.
- калькулятор работает в два направления: длинная и короткая сделка (расчет по короткой включается в настройках чек-боксом)
- два варианта расчета:
а. на основании установленного % стоп лосса (по-умолчанию 0,3%), при этом режиме происходит автоматический расчет уровня стопа и тейка (по умолчанию 1 / 3).
b. путем ввода данных желаемых уровней цены (точки входа, стопа и тейк профита)
Для корректной работы не забываем в настройках выбирать тип расчета (% или цена), а также символ валюты (для визуального отображения в итогах).
Калькулятор может учитывать установленный размер комиссий и спреда.
При наведении на модуль - отображаются подсказки.
Каждый модуль можно включить / выключить в настройках.
Размер и расположение модулей сделано для совместного использования со скриптом - "Abnormal Bar"

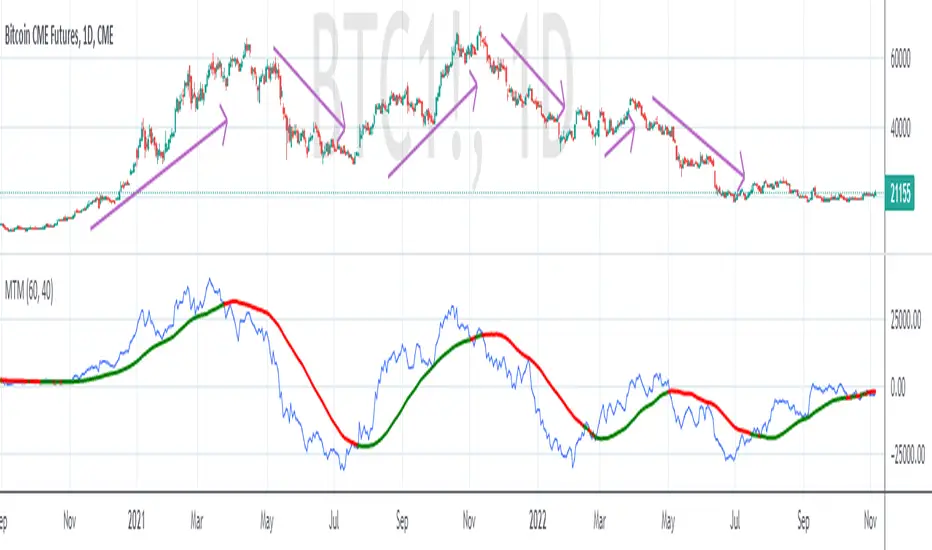
MTM - Momentum IndicatorMTM - Momentum
Description
The Momentum indicator is a speed of movement indicator that is designed to identify the speed (or strength) of price movement. This indicator compares the current close price to the close price N bars ago and also displays a moving average of this difference.
Category
Momentum Indicators
Parameters
N ( Default: 6 Min: 1 Max: 100 )
N1 ( Default: 6 Min: 1 Max: 100 )
Chart Script
MTM : CLOSE-REF(CLOSE,N);
MTMMA : MA(MTM,N1)
www.edgerater.com
Generalized Bollinger Bands %B And Bandwidth (Tartigradia)Bollinger Band is simply a representation of the rolling average of price and its standard deviation around the average (called the "basis").
This indicator generalizes the Bollinger Band by implementing many different equations to calculate the Bollinger Bands beyond the standard deviation and sma, and then plot the %B (where the current price falls inside the Bollinger Band), Bandwidth (size of the Bollinger Band) as well as the Bollinger Band itself and a reproduction of the OHLC price candles in a separate pane.
Whereas other Bollinger Bands indicators often just change the basis but not the stdev calculation, the correct way to change the basis is to also change it inside the stdev calculation.
Advanced features such as temporal discounting (ie, newer bars can have more weights), median absolute deviation and multiple sigma bands (eg, 3-sigma) are available.
Up to 3 different Bollinger Bands can be displayed, and the background can be highlighted when price is overbought/oversold (beyond the Bollinger Band of choice). Tip: BB3, which is the bollinger band with standard deviation of 3, which represents 99% of observed values in the lookback period, is a good choice to highlight overbought/oversold conditions.
Three "Sentiment Bars" are provided to see at a glance the sentiments on the price action relative to the Bollinger Bands as reflected by the %B value.
Usage:
Use the %B as a measure of sentiment: bullish if > 0.5, bearish if < 0.5. You can use the Sentiment Bars at the bottom for a quick reference: aqua if bullish, red if bearish, gray if undefined (too close to the middle line).
Use the bandwidth as a measure of volatility: higher is more volatile, lower is less.
When overbought, it can be a good time to sell/short. Use a higher Bollinger Band Multiplier such as 3 or more to reduce false positives.
When oversold, it can be a good time to buy/long. Use a higher Bollinger Band Multiplier such as 3 or more to reduce false positives.
Consider setting a much tighter lookback period of 4 as recommended in backtested works (en.wikipedia.org), use zlma instead of sma, and finally set a higher timeframe for the Bollinger Bands than the one you are currently studying. Then, the Bollinger Bands can help in detecting overbought and oversold regions (price going "out of bands").
Note that I tried to automate the setting of a higher timeframe, but for some reason the output is different when I manually do it using request.security() than when it's in indicator(timeframe=""). If someone has any suggestion as to why it happens, please let me know! (You can try it for yourself by uncommenting the auto_timeframe parameter line).

Change of VolatilityOVERVIEW
The Change of Volatility indicator is a technical indicator that gauges the amount of volatility currently present in the market. The purpose of this indicator is to filter out with-trend signals during ranging/non-trending/consolidating conditions.
CONCEPTS
This indicator assists traders in capitalizing on the assumption that trends are more likely to start during periods of high volatility compared to periods of low volatility . This is because high volatility indicates that there are bigger players currently in the market, which is necessary to begin a sustained trending move.
So, to determine whether the current volatility in the market is low, the indicator will grey out all the areas on the chart whose short term standard deviation of volatility is lower than the long term standard deviation of volatility.
If the short term standard deviation of volatility is above the long term standard deviation of volatility, the current volatility in the market is considered high. This would the ideal time to enter a trending trade due to the assumption that trends are more likely to start during these high-volatility periods.
HOW DO I READ THIS INDICATOR
When the histogram is grey, don't take any trend trades since the current volatility is less than the usual volatility experienced in the market.
When the histogram is green, take all valid with-trend trades since the current volatility is greater than the usual volatility experienced in the market.

Q-TrendQ-Trend is an multipurpose indicatorm that can be used for swing- and trend-trading equally on any timeframe (non-volatile markets are better for this thing).
Settings:
Trend period - used to calculate trend line in the special moments(will explain below);
ATR Multiplier - changes sensitivity. The higher the multiplier = the more sensitive it is.
Also option to smooth source data (helps get cleaner signals, as always).
How to use?
Signals are given on the chart. Also ou can use trend line as S/R line.
The idea behind:
Terms:
SRС = Source
TL = trend line;
MP = ATR multiplier;
ATR = ATR :)
TL = (highest of source P-bars back + lowest of source P-bars back) / 2
Epsilon = MP * ATR
I was thinking for a week about combining volatility and relation between highest and lowest price point. That why I called indicator Q-Trend = Quantitative Trend , as I was trying to think about price in a mathematical way.
Okay, time to go philosophical:
1) TL is shows good price trend, but as it is slow enough and not enough informative, we need add additional conditions to produce signals.
2) Okay, so what can we add as conditions? We need to take volatility into account, as it is crucial in the moments of market uncertainty. So let's use ATR (Average True Range) somehow. My idea is that if SRC breaks TL + ATR , then it means that there will be upmove and we update our TL . Analogically for SRC breaking TL - ATR (breaks are crosses of TL +- ATR lines) .
Conclusion:
- if SRC breaks TL + ATR , it is a BUY signal and update of trend line;
- if SRC breaks TL - ATR , it is a SELL signal and update of trend line;
I think that such indicator already exisits on TradingView, as I've already saw something similar, but long ago, so please don't report, if such thing already exists.
But if not, then I hope, that you will gain some profits with Q-Trend :)
I will continue my work on this thing, so stay tuned.
Trade with your own risks and have your profits!
Wish you all the best!
- Tarasenko Fyodor

ATR Trend Run - Signals Alerts SL and TP by Tech Store OnThe script uses several ATR formulas for entering/exiting trades, support/resistance lines to take TP1 (take profit 1) and another ATR formula for TP2 (take profit 2). Everything is fully configurable to your preference, and you can back-test it via TradingView. You can also configure the indicator for signals during US trading sessions (with or without power hour), as well as taking profits/stop-loss session time(s), as well as to close a position at the end of the trading session no matter what. Also, you can turn all of that off, so there are no trading session/end of day limits and each trade will run until it either hits SL, TP1, TP1 > back to entry, TP2. Note: indicator is set to skip consecutive/opposite signals, while you currently have a trade open > if you hit a trend – ride it to the end!
For example: If you will be day trading SPY and you wish to close your positions no matter what right before the market closes (3:45PM ET > 15min before closes): Make sure to checkbox “Intraday – Close Position Before Market Closes” in the strategy/indicator Settings, so that you are alerted soon before the market closes, if you wish to continue holding the position – leave this checkbox unchecked.
SL: SL is set to be slightly above/below the signal candle, which is best suited for this strategy.
Strategy Take Profit Approach
While the initial position open and SL hit is always based on a closed candle bar (can’t do otherwise, as otherwise you will have 10s of fake signal alerts), there are 2 ways on trading this strategy in terms of TP1 and TP1 taken > back to Entry, which is based off Alert type.
You can switch this as you like within the indicator settings, “Checked: TP1 taken > back to Entry per Price Touch | Unchecked: per Candle Close”.
Candle Close vs Price Touch: with the Default method - Candle Close for an alert for TP1 or if price comes back to Entry after TP1 is taken will only be triggered once candle bar fully closes crossing the area, while Price Touch will alert when price touches the area before candle bar closes.
For example: your trade is running well, you grab TP1 and the price reverses and hits your trade Entry area. With Price Touch – you are immediately alerted to close your trade with no loss and with TP1 profit. With Candle Close - you will receive an alert only once candle bar fully closes on top of the Entry crossing it backwards, meaning it may lower your TP1 profit or even completely reverse the trade into loss in case it will be a huge candle bar for any reason. However, it may touch the Entry area, looking like the price is reversing, but then continue per initial trade direction, sometimes becoming a trend. So, while Price Touch seem like a more conservative approach, Candle Close can give you much bigger profits if you catch a trend, but you can always change it via the Settings.
Note: TradingView back-testing engine does not have a feature to open/close orders IMMEDIATELY via Price Touch trigger, but only when the candle closes after price touches the scripted area/line/etc., so you for the most accurate results, test your strategy out via Candle Close setting. Otherwise, decide yourself. I personally like more Candle Close since I can test it out via back-testing with the most accurate results.
TP2 is set per Candle Close as often the ATR trailing stop line will be hit and bounced off, so it’s best to wait until candle actually breaks it/closes through it.
Note: If you will be observing the strategy LIVE, during LIVE candle bar movement – it will look weird, like it’s placing an order after order during any trigger – this seem like a TradingView bug, but is only observational, once the candle bar is closed and you refresh TradingView it will all look correct.
Back-Testing
If you wish to do some back-testing, just modify the strategy/indicator Settings:
-----1) STRATEGY: This is for back-testing/experimenting with the script inputs.
----------a. You can setup a start date (date, month, year) from which it will start opening back-test trades, select a position size and select TP1 size, the idea here is to close half (or whatever you choose) portion of the trade once you hit your TP1, then to either close at small profit or to catch a trend and close the second portion of the position long way ahead from Entry, otherwise it will alert you to close the position at TP2, if price comes back to Entry, at reversal signal or at the end of US trading session if the option for it is checked. If you wish to close the whole position at TP1, just enter the same amount for TP1 to match backtest position size. Otherwise you can experiment with TP1 sizing – try it out!
-----2) Feel free to experiment with ATR settings and with S&R Left/Right bars, you may be amazed how results will differ and find some really cool combinations!
-----3) Make sure you select/de-select “Intraday – Close Position Before Market Closes” setting depending on what you are back-testing and on which conditions
-----4) Note: If you wish to do some deep back-testing (1+ years), use the “Deep Backtesting” feature within Strategy Tester on the TradingView as otherwise it may show wrong results or even fail to compute the results
Add the alerts
-----Right-click anywhere on the TradingView chart
-----Click on Add alert
-----Condition: ATR Trend Run - Signals Alerts SL and TP, by Tech Store On
----------o Right underneath the condition click on the drop-down menu and select “alert() function calls only”
-----Expiration time: Whatever you wish
-----Alert actions: Whatever notifications you wish
-----Alert name: DO NOT TOUCH THIS
-----Hit “Create”
-----Note: If you change ANY Settings within the indicator – you must DELETE the current alert and create a new one per steps above, otherwise it will continue triggering alerts per old Settings!
- Note: If you add the alert while the script is currently “In Position” it will not know that. So either wait when there will be no position open at all or close your position partially if the bot opens it twice bigger or so in case per script the bot will think it is already in position.
Note: Because of the slippage and the order processing time between TradingView, AutoView and the Broker (it’s usually about a second or so), it is suggested to not use a timeframe lower than 1min. The script is working really well with 1M/3M/5M/H1/H4 timeframes per my back-testing, but feel free to explore via Strategy Back-testing what’s best for the instrument you wish to trade.
If you wish to try this out for a week or so – please reach out and I will give you access.

rt maax EMA cross strategythis just sample of our strategies we published with open source, to learning our investor the way of trading and analysis, this strategy just for study and learning
in this strategy we use expontial moving avarage 20 , 50 , 200 and the we build this strategy when the price move up ema 200 and ema 20,50 cross up the 200 ema in this conditions the strargey will open long postion
and the oppisit it is true for short postion in this sitation the price should be under ema 200 and the ema 20 , 50 should cross under 200 ema then the strategy will open the short postion
we try this strategy on forex ,crypto and futures and it give us very good result ,, also we try this postion on multi time frame we find the stragey give us good result on 1 hour time frame .
in the end our advice for you before you use any stratgy you should have the knowledg of the indecators how it is work and also you should have information about the market you trade and the last news for this market beacuse it effect so much on the price moving .
so we hope this strategy give you brefing of the way we work and build our strategy

Relative Bi-Directional Volatility RangeThe basic math behind this Indicator is very similar to the math behind the Relative Strength Index without using a standard deviation as used for the Relative Volatility Index. The Volatility Range is calculated by utilizing the highs and lows. However not in the same way as in the Relative Volatility Index. This approach leads to different values, but the overall result clearly reveals the intrinsic Volatility of the chart, so the user can be aware, when something fundamentally is going on behind the scenes. If the Volatility rises on positive and negative range (-100 to 100) it implies that something fundamental is changing.
An advantage of using this kind of calculation is the possibility of separating the data into positive (buy pressure) and negative (sell pressure) components. The bi-directional character shows a slightly overhang in one of the directions, which can be used to detect a trend. A Moving Average of the users choice shell smoothen the overhang of the Relative Bi-Directional Volatility and show a trend direction. Similar to the math of the Relative Strength Index as standard a Relative Moving Average is preferred. If the Moving Average is in the positive range (0 to 100) it indicates a bullish trend, else if the Moving Average is in the negative range (0 to -100) it indicates a bearish trend. External Indicators can use a provided Trend Shift Signal which switches from 0 to 1, if the trend becomes bullish or from 0 to -1, if the trend becomes bearish.
The user should know, that in this Indicator the starting point of the Moving Averages always begins at the first bar, because the starting progress is approximated appropriately. Most Moving Averages require a minimum number of bars to be calculated, which is chosen with the Moving Average Length. In this cases the length used will be automatically reduced in the background until the number of bars is sufficient to match the chosen length. So if data history is very short, the Indicator can be used never the less as good as possible.
It is feasible to switch the Indicator on a higher timeframe, while staying in a lower timeframe on the chart. This can be useful for making the indication cleaner, if the Moving Average is to choppy and shows too many false signals. On the other hand the benefit of a higher timeframe (or a higher Moving Average Length) is paid with higher latency of the signaling. So the user has to decide what the best setting in his case is.
This Indicator can be used with all kinds of charts. Even charts with percentage or negative values should work fine.
