Disclosure of 'MACD-Total' indicator (MACD-T)hello?
Traders, welcome.
If you "follow", you can always get new information quickly.
Please also click "Like".
Have a good day.
-------------------------------------
A trend indicator has been added to the previously published MACD-Price indicator.
The added MS-Signal indicator is an indicator for viewing the trend and the strength of the trend.
Trading with a trend line is not easy.
Therefore, various MA lines or slanted lines drawn on the chart are used to see the flow of the chart.
Therefore, it is not recommended to trade with the added MS-Signal indicator as support and resistance points.
A trade requires support and resistance points.
To mark support and resistance points, you need a point or section on the horizontal line.
Therefore, it is necessary to utilize the 'Buy/Sell' indicator corresponding to the previously disclosed MACD-Price indicator.
(1W chart)
The long horizontal point of the 'Buy/Sell' indicator serves as support and resistance.
It is possible to check in which section the trend reversal has changed by displaying the MS-Signal indicator.
(1D chart)
A move has emerged to show a reversal of the trend by breaking above the MS-Signal indicator.
Therefore, the MS-Signal indicator is about to change from a downtrend to an uptrend.
I numbered the horizontal line of the 'Buy/Sell' indicator.
The length is different in the order of No. 2 > No. 1 > No. 3.
Since horizontal line 2 is the longest, it indicates that support and resistance play the greatest role.
If you check the support at the first horizontal point, it can be interpreted that there is a high possibility of receiving resistance at the second horizontal point.
However, if you find support at the 2nd horizontal point, you can see that it will go up significantly with 3rd position.
Trading with indicators allows you to make quick choices and decisions.
However, more important than the use of indicators is your own trading strategy.
in other words,
- How much investment will you proceed with the purchase?
- How to proceed with installment purchases
- At what point will the Stop Loss be done?
- How long will the investment period be?
- Is it a long-term investment or a short-term investment?
As listed above, the most important trading strategy for trading should be established.
When conducting a trade, ignoring the above list and thinking about where to buy and where to sell is like sailing in the dark.
We disclose the indicators in the hope that it will become a faster and more objective indicator for trading with the trading strategy you have established.
thank you
------------------------------------------------------------ -----------------------------------------------------
Trend

Artharjan Market AnalysisHi,
I have created Artharjan Market Analysis dashboard to help traders to take complete view of the stocks of a particular sector or a benchmark index and track them simultaneously.
With this indicator dashboard, traders will be able to track 13 scripts simultaneously. This dashboard has following features and will help gain loads of valuable information during intraday as well as positional trading.
Information provided:
1] Traders will be able to track 13 scripts of their choice and get real time Buy/Sell Signals
2] Traders will be able to chose the timeframe of their choice by changing the setting called "Timeframe" OR keep the timeframe as that on the chart by keeping the Timeframe = "Chart".
3] Traders will be able to adjust the thickness of the Moving Averages Plotted on the Chart
4] Traders will be able to select the Table position and Table Text Size.
5] For volume analysis select a separate Lookback period for Daily/Weekly/Monthly timeframes and a separate Lookback period for Intraday timeframe. You may keep both same as per your choice.
6] Plot smoothed RSI (WMA of closing price used as an input for RSI) . Default smoothing used is 5. But if you dont want to use smoothing then set it to 1 and RAW RSI will be plotted.
7] For plotting RSI select a separate Lookback period for Daily/Weekly/Monthly timeframes and a separate Lookback period for Intraday timeframe. You may keep both same as per your choice.
8] For RSI set the Overbought and Oversold Levels of your choice.
9] Similarly user will be able to set its own timeframe for calculating Elders Force Index and Commodity Channel Index, and also set the Overbought and Oversold Levels of your choice.
10] Traders will have a choice to monitor Stock Price with reference to 3 Super Trend indicators based on 3 different parameters of their choice.
11] To calculate the Relative Strength and Moving Average High/Low Bands I have used the lookback period of 55 and used RMA instead of SMA or EMAs since I found that RMAs are more reliable than SMA or EMAs.
12] To measure the relative strength of a Stock w.r.t. a Benchmark Index or a Sectoral Index, user will have to select the RS - Comparative Symbol. This Comparative Symbol (Script) will be used to measure the relative strength of all the 13 scripts.
13] Kindly note that since this Dashboard will monitor 13 scripts simultaneously it will occupy huge space on the chart, hence I have made a provision to select the number of scripts to be shown on the dashboard minimum is 1 and max is 13.
14] With this indicator you will be able to monitor the price action and following indicators.
a) Last Traded Price
b) Price Change (Between Current candle and previous candle of the selected timeframe)
c) Price Change Percentage (Between Current candle and previous candle of the selected timeframe)
d) Volume Change (Between Current candle and previous candle of the selected timeframe)
e) Volume vs. SMA(Volume) with different color shaded ranging from -ve values to 100%, 100% to 200%, 200% to 500% and more than 500%
f) If Price is above VWAP then its a Buy else its a Sell signal
g) Signals based on RSI values and its corresponding relation with Overbought and Oversold Levels -such as Bullish, Bearish, Long Unwinding, Short Covering, Long Buildup, Short Buildup, Neutral levels
h) 3 Supertrend Indicators
i) Central Pivot Range (Calculated on a Daily Timeframe) - If LTP > CPR = Bullish, LTV < CPR = Bearish else Neutral
j) Elders Force Index - If EFI > 0 Buy if EFI < 0 Sell
k) Signals based on CCI values and its corresponding relation with Overbought and Oversold Levels -such as Bullish, Bearish, Long Unwinding, Short Covering, Long Buildup, Short Buildup, Neutral levels
l) Moving Average Envelop of 55 RMA calculated on Highs and Lows. If Low > Upperband = Bullish, if High < Lowerband = Bearish else Neutral
m) Relative Strength (RS). If RS of a Script in comparison to the Comparative Symbol is positive then it will shown in Green else it will be shown in Red color.
Kindly note that for Index scripts have got no volume so all indicators (Volume, SMA(Volume), VWAP and EFI) which require Volume as an Input parameter will be shown in Gray color because there is no volume data available to calculate these Indicator values and determine whether the Index is in Bullish Territory or in Bearish territory.
I hope you would enjoy using this indicator and it will act as a light house in your trading journey.
Warm regards
Rahul Desai
@Artharjan

Trend Trigger Factor w/ Discontinued Signal Lines [Loxx]Trend Trigger Factor w/ Discontinued Signal Lines is a Trend Trigger Factor indicator with floating boundary lines to identify trends earlier
What is the Trend Trigger Factor?
Designed by M.H. Pee, the Trend Trigger Factors role is to help traders detect uptrends and downtrends and thus allow them to better position themselves in a with-trend manner. Its creator argues that the markets are mostly random but have a small trend component, which is the most crucial part of trading success. Being able to determine whether the market is in a bull or bear trend and how strong that trend is will allow you to be on the right side of the market for longer, capitalizing as much as possible on its trending behavior.
In his article, M.H. Pee used a 15-period trackback span to explain the calculations. The TTF formula is based on the so-called Buy Power and Sell Power. In his example, Pee labeled today as day 1, yesterday as day 2, the preceding day as day 3 and so on
What's new in this indicator?
Averages filter out prices prior to being used in calculation. That way the lag added is smaller than when the smoothing is used on the calculated result.
Unlike the original which uses levels +100 and -100 as significant levels for signal triggering, this version is using discontinued signal lines for trend filtering. That way it makes it a bit more responsive to market conditions
How do I use this?
The Trend Trigger Factor is similar in interpretation to the Relative Strength Index. It is plotted on a scale with most prominent levels at +100 and -100, crosses of which logically signal possible trade entries. The difference here, however, is that the upper and lower boundary flex with price movements so the upper and lower boundary shift dynamically. Crosses above the top line signify bullish sentiment, crossed below the the bottom line signify bearish sentiment.
Trend LinesHello Everyone.
This is my first script on TV, hope you find it useful.
How it works?
- On each bar it finds last x (depending on your settings) higher and lower Pivot Points ( PP ).
- It searches for possible trend line from oldest PP to newest, once found it stops and draws the line.
- The higher the time frame the lower the number of PP needed. Play around with the number of PP and left/right bars needed to confirm a PP and you get different results.
For suggestions don't hesitate to contact me
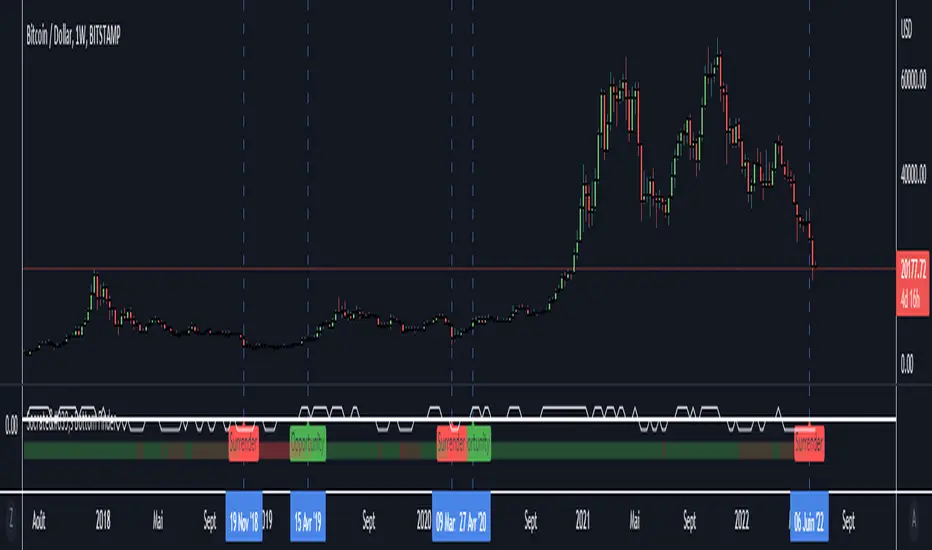
Socrate's Bottom FinderENGLISH :
Hi everybody,
This indicator will give you the market bottoms with remarkable accuracy.
/!\ Be aware that the indicator cannot know the current economic situation and that in the event of a major crisis, it can signal a market bottom despite the decline not being over. /!\
How to read it ?
It is composed of two visual sections:
- The first section materialized by the white line is a "treshhold" which gives the current trend of the week. It is used to filter most of the "fake signals"
- The second section, materialized by a green and red band, gives the strength of the price trend. If for example the trend is rather bullish, this bar will turn green, the opposit will produce red. An "opportunity" signal will appear when the optimal conditions are met to define a market bottom. Before an opportunity signal there will always be an "Surrender" signal, wich means the trend has weakened and the bottom is near in time.
Special Recommandation :
- The best results are on 1W, 3D, 1D. The indicator work on lower TF but it's not his purpose and you may drop significantly your W/L rate.
- Avoid stocks/crypto with poor stability in the very long time, a good hint is to look after thoses who mostly are above SMA200 on weekly TF.
- Avoid cyclical stock, as they tend to bounce up and down way to often.
Please do your own diligence. Trading may conduct you to loose capital.
Apply your own trading strategy :)
-----------------------------------------------------------------------------------------------------------------------------
FRANCAIS :
Salut tout le monde,
Cet indicateur vous donnera les creux du marché avec une précision remarquable.
/!\ Sachez que l'indicateur ne peut pas connaître la situation économique actuelle et qu'en cas de crise majeure, il peut signaler un creux de marché même si la baisse n'est pas terminée. /!\
Comment le lire ?
Il est composé de deux sections visuelles :
- La première section matérialisée par la ligne blanche est un « seuil » qui donne la tendance actuelle de la semaine. Il est utilisé pour filtrer la plupart des "faux signaux"
- La deuxième section, matérialisée par une bande verte et rouge, donne la force de la tendance des prix. Si par exemple la tendance est plutôt haussière, cette barre deviendra verte, l'inverse produira du rouge. Un signal "d'opportunité" apparaîtra lorsque les conditions optimales seront réunies pour définir un creux de marché. Avant un signal d'opportunité, il y aura toujours un signal "Abandon", ce qui signifie que la tendance s'est affaiblie et que le creux est proche dans le temps.
Recommandations spéciales :
- Les meilleurs résultats sont sur 1W, 3D, 1D. L'indicateur fonctionne sur des TF plus faibles mais ce n'est pas son but et vous risquez de faire chuter considérablement votre ratio de W/L.
- Évitez les stocks/crypto avec une faible stabilité sur le long terme, un bon indice est de cibler ceux qui sont majoritairement (dans leur historique) au-dessus de leur SMA200 en TF hebdomadaire.
- Prioriser les actifs de type "HyperGrowth", l'indicateur fonctionne moins bien avec les cycliques
Veuillez faire vos propres recherches en parallèle. Le trading pouvant vous conduire à perdre du capital.
Appliquez à cet indicateur votre propre stratégie :)
Easy TrendCurrent script displays trend channel, which makes it easy to see reversal signals
Note:
- If price goes above the channel it might be an early sell signal
- If price falls from channel it might be a sell signal, better to enter position on retest
Plan for future development:
- Alerts
- Trend angle

dize Multi-Timeframe TrendHi Trader,
the "Multi-Timeframe Trend" indicator is one part of our holistic approach to identifying trading setups. It is one of many indcators of our dize indicator package and should always be used in conjunction with the other dize indicators.
💡 What is the MTF Trend indicator?
Our "Multi-Timeframe Trend" indicator allows to view the trend on different timeframes. The multi-timeframe approach helps us to filter out noise from the market and to find the overarching trend. In addition to the trend, the indicator also shows the percentage change for each up and down movement, which is an expression of the trend strength. We use a proprietary approach to identifying turning points, which will be used for trend recognition.
Furthermore, we connect the most recent dominating highs and lows to create two trendlines at the most right side of the chart.
💡 How to use it?
Using the "Multi-Timeframe Trend" indicator is pretty straight forward. After applying it to your chart you will have to adjust the "Resolution" parameter in the settings. Please be aware, that the selected resolution should always be higher than the displayed chart timeframe. Once that is done, the indicator will show the up- and downmovements of the higher timeframe on your chart.
To fine-tune the trendlines, you should first activate the "Show Trendlines" checkbox. After that we will use the "Trendlines Depth" parameter to detect the most optimal trendlines out of the latest "n" up and down turning points.
Let's have a look:
In the above example you can see a daily Bitcoin chart with a weekly MTF Trend configuration. Initially it shows an uptrend. You will notice how the up- and downswing percentages change over time and move into favor of the bears. The red numbers (downmovement) increase, while the green number (upmovement) decrease. It's easy to identify the sentiment shift. Lastly, the indicator shows two trendlines, which both indicate the current direction of the market.
🔓 To gain access to this indicator, please read the signature field.

dize Market SentimentHi Trader,
the "Market Sentiment" indicator is one part of our holistic approach to identifying trading setups. It is one of many indcators of our dize indicator package and should always be used in conjunction with the other dize indicators.
💡 What is the Market Sentiment indicator?
The Market Sentiment indicator is a trend-following indicator. It visually divides our chart into three phases that are familiar to every trader - uptrend, downtrend and sideways movement. The visualization allows us to determine very quickly which phase is currently active. The indicator generates buy and sell signals for trend changes, which can be precisely matched to the asset using various filters.
💡 How to use it?
The "Lookback"-parameter indicates how many candlesticks are considered for trend development. The "Sensitivity" parameter indicates how much noise we allow in the trend calculation.
In addition to changing the technical details, the indicator also includes input settings for the visual appearance. Colors for the three sentiment phases, as well as colors for the buy and sell labels can be set, making it easy to customize the indicator to suit your personal preferences.
Let's have a look:
Looking at the above example, we can clearly see how the market sentiment indicator could be beneficial to our trading. It created a "Buy" signal on the 10th October 2020 at 11297.0 USD, moving all the way up to 55705.5 USD on 19th April 2021, where it generated a "Sell" and then dropping back down to 35392.0 USD on the 25th July 2021 to create another "Buy".
Of course, the indicator should not be used as a standalone buy and sell signal generator. It has to be used wisely in conjunction with other indicators and potential risk management tools. But this example shows how the indicator can bring value to your chart.
🔓 To gain access to this indicator, please read the signature field.

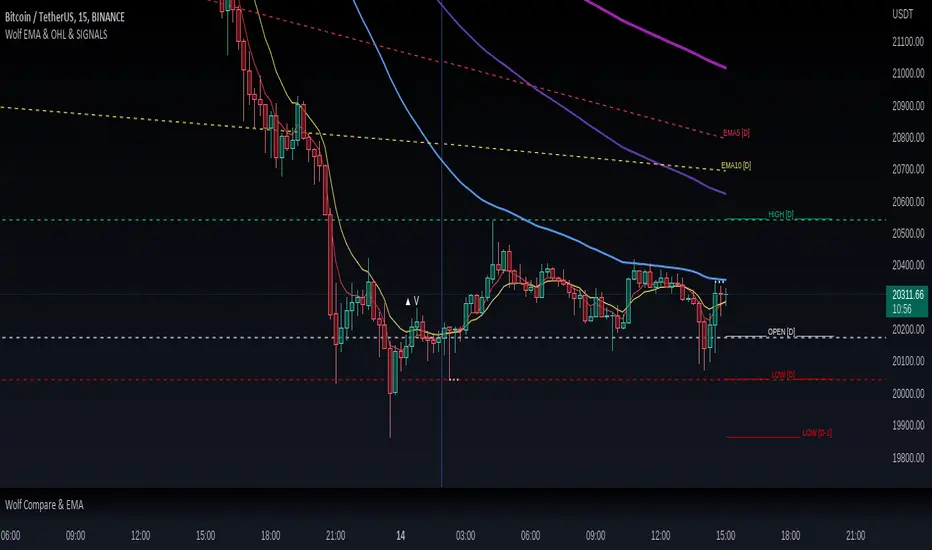
Wolf EMA & OHL & SIGNALSWolf EMA & OHL & SIGNALS
this indicator is mainly used for fast trading techniques (scalping). provides various tools for comprehensive trend analysis.
5 EMAs are used to have possible market entry or exit signals.
EMA
Thanks to the combination of the EMAs of different timeframes,
you can immediately get an idea of the resistances or supports
of the higher timeframes.
HOL
Lines are drawn on the right side indicating the maximum, minimum and opening
of the day, past day, week and past week respectively.
These levels are excellent as price acceleration points.
SIGNALS
There are three types of signals that are monitored by this indicator:
- Shimano
This signal is generated if the price remains compressed between two EMAs, more precisely between the third and the fifth, at the point where the price breaks one of these EMAs there can be a strong price movement.
- Viagra
This signal is generated if the price remains below the second EMA for a long time without ever closing above / below, at the point where it closes by climbing over the EMA there may be a change in trend.
-Bud
This signal is generated if a positive candle is formed and subsequently at least two that close within the high and low of the positive candle. Where the price breaks through the high of the positive candle is a great entry point.
BTC Active Address Trend (On-chain)This indicator compares the % change in BTC price and the % change in BTC’s active addresses (BTC’s utility value).
1. % changes in BTC price & active addresses
- Orange line: BTC’s price change (%)
- Gray line: BTC’s active address change (%)
- Red/Yellow/Green lines: Bollinger bands for change in active address
2. Trend:
- Green circles: Bullish Sentiment Trend
Market sentiment is bullish and BTC price outgrows the increase in its utility value (overpricing)
- Red circles: Bearish Sentiment Trend
Market sentiment is bearish and BTC price drops more than the decrease in its utility value (underpricing)
3. Potential Re-Entries:
- Green/Red triangles: potential bullish/bearish entries
When % change of BTC price gets similar to that of active addresses
*Not financial advice.

RAVI FX Fisher [Loxx]RAVI FX Fisher is a special implementation of RAVI using WMA moving averages and ATR and then normalized like Fisher Transform. If the histogram falls between the white lines, the market is too choppy to trade. This indicator is tuned for Forex.
What is RAVI?
The Range Action Verification Index (RAVI) indicator shows the percentage difference between current prices and past prices to identify market trends. It is calculated based on moving averages of different lengths.
Included:
-Change bar colors
Adaptive, Jurik-Smoothed, Trend Continuation Factor [Loxx]Adaptive, Jurik-Smoothed, Trend Continuation Factor is a Trend Continuation Factor indicator with adaptive length and volatility inputs
What is the Trend Continuation Factor?
The Trend Continuation Factor (TCF) identifies the trend and its direction. TCF was introduced by M. H. Pee. Positive values of either the Positive Trend Continuation Factor (TCF+) and the Negative Trend Continuation Factor (TCF-) indicate the presence of a strong trend.
What is the Jurik Moving Average?
Have you noticed how moving averages add some lag (delay) to your signals? ... especially when price gaps up or down in a big move, and you are waiting for your moving average to catch up? Wait no more! JMA eliminates this problem forever and gives you the best of both worlds: low lag and smooth lines.
Ideally, you would like a filtered signal to be both smooth and lag-free. Lag causes delays in your trades, and increasing lag in your indicators typically result in lower profits. In other words, late comers get what's left on the table after the feast has already begun.
That's why investors, banks and institutions worldwide ask for the Jurik Research Moving Average ( JMA ). You may apply it just as you would any other popular moving average. However, JMA's improved timing and smoothness will astound you.
What is adaptive Jurik volatility?
One of the lesser known qualities of Juirk smoothing is that the Jurik smoothing process is adaptive. "Jurik Volty" (a sort of market volatility ) is what makes Jurik smoothing adaptive. The Jurik Volty calculation can be used as both a standalone indicator and to smooth other indicators that you wish to make adaptive.
What is an adaptive cycle, and what is Ehlers Autocorrelation Periodogram Algorithm?
From his Ehlers' book Cycle Analytics for Traders Advanced Technical Trading Concepts by John F. Ehlers , 2013, page 135:
"Adaptive filters can have several different meanings. For example, Perry Kaufman’s adaptive moving average ( KAMA ) and Tushar Chande’s variable index dynamic average ( VIDYA ) adapt to changes in volatility . By definition, these filters are reactive to price changes, and therefore they close the barn door after the horse is gone.The adaptive filters discussed in this chapter are the familiar Stochastic , relative strength index ( RSI ), commodity channel index ( CCI ), and band-pass filter.The key parameter in each case is the look-back period used to calculate the indicator. This look-back period is commonly a fixed value. However, since the measured cycle period is changing, it makes sense to adapt these indicators to the measured cycle period. When tradable market cycles are observed, they tend to persist for a short while.Therefore, by tuning the indicators to the measure cycle period they are optimized for current conditions and can even have predictive characteristics.
The dominant cycle period is measured using the Autocorrelation Periodogram Algorithm. That dominant cycle dynamically sets the look-back period for the indicators. I employ my own streamlined computation for the indicators that provide smoother and easier to interpret outputs than traditional methods. Further, the indicator codes have been modified to remove the effects of spectral dilation.This basically creates a whole new set of indicators for your trading arsenal."
Included
-Your choice of length input calculation, either fixed or adaptive cycle
-Bar coloring to paint the trend
Happy trading!

Rate Of Change Trend Strategy (ROC)This is very simple trend following or momentum strategy. If the price change over the past number of bars is positive, we buy. If the price change over the past number of bars is negative, we sell. This is surprisingly robust, simple, and effective especially on trendy markets such as cryptos.
Works for many markets such as:
INDEX:BTCUSD
INDEX:ETHUSD
SP:SPX
NASDAQ:NDX
NASDAQ:TSLA

On Balance Volume Trend© 2022, CryptoNaut1000
An extension to "On Balance Volume Momentum (OBV Momentum)".
"OBV Trend" is a trend strength indicator, that can be used to identify strong trends and also trend changes based on volume.
High positive values indicate strong volume on the buy side, high negative values indicate strong volume on the sell side.
An increasing OBV trend indicates a strengthening buy trend or a weakening sell trend,
decreasing OBV trend indicates a strengthening sell trend or weakening buy trend.
OBV trend is calculated by plotting a short vs. a long moving average and filling the difference in volume.
OBV trend metric is absolute volume.

Trend IdentifierTrend Identifier for 1D BTC.USD
It smoothens a closely following moving average into a polynomial like plot.
And assumes 4 stage cycles based on the first and second derivatives.
Green: Bull / Exponential Rise
Yellow: Distribution
Red: Bear / Exponential Drop
Blue: Accumulation
Red --> Blue --> Green: indicates the start of a bull market
Green --> Yellow --> Red: indicates the start of a bear market
Green --> Yellow: Start of a distribution phase, take profits
Red --> Blue: Start of a accumulation phase, DCA

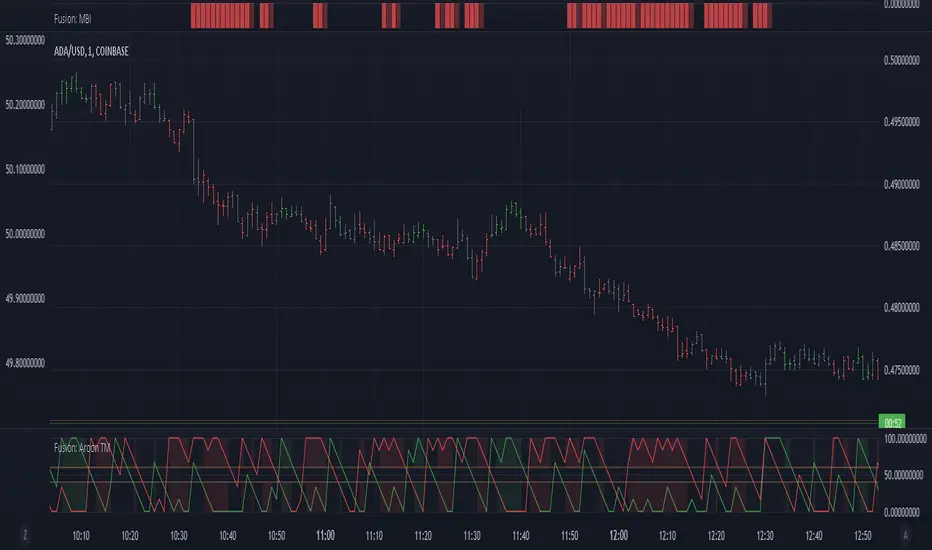
Fusion: Aroon trend matching with dual thresholdsYou set an upper and lower threshold and when both are met a direction is determined.
I use this primarily as a confirmation indicator of a trend.
The addition to the normal Aroon is simply the threshold settings and the visuals. There is even an option to see the length you are using which I find useful when the length is long, say 40+ so you don't forget that it's considerably longer than how it's normally used.
Additionally it defaults to the normal colors we are familar with for up and down (long/short) but you can choose Aroon colors if you wish with just a checkbox.
The length is certainly not optimized so set to whatever suits your needs. The Aroon default is 14, I used 6 for one particular case so that's what it ended up being for this indicator.
I default to a dark theme so if you are using a light theme you may need to change some brightness settings.
Finally, if you find value please do make a comment, give a thumbs up etc.
Enjoy and good luck!
Bozz Strategy
Booz Backtesting : Booz Backtesting is a method for analyzing the performance of your current trading strategy . Booz Backtesting aims to help you generate results and evaluate risk and return without risking real capital.
The Booz Backtesting is the Booz Super Swing Indicator equivalent but gives you the ability to backtest data on different charts.
This is an Indicator created for the purpose of identifying trends in Multiple Markets, it is based on Moving Average Crossover and extra features.
Swing Trading: This function allows you to navigate the entire trend until it is not strong enough, so you can compare it with fixed parameters such as Take Profit and Stop Loss.
Take Profit and Stop Loss function: With this function you will be able to choose the most optimal parameters and see in real time the results in order to choose the best combination of parameters.
Leverage : We have this function for the futures markets where you can check which is the most appropriate leverage for your operation.
Trend Filter: allows you to take multiple entries in the same direction of the market.
If the market crosses below the 200 moving average, it will take only short entries.
If the market crosses above the 200 moving average, it will take only long entries.
Timeframes
Charting from 1 Hour, 4 Hour, Daily, Weekly, Weekly
Markets :Booz Backtesting can be tested in Cryptocurrency, Stocks and Futures markets.
Background Color : at a glance, you can see what cycle the market is in.
Green background : Shows that the market is in a bullish cycle.
Red background: Shows that the market is in a bearish cycle.
Twitter
Website

FiboBars ExtendedA trend indicator FiboBars Extended , the main purpose of which is to confirm the trend and cut off market noise. In his logic, he uses the Fibonacci sequence.
Two settings are used to account for noise suppression accuracy:
Period - number of calculation bars
Level - Fibonacci number selection

Distance From Moving AverageThis indicator shows the distance between the current price and the Moving Average price.
Key Features:
Show the distance between price and Moving Average (Read Distance Calculation for more information)
Show Historic Highs and Lows
Show Highest High and Lowest Low
Show current Highest High, current Lowest Low and current distance
Key Indicator Settings:
1. Distance Calculation
There are two ways to calculate the distance:
Spread - Calculate the difference between the price and the moving average
Percentage - Calculate the percentage change between the price and the moving average
2. Moving Average Types
There are 5 different Moving Averages:
EMA
SMA
WMA
VWMA
HMA
3. Highest High and Lowest Low
You can show or hide the Highest High and the Lowest Low plots of the series
4. Historic Highs and Lows
You can show or hide past Highs and Lows of the series
Lookback Length - Let's you adjust the frequency of local highs and lows of the series
5. Current Values
You can show or hide current value labels

COSMO TREND👉 What is this indicator ?
This indicator is made up with the help of Multiple SuperTrend and Price Action , In this awesome indicator, The buy and sell entry is taken by comparing the trend using our secret logic.
👉 What is special about this indicator ?
More than Ten Takeprofit price points can be seen in this indicator , The Stoploss price point can be seen as well . You can simply adjust take profit percentage and stop loss percentage in indicator settings
👉 What kind of Take Profit signal is there on this indicator ?
Ten types of take profit signals are displayed on this indicator, each marked as TP1,TP2,TP3,TP4,TP5,TP6,TP7,TP8,TP9 and TP10 respectively. The take profit signals available for both buy and sell entries. The take profit of the buy entry is shown in Green Color and the take profit of the sell entry is shown in Red Color.
👉 What kind of Exit signal is there on this indicator ?
Exit signals can be seen at the end of the trend
👉 How many alarms does this indicator have ?
This indicator has 13 types of alarm for Buy , Sell , Take Profit and Exit signal, and it is best to set the alarm by selecting the Alert Once Bar Close option to avoid repaint.
👉 On which coins can this indicator be used ?
This indicator is best used on all cryptocurrencies, forex markets and stocks , This indicator is very helpful to get high returns on all cryptocurrencies with low price and high voltality
Note : This indicator only works well in all time frames ( 1s,5s,10s,1m,5m,1h etc...) , Use appropriate values when using other coins. If you have difficulty finding the value, you can contact us.
Default Setup Instructions 👇
Time Frame : 1 Minute
Default Coin : C98USDT
The following settings can be found in this indicator
You can simply adjust take profit percentage and stoploss percentage in indicator settings
Orgin Factor : This is the ATR Factor Value for High Time Frame trend. You can change this value according to the volatility , the ATR Factor value is also used to reduce the chance of a fake signal
Mid Factor : This is the ATR Factor Value for Low Time Frame trend. You can change this value according to the volatility , the ATR Factor value is also used to reduce the chance of a fake signal
Low Factor : This is the ATR Factor Value for Second Low Time Frame trend.
Take Profit - TP1 Percentage : Give What percentage for take First TP
Take Profit - TP2 Percentage : Give What percentage for take Second TP
Take Profit - TP3 Percentage : Give What percentage for take Third TP
Take Profit - TP4 Percentage : Give What percentage for take Fourth TP
Take Profit - TP4 Percentage : Give What percentage for take Fifth TP
Take Profit - TP4 Percentage : Give What percentage for take Sixth TP
Take Profit - TP4 Percentage : Give What percentage for take Seventh TP
Take Profit - TP4 Percentage : Give What percentage for take Eighth TP
Take Profit - TP4 Percentage : Give What percentage for take Nineth TP
Take Profit - TP4 Percentage : Give What percentage for take Tenth TP

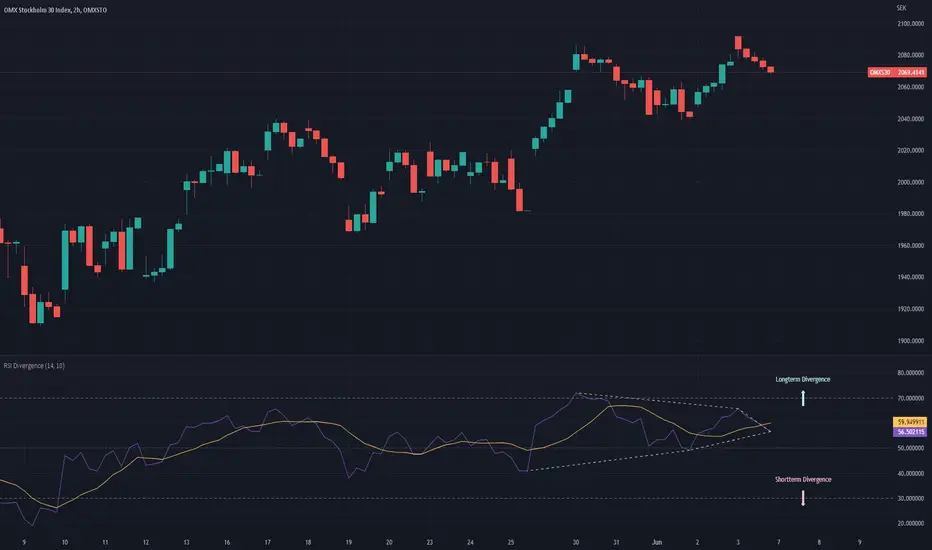
RSI DivergenceThe RSI DIvergence script tries to predict the upper and lower trend-lines for the current security’s RSI.
The script identifies peaks and valleys within the RSI and then tries to draw a trend-line in between the peaks and the valleys. The longest possible trend-line originating from the latest peak/valley will be used to determine whether or not the trend is moving up or down, the slope of the trend-line will then dictate the direction of the trend.
(If no trend line can be drawn from the latest peak/valley, the current value of the RSI will be used as the origin point of the trend-line)
Once the script has identified the trendlines they will be superimposed on the RSI line as dashed lines. The color of the dashed lines will depend on the direction of the trend, an upwards moving trend will be depicted in green,whilst a downwards moving trend will be depicted in red.
Furthermore, the script will draw two arrows, representing the short term trend and the long term trend, as to make it even more clear which direction the two trend-lines have.
If only one trend-line (either upper or lower) can be found, the script will replace the corresponding arrow with a diamond shape instead.
Stacked EMAsStacked Daily & Weekly EMAs + Labels
Pretty much self-explanatory indicator that shows the current momentum based on the key exponential moving averages.
Three stages of the EMAs:
1. Stacked Positively (Bullish) - EMAs are stacked on top of each other which represents a healthy bullish uptrend (green Label).
2. Stacked Negatively (Bearish) - EMAs are stacked below each other meaning the trend is bearish (red label).
3. Stacked Neutral (Neutral) - EMAs are crossing each other without any clear direction = chop (yellow label).
Hope it helps.

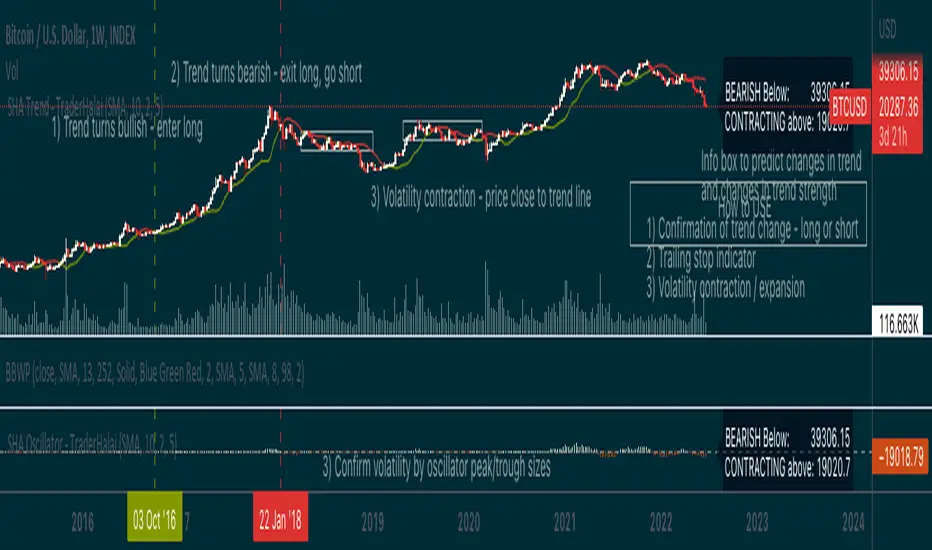
Smoothed Heikin Ashi Trend on Chart - TraderHalaiThis indicator is a predictive tool using Heikinashi to calculate shifts in trade direction.
It works by reverse-engineering the regular candle stick closing price required, to flip the Heiken Ashi candle from Red to Green and vice-versa.
Below, is an earlier indicator that I released and created. This plots this price as an oscillator, which allows traders to get a predictive indicator of a trend change.
This indicator extends upon this functionality by adding a smoothing function to the reverse-engineered regular candle stick closing price, to reduce the choppiness of signals. It also plots the indicator on the chart to allow for easier visual confirmation.
How to use
1) As a directional bias - Bullish or bearish
2) Volatility expansion/contraction - further distance from line means volatility expansion - am planning to release an oscillator version also
3) Trailing stop loss - once you are in a trade
Other Features
Select a moving average period and smoothing calculation method (e.g. SMA / EMA)
Non-repaint mode for backtesting and use/integration with higher timeframes
Final note - Open Source
I am releasing this as open-source for the benefit of the community and to allow further development, scrutiny and criticism. Please feel free to use this indicator as you see fit. If you do use this indicator to create another script, feel free to drop me a note, as I would be highly interested in your idea.
Thanks, and Enjoy!