Forexsom MA Crossover SignalsA Trend-Following Trading Indicator for TradingView
Overview
This indicator plots two moving averages (MA) on your chart and generates visual signals when they cross, helping traders identify potential trend reversals. It is designed to be simple yet effective for both beginners and experienced traders.
Key Features
✅ Dual Moving Averages – Plots a Fast MA (default: 9-period) and a Slow MA (default: 21-period)
✅ Customizable MA Types – Choose between EMA (Exponential Moving Average) or SMA (Simple Moving Average)
✅ Clear Buy/Sell Signals – Displays "BUY" (green label) when the Fast MA crosses above the Slow MA and "SELL" (red label) when it crosses below
✅ Alerts – Get notified when new signals appear (compatible with TradingView alerts)
✅ Clean Visuals – Easy-to-read moving averages with adjustable colors
How It Works
Bullish Signal (BUY) → Fast MA crosses above Slow MA (suggests uptrend)
Bearish Signal (SELL) → Fast MA crosses below Slow MA (suggests downtrend)
Best Used For
✔ Trend-following strategies (swing trading, day trading)
✔ Confirming trend reversals
✔ Filtering trade entries in combination with other indicators
Customization Options
Adjust Fast & Slow MA lengths
Switch between EMA or SMA for smoother or more responsive signals
Why Use This Indicator?
Simple & Effective – No clutter, just clear signals
Works on All Timeframes – From scalping (1M, 5M) to long-term trading (4H, Daily)
Alerts for Real-Time Trading – Never miss a signal
Trendtrading

Trendline Breaks with Multi Fibonacci Supertrend StrategyTMFS Strategy: Advanced Trendline Breakouts with Multi-Fibonacci Supertrend
Elevate your algorithmic trading with institutional-grade signal confluence
Strategy Genesis & Evolution
This advanced trading system represents the culmination of a personal research journey, evolving from my custom " Multi Fibonacci Supertrend with Signals " indicator into a comprehensive trading strategy. Built upon the exceptional trendline detection methodology pioneered by LuxAlgo in their " Trendlines with Breaks " indicator, I've engineered a systematic framework that integrates multiple technical factors into a cohesive trading system.
Core Fibonacci Principles
At the heart of this strategy lies the Fibonacci sequence application to volatility measurement:
// Fibonacci-based factors for multiple Supertrend calculations
factor1 = input.float(0.618, 'Factor 1 (Weak/Fibonacci)', minval = 0.01, step = 0.01)
factor2 = input.float(1.618, 'Factor 2 (Medium/Golden Ratio)', minval = 0.01, step = 0.01)
factor3 = input.float(2.618, 'Factor 3 (Strong/Extended Fib)', minval = 0.01, step = 0.01)
These precise Fibonacci ratios create a dynamic volatility envelope that adapts to changing market conditions while maintaining mathematical harmony with natural price movements.
Dynamic Trendline Detection
The strategy incorporates LuxAlgo's pioneering approach to trendline detection:
// Pivotal swing detection (inspired by LuxAlgo)
pivot_high = ta.pivothigh(swing_length, swing_length)
pivot_low = ta.pivotlow(swing_length, swing_length)
// Dynamic slope calculation using ATR
slope = atr_value / swing_length * atr_multiplier
// Update trendlines based on pivot detection
if bool(pivot_high)
upper_slope := slope
upper_trendline := pivot_high
else
upper_trendline := nz(upper_trendline) - nz(upper_slope)
This adaptive trendline approach automatically identifies key structural market boundaries, adjusting in real-time to evolving chart patterns.
Breakout State Management
The strategy implements sophisticated state tracking for breakout detection:
// Track breakouts with state variables
var int upper_breakout_state = 0
var int lower_breakout_state = 0
// Update breakout state when price crosses trendlines
upper_breakout_state := bool(pivot_high) ? 0 : close > upper_trendline ? 1 : upper_breakout_state
lower_breakout_state := bool(pivot_low) ? 0 : close < lower_trendline ? 1 : lower_breakout_state
// Detect new breakouts (state transitions)
bool new_upper_breakout = upper_breakout_state > upper_breakout_state
bool new_lower_breakout = lower_breakout_state > lower_breakout_state
This state-based approach enables precise identification of the exact moment when price breaks through a significant trendline.
Multi-Factor Signal Confluence
Entry signals require confirmation from multiple technical factors:
// Define entry conditions with multi-factor confluence
long_entry_condition = enable_long_positions and
upper_breakout_state > upper_breakout_state and // New trendline breakout
di_plus > di_minus and // Bullish DMI confirmation
close > smoothed_trend // Price above Supertrend envelope
// Execute trades only with full confirmation
if long_entry_condition
strategy.entry('L', strategy.long, comment = "LONG")
This strict requirement for confluence significantly reduces false signals and improves the quality of trade entries.
Advanced Risk Management
The strategy includes sophisticated risk controls with multiple methodologies:
// Calculate stop loss based on selected method
get_long_stop_loss_price(base_price) =>
switch stop_loss_method
'PERC' => base_price * (1 - long_stop_loss_percent)
'ATR' => base_price - long_stop_loss_atr_multiplier * entry_atr
'RR' => base_price - (get_long_take_profit_price() - base_price) / long_risk_reward_ratio
=> na
// Implement trailing functionality
strategy.exit(
id = 'Long Take Profit / Stop Loss',
from_entry = 'L',
qty_percent = take_profit_quantity_percent,
limit = trailing_take_profit_enabled ? na : long_take_profit_price,
stop = long_stop_loss_price,
trail_price = trailing_take_profit_enabled ? long_take_profit_price : na,
trail_offset = trailing_take_profit_enabled ? long_trailing_tp_step_ticks : na,
comment = "TP/SL Triggered"
)
This flexible approach adapts to varying market conditions while providing comprehensive downside protection.
Performance Characteristics
Rigorous backtesting demonstrates exceptional capital appreciation potential with impressive risk-adjusted metrics:
Remarkable total return profile (1,517%+)
Strong Sortino ratio (3.691) indicating superior downside risk control
Profit factor of 1.924 across all trades (2.153 for long positions)
Win rate exceeding 35% with balanced distribution across varied market conditions
Institutional Considerations
The strategy architecture addresses execution complexities faced by institutional participants with temporal filtering and date-range capabilities:
// Time Filter settings with flexible timezone support
import jason5480/time_filters/5 as time_filter
src_timezone = input.string(defval = 'Exchange', title = 'Source Timezone')
dst_timezone = input.string(defval = 'Exchange', title = 'Destination Timezone')
// Date range filtering for precise execution windows
use_from_date = input.bool(defval = true, title = 'Enable Start Date')
from_date = input.time(defval = timestamp('01 Jan 2022 00:00'), title = 'Start Date')
// Validate trading permission based on temporal constraints
date_filter_approved = time_filter.is_in_date_range(
use_from_date, from_date, use_to_date, to_date, src_timezone, dst_timezone
)
These capabilities enable precise execution timing and market session optimization critical for larger market participants.
Acknowledgments
Special thanks to LuxAlgo for the pioneering work on trendline detection and breakout identification that inspired elements of this strategy. Their innovative approach to technical analysis provided a valuable foundation upon which I could build my Fibonacci-based methodology.
This strategy is shared under the same Attribution-NonCommercial-ShareAlike 4.0 International (CC BY-NC-SA 4.0) license as LuxAlgo's original work.
Past performance is not indicative of future results. Conduct thorough analysis before implementing any algorithmic strategy.

Original Gann Swing Chart Rules [AlgoFuego]🔵 Original Gann Swing Chart Rules
An advanced indicator built on W.D. Gann’s original rules, enhanced with innovative mechanical trend-following methods.
🔹 Description
This indicator functions by balancing short-term adaptability with long-term trend analysis.
The indicator incorporates Gann’s principles alongside mechanical trend-following techniques to offer a structured method for analyzing trends and detecting potential market reversals.
Golden Rule: Non-trend bars are excluded from analysis, and each new bar is compared with the previous trend bar, it highlights significant swing points with greater clarity.
🔸 The core concept behind the golden rule on which this indicator is built.
The person watching the tide coming, wanting to pinpoint the exact spot that signals the high tide, places a stick in the sand at the points where the incoming waves reach until the stick reaches a position where the waves no longer rise, and eventually recedes enough to show that the tide has shifted.
This method is effective for monitoring and identifying tides and floods in the stock market.
🔸Rule 1: The trend bar is everything.
→It is a bar that forms a new high, low, or both.
🔸Rule 2: The professional traders track new highs and lows.
🔸Rule 3: The hidden bar is nothing.
→It is a bar that does not form a new high, low, or both.
🔸Rule 4: The sea has a wavy nature, and the market as well.
🔸Rule 5: The slope is the immediate direction of the swing.
Downward slope
→The downslope is the descending slope of a swing, shows a decline, reflecting a bearish price trend.
Upward slope
→The upslope is the ascending slope of a swing, shows an incline, reflecting a bullish price trend.
🔸Rule 6: The start and end of the movement are the swing points.
→The lowest or highest price of the last bar in the direction of the slope represents the swing point after the slopes direction changes.
Valley
→It is the lowest price of the last bar in a downslope before the market turns to a upslope.
End=> Downward slope and Start=> Upward slope
Peak
→It is the highest price of the last bar in a upslope before the market turns to an downslope.
End=> Upward slope and Start=> Downward slope
🔸Rule 7: The Golden Rule: Ignore all no-trend bars and compare the new bar with the previous trend bar.
→Applying the golden rule in upward slope
→Applying the golden rule in downward slope
🔸 Related content: Personal words of W.D Gann from the book Wall Street Stock Selector.
→"This was only one month's reaction the same as March 1925. The market held in a dull narrow range for about 2 months while accumulation was taking place and in June the main trend turned up again."
→The beginning of the main trend and the formation of the Valley.
→The beginning of the main trend and the formation of the Peak.
🔸 Rule 8: The Closing Price of the Bar to Understand Movement Direction.
Sequence is important
→ Downward bar
→ Upward bar
🔸 Outside Bar Rules
→Explanation of rules and calculations.
🔸 How does a trend start?
Upward trend
Trend change from Downward to Upward.
Prices must take out the nearest 'Peak' and the Trend was previously Downward.
A breakout above the previous peak signals a bullish reversal.
→ Model 1 - Dropping Valley Reversal
The market forms a dropping valley, followed by a breakout above the previous peak.
→ Model 2 - Equal Valley Reversal
The market forms an equal valley, followed by a breakout above the previous peak.
→ Model 3 - Rising Valley Reversal
The market forms a rising valley, followed by a breakout above the previous peak.
Downward trend
Trend change from Upward to Downward.
Prices must take out the nearest ‘Valley' and the Trend was previously Upward.
A breakdown below the previous valley signals a bearish reversal.
→ Model 1 - Rising Peak Reversal
The market forms a rising peak, followed by a breakdown below the previous valley.
→ Model 2 - Equal Peak Reversal
The market forms an equal peak, followed by a breakdown below the previous valley.
→ Model 3 - Dropping Peak Reversal
The market forms a dropping peak, followed by a breakdown below the previous valley.
🔸 The fractal nature of markets
Rising wave
→ The rising wave is the entire bull market between turning points
High point : When the Main trend turns from upward to downward, the peak of the primary trend is formed.
Dropping wave
→ The Dropping wave is the entire bear market between turning points.
Low point : When the Main trend turns from downward to upward, the primary trend valley is formed.
Fractal nature application.
Everything in one picture.
🔹 Features
Strict adherence to the rules: Follows the Original Gann Swing Chart Rules to detect swing points.
Fractal analysis: Uses trend bars and fractal analysis to identify swing points.
Robust functionality: Engineered to handle complex market conditions with advanced logic.
Custom alerts: Alerts for peak/valley completion, main and primary trend reversals & continuations.
Golden rule application: Filters out non-trend bars by comparing only with the last trend bar.
Reversal & trend detection: Applies eight outside bar rules to detect trend reversals and continuations.
Dynamic customization: Fully customizable settings.
🔹 Settings overview
Fine-tune the indicator to match your unique trading strategy by adjusting trend settings, customizing alerts, and modifying visualization options.
1. Main trend settings
Hide/Show Main trend options: Instantly hide all main trend options (alerts remain separate).
Main trendline display & alerts: Toggle trendline visibility and set alerts for peaks and valleys.
Trendline customization: Adjust styles, colors, and slopes for upward/downward trends.
Peaks & Valleys markers: Show/hide points and customize their color and size.
Opposite Main trend turning points: Enable alerts and modify style, width, color, and offset.
Breakout/Breakdown points: Set alerts and customize their appearance.
2. Primary trend settings
Hide/Show primary trend options: Instantly hide all primary trend options (alerts remain separate).
Primary trendline display & alerts: Toggle trendline visibility and set alerts for peaks and valleys.
Trendline customization: Adjust styles, colors, and slopes for upward/downward trends.
Peaks & Valleys markers: Show/hide points and customize their color and size.
Opposite primary trend turning points: Enable alerts and modify style, width, color, and offset.
Breakout/Breakdown points: Set alerts and customize their appearance.
3. Additional options
Tooltips display: Control tooltip visibility for labels and languages.
Candle/Bar coloring: Customize candle and bar colors based on algorithm-selected trends.
🔸 Additional features
🔹Custom reading of bars.
The arrow represents the direction of the slope, the dot is the type of trend, and the line is the closing price.
🔹 Advanced Moving Average Activator
The Advanced Moving Average Activator, this setting calculates the average closing prices of trend bars only, which are the only bars considered by Gann.
The advantage of this method is that it helps avoid hidden bars that are not accounted for, making the difference more evident in a ranging market. The values are updated only when new highs or lows occur.
Additionally, you can set alerts when the price closes above or below the moving average.
🔹 Bar Counter
After a trend change, you can see exactly when the shift occurred and customize the type of trend you want to track.
For example, by conducting your own research on the assets you trade, based on historical data, you might discover valuable insights, such as the primary trend possibly lasting longer than 20 bars!
You can use these insights to refine your trading strategy and make more data-driven decisions.
🔹 How to use
Step 1: Configure the settings and choose your trading approach
Adjust the indicator settings to match your trading style and market conditions.
Effectively using the indicator starts with selecting your preferred trading style.
You can trade in alignment with the primary trend, capitalize on market reversals, or take advantage of breakouts.
Trading with the primary trend: Best for traders who prefer longer-term positions with higher stability.
Trading reversals: Ideal for those looking to enter at potential turning points but requires additional confirmation.
Trading breakouts: Suitable for traders targeting strong price movements after key level breakouts.
Adapting to market volatility: Monitor changing volatility and adjust your strategy accordingly for optimal results.
Step 2: Analyze the chart
Apply the indicator to your TradingView chart and interpret swing signals for informed decisions.
Carefully study the chart patterns to detect subtle signals.
Check if similar signals worked well in past market conditions.
Use multi-timeframe analysis for a broader perspective.
Step 3: Trade with the primary trend
Utilize trend direction to align trades with prevailing market movements.
Always trade in the direction of the primary trend.
Confirm the trend direction using multiple indicators or by relying on the primary trend as confirmation!.
Avoid trading against strong market momentum.
Step 4: Identify entry signals
Use indicator signals to identify ideal trade entry points.
Look for confirmation before entering a trade.
Wait for clear signals to avoid false entries.
Practice on a demo account to build confidence in your entry strategy.
Step 5: Apply risk management
Define stop-loss and take-profit levels to protect your capital effectively.
Set stop-loss orders at strategic levels to limit potential losses.
Risk only a small percentage of your capital per trade.
Adjust risk levels based on your overall portfolio performance.
Step 6: Confirm with trend analysis
Validate trends using additional indicators for a higher probability of success.
Use complementary tools to confirm trend direction.
Monitor trend changes to adjust your strategy promptly.
Keep an eye on volume indicators for added confirmation.
Step 7: Execute the trade
Enter trades based on confirmed signals and predefined strategy rules.
Ensure all your criteria are met before executing a trade.
Stay disciplined and stick to your strategy.
Review market conditions right before execution.
Step 8: Monitor the trade
Track trade performance and make adjustments as necessary.
Keep an eye on market conditions throughout the trade.
Be ready to adjust your strategy if unexpected events occur.
Use trailing stops to secure profits while allowing for gains.
Step 9: Implement exit strategy
Close trades strategically based on your pre-established exit plan.
Plan your exit strategy in advance and adhere to it.
Consider partial exits to secure profits along the way.
Avoid emotional decisions when closing trades.
Step 10: Review performance
Analyze past trades to continuously refine and improve your strategy.
Regularly review and document your trades for insights.
Identify patterns in both your successes and mistakes.
Update your strategy based on comprehensive performance reviews.
🔹 Disclosure
While this script is useful and provides insight into market tops, bottoms, and trend trading, it's critical to understand that past performance is not necessarily indicative of future results and there are many more factors that go into being a profitable trader.

Logarithmic Regression Channel-Trend [BigBeluga]
This indicator utilizes logarithmic regression to track price trends and identify overbought and oversold conditions within a trend. It provides traders with a dynamic channel based on logarithmic regression, offering insights into trend strength and potential reversal zones.
🔵Key Features:
Logarithmic Regression Trend Tracking: Uses log regression to model price trends and determine trend direction dynamically.
f_log_regression(src, length) =>
float sumX = 0.0
float sumY = 0.0
float sumXSqr = 0.0
float sumXY = 0.0
for i = 0 to length - 1
val = math.log(src )
per = i + 1.0
sumX += per
sumY += val
sumXSqr += per * per
sumXY += val * per
slope = (length * sumXY - sumX * sumY) / (length * sumXSqr - sumX * sumX)
average = sumY / length
intercept = average - slope * sumX / length + slope
Regression-Based Channel: Plots a log regression channel around the price to highlight overbought and oversold conditions.
Adaptive Trend Colors: The color of the regression trend adjusts dynamically based on price movement.
Trend Shift Signals: Marks trend reversals when the log regression line cross the log regression line 3 bars back.
Dashboard for Key Insights: Displays:
- The regression slope (multiplied by 100 for better scale).
- The direction of the regression channel.
- The trend status of the logarithmic regression band.
🔵Usage:
Trend Identification: Observe the regression slope and channel direction to determine bullish or bearish trends.
Overbought/Oversold Conditions: Use the channel boundaries to spot potential reversal zones when price deviates significantly.
Breakout & Continuation Signals: Price breaking outside the channel may indicate strong trend continuation or exhaustion.
Confirmation with Other Indicators: Combine with volume or momentum indicators to strengthen trend confirmation.
Customizable Display: Users can modify the lookback period, channel width, midline visibility, and color preferences.
Logarithmic Regression Channel-Trend is an essential tool for traders who want a dynamic, regression-based approach to market trends while monitoring potential price extremes.

Parabolic SAR Deviation [BigBeluga]Parabolic SAR + Deviation is an enhanced Parabolic SAR indicator designed to detect trends while incorporating deviation levels and trend change markers for added depth in analyzing price movements.
🔵 Key Features:
> Parabolic SAR with Optimized Settings:
Built on the classic Parabolic SAR, this version uses predefined default settings to enhance its ability to detect and confirm trends.
Clear trend direction is indicated by smooth trend lines, allowing traders to easily visualize market movements.
Trend Change Markers:
When a trend change occurs based on the SAR, the indicator plots a triangle at the trend change point.
The triangle is accompanied by the price value of the trend change, allowing traders to identify key reversal points instantly.
> Deviation Levels:
Four deviation levels are automatically plotted when a trend change occurs (up or down).
Uptrend: Deviation levels are positioned above the entry point.
Downtrend: Deviation levels are positioned below the entry point.
Levels are labeled with numbers 1 to 4, representing increasing degrees of deviation.
> Dynamic Level Updates:
When the price crosses a deviation level, the level becomes dashed and its label changes to display the volume at the breakout point.
This volume information helps traders assess the strength of the breakout and the potential for trend continuation or reversal.
> Volume Analysis at Breakpoints:
The volume displayed at crossed deviation levels provides insight into the strength of the price movement.
High volume at a breakout may indicate strong momentum, while low volume could signal potential exhaustion or a false breakout.
🔵 Usage:
Identify Trends: Use the trend change triangles and smooth SAR trend lines to confirm whether the market is trending up or down.
Analyze Deviation Levels: Monitor deviation levels **1–4** to identify potential breakout points and assess the degree of price deviation from the entry point.
Observe Trend Change Points: Utilize the triangles and price labels to quickly spot significant trend changes.
Volume Insights: Evaluate the volume displayed at crossed levels to determine the strength of the breakout and assess the likelihood of trend continuation or reversal.
Risk Management: Use deviation levels as potential stop-loss or take-profit zones, depending on the strength of the trend and volume conditions.
Parabolic SAR + Deviation is an essential tool for traders seeking a straightforward yet powerful method to identify trends, analyze price deviations, and gain insights into volume dynamics at critical breakout and trend change levels.
TheRookAlgoPROThe Rook Algo PRO is an automated strategy that uses ICT dealing ranges to get in sync with potential market trends. It detects the market sentiment and then place a sell or a buy trade in premium/discount or in breakouts with the desired risk management.
Why is useful?
This algorithm is designed to help traders to quickly identify the current state of the market and easily back test their strategy over longs periods of time and different markets its ideal for traders that want to profit on potential expansions and want to avoid consolidations this algo will tell you when the expansion is likely to begin and when is just consolidating and failing moves to avoid trading.
How it works and how it does it?
The Algo detects the current and previous market structure to identify current ranges and ICT dealing ranges that are created when the market takes buyside liquidity and sellside liquidity, it will tell if the market is in a consolidation, expansion, retracement or in a potential turtle soup environment, it will tell if the range is small or big compared to the previous one. Is important to use it in a trending markets because when is ranging the signals lose effectiveness.
This algo is similar to the previously released the Rook algo with the additional features that is an automated strategy that can take trades using filters with the desired risk reward and different entry types and trade management options.
Also this version plots FVGS(fair value gaps) during expansions, and detects consolidations with a box and the mid point or average. Some bars colors are available to help in the identification of the market state. It has the option to show colors of the dealing ranges first detected state.
How to use it?
Start selecting the desired type of entry you want to trade, you can choose to take Discount longs, premium sells, breakouts longs and sells, this first four options are the selected by default. You can enable riskier options like trades without confirmation in premium and discount or turtle soup of the current or previous dealing range. This last ones are ideal for traders looking to enter on a counter trend but has to be used with caution with a higher timeframe reference.
In the picture below we can see a premium sell signal configuration followed by a discount buy signal It display the stop break even level and take profit.
This next image show how the riskier entries work. Because we are not waiting for a confirmation and entering on a counter trend is normal to experience some stop losses because the stop is very tight. Should only be used with a clear Higher timeframe reference as support of the trade idea. This algo has the option to enable standard deviations from the normal stop point to prevent liquidity sweeps. The purple or blue arrows indicate when we are in a potential turtle soup environment.
The algo have a feature called auto-trade enable by default that allow for a reversal of the current trade in case it meets the criteria. And also can take all possible buys or all possible sells that are riskier entries if you just want to see the market sentiment. This is useful when the market is very volatile but is moving not just ranging.
Then we configure the desired trade filters. We have the options to trade only when dealing ranges are in sync for a more secure trend, or we can disable it to take riskier trades like turtle soup trades. We can chose the minimum risk reward to take the trade and the target extension from the current range and the exit type can be when we hit the level or in a retracement that is the default setting. These setting are the most important that determine profitability of the strategy, they has be adjusted depending on the timeframe and market we are trading.
The stop and target levels can also be configured with standard deviations from the current range that way can be adapted to the market volatility.
The Algo allow the user to chose if it want to place break even, or trail the stop. In the picture below we can see it in action. This can work when the trend is very strong if not can lead to multiple reentries or loses.
The last option we can configure is the time where the trades are going to be taken, if we trade usually in the morning then we can just add the morning time by default is set to the morning 730am to 1330pm if you want to trade other times you should change this. Or if we want to enter on the ICT macro times can also be added in a filter. Trade taken with the macro times only enable is visible in the picture below.
Strategy Results
The results are obtained using 2000usd in the MNQ! In the 15minutes timeframe 1 contract per trade. Commission are set to 2USD, slippage to 1tick, the backtesting range is from May 2 2024 to March 2025 for a total of 119 trades, this Strategy default settings are designed to take trades on the daily expansions, trail stop and Break even is activated the exit on profit is on a retracement, and for loses when the stop is hit. The auto-trade option is enable to allow to detect quickly market changes. The strategy give realistic results, makes around 200% of the account in around a year. 1.4 profit factor with around 37% profitable trades. These results can be further improve and adapted to the specific style of trading using the filters.
Remember entries constitute only a small component of a complete winning strategy. Other factors like risk management, position-sizing, trading frequency, trading fees, and many others must also be properly managed to achieve profitability. Past performance doesn’t guarantee future results.
Summary of features
-Easily Identify the current dealing range and market state to avoid consolidations
-Recognize expansions with FVGs and consolidation with shaded boxes
-Recognize turtle soups scenarios to avoid fake out breakout
-Configurable automated trades in premium/discount or breakouts
-Auto-trade option that allow for reversal of the current trade when is no longer valid
-Time filter to allow only entries around the times you trade or on the macro times.
-Risk Reward filter to take the automated trades with visible stop and take profit levels
-Customizable trade management take profit, stop, breakeven level with standard deviations
-Trail stop option to secure profit when price move in your favor
-Option to exit on a close, retracement or reversal after hitting the take profit level
-Option to exit on a close or reversal after hitting stop loss
-Dashboard with instant statistics about the strategy current settings and market sentiment

Multi-Timeframe PSAR Indicator ver 1.0Enhance your trend analysis with the Multi-Timeframe Parabolic SAR (MTF PSAR) indicator! This powerful tool displays the Parabolic SAR (Stop and Reverse) from both the current chart's timeframe and a higher timeframe, all in one convenient view. Identify potential trend reversals and set dynamic trailing stops with greater confidence by understanding the broader market context.
Key Features:
Dual Timeframe Analysis: Simultaneously visualize the PSAR on your current chart and a user-defined higher timeframe (e.g., see the Daily PSAR while trading on the 1-hour chart). This helps you align your trades with the dominant trend.
Customizable PSAR Settings: Fine-tune the PSAR calculation with adjustable Start, Increment, and Maximum values. Optimize the indicator's sensitivity to match your trading style and the volatility of the asset.
Independent Timeframe Control: Choose to display either or both the current timeframe PSAR and the higher timeframe PSAR. Focus on the information most relevant to your analysis.
Clear Visual Representation: Distinct colors for the current and higher timeframe PSAR dots make it easy to differentiate between the two. Quickly identify potential entry and exit points.
Configurable Colors You can easily change colors of Current and HTF PSAR.
Standard PSAR Logic: Uses the classic Parabolic SAR algorithm, providing a reliable and widely-understood trend-following indicator.
lookahead=barmerge.lookahead_off used in the security function, there is no data leak or repainting.
Benefits:
Improved Trend Identification: Spot potential trend changes earlier by observing divergences between the current and higher timeframe PSAR.
Enhanced Risk Management: Use the PSAR as a dynamic trailing stop-loss to protect profits and limit potential losses.
Greater Trading Confidence: Make more informed decisions by considering the broader market trend.
Reduced Chart Clutter: Avoid the need to switch between multiple charts to analyze different timeframes.
Versatile Application: Suitable for various trading styles (swing trading, day trading, trend following) and markets (stocks, forex, crypto, etc.).
How to Use:
Add to Chart: Add the "Multi-Timeframe PSAR" indicator to your TradingView chart.
Configure Settings:
PSAR Settings: Adjust the Start, Increment, and Maximum values to control the PSAR's sensitivity.
Multi-Timeframe Settings: Select the desired "Higher Timeframe PSAR" resolution (e.g., "D" for Daily). Enable or disable the display of the current and/or higher timeframe PSAR using the checkboxes.
Interpret Signals:
Current Timeframe PSAR: Dots below the price suggest an uptrend; dots above the price suggest a downtrend.
Higher Timeframe PSAR: Provides context for the overall trend. Agreement between the current and higher timeframe PSAR strengthens the trend signal. Divergences may indicate potential reversals.
Trade Management:
Use PSAR dots as dynamic trailing stop.
Example Use Cases:
Confirming Trend Strength: A trader on a 1-hour chart sees the 1-hour PSAR flip bullish (dots below the price). They check the MTF PSAR and see that the Daily PSAR is also bullish, confirming the strength of the uptrend.
Identifying Potential Reversals: A trader sees the current timeframe PSAR flip bearish, but the higher timeframe PSAR remains bullish. This divergence could signal a potential pullback within a larger uptrend, or a warning of a more significant reversal.
Trailing Stops: A trader enters a long position and uses the current timeframe PSAR as a trailing stop, moving their stop-loss up as the PSAR dots rise.
Disclaimer: The Parabolic SAR is a lagging indicator and may produce false signals, especially in ranging markets. It is recommended to use this indicator in conjunction with other technical analysis tools and risk management strategies. Past performance is not indicative of future results.

[GYTS-CE] Market Regime Detector🧊 Market Regime Detector (Community Edition)
🌸 Part of GoemonYae Trading System (GYTS) 🌸
🌸 --------- INTRODUCTION --------- 🌸
💮 What is the Market Regime Detector?
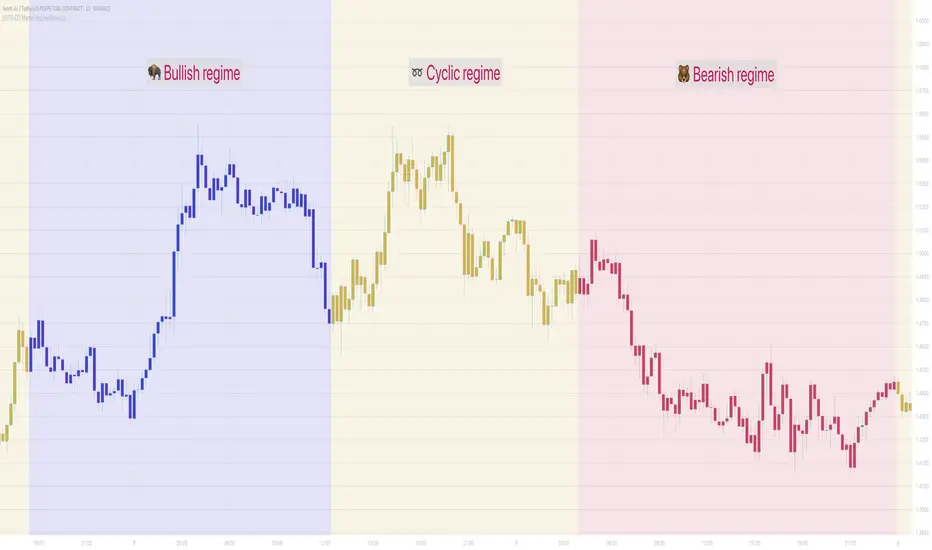
The Market Regime Detector is an advanced, consensus-based indicator that identifies the current market state to increase the probability of profitable trades. By distinguishing between trending (bullish or bearish) and cyclic (range-bound) market conditions, this detector helps you select appropriate tactics for different environments. Instead of forcing a single strategy across all market conditions, our detector allows you to adapt your approach based on real-time market behaviour.
💮 The Importance of Market Regimes
Markets constantly shift between different behavioural states or "regimes":
• Bullish trending markets - characterised by sustained upward price movement
• Bearish trending markets - characterised by sustained downward price movement
• Cyclic markets - characterised by range-bound, oscillating behaviour
Each regime requires fundamentally different trading approaches. Trend-following strategies excel in trending markets but fail in cyclic ones, while mean-reversion strategies shine in cyclic markets but underperform in trending conditions. Detecting these regimes is essential for successful trading, which is why we've developed the Market Regime Detector to accurately identify market states using complementary detection methods.
🌸 --------- KEY FEATURES --------- 🌸
💮 Consensus-Based Detection
Rather than relying on a single method, our detector employs two complementary detection methodologies that analyse different aspects of market behaviour:
• Dominant Cycle Average (DCA) - analyzes price movement relative to its lookback period, a proxy for the dominant cycle
• Volatility Channel - examines price behaviour within adaptive volatility bands
These diverse perspectives are synthesised into a robust consensus that minimises false signals while maintaining responsiveness to genuine regime changes.
💮 Dominant Cycle Framework
The Market Regime Detector uses the concept of dominant cycles to establish a reference framework. You can input the dominant cycle period that best represents the natural rhythm of your market, providing a stable foundation for regime detection across different timeframes.
💮 Intuitive Parameter System
We've distilled complex technical parameters into intuitive controls that traders can easily understand:
• Adaptability - how quickly the detector responds to changing market conditions
• Sensitivity - how readily the detector identifies transitions between regimes
• Consensus requirement - how much agreement is needed among detection methods
This approach makes the detector accessible to traders of all experience levels while preserving the power of the underlying algorithms.
💮 Visual Market Feedback
The detector provides clear visual feedback about the current market regime through:
• Colour-coded chart backgrounds (purple shades for bullish, pink for bearish, yellow for cyclic)
• Colour-coded price bars
• Strength indicators showing the degree of consensus
• Customizable colour schemes to match your preferences or trading system
💮 Integration in the GYTS suite
The Market Regime Detector is compatible with the GYTS Suite , i.e. it passes the regime into the 🎼 Order Orchestrator where you can set how to trade the trending and cyclic regime.
🌸 --------- CONFIGURATION SETTINGS --------- 🌸
💮 Adaptability
Controls how quickly the Market Regime detector adapts to changing market conditions. You can see it as a low-frequency, long-term change parameter:
Very Low: Very slow adaptation, most stable but may miss regime changes
Low: Slower adaptation, more stability but less responsiveness
Normal: Balanced between stability and responsiveness
High: Faster adaptation, more responsive but less stable
Very High: Very fast adaptation, highly responsive but may generate false signals
This setting affects lookback periods and filter parameters across all detection methods.
💮 Sensitivity
Controls how sensitive the detector is to market regime transitions. This acts as a high-frequency, short-term change parameter:
Very Low: Requires substantial evidence to identify a regime change
Low: Less sensitive, reduces false signals but may miss some transitions
Normal: Balanced sensitivity suitable for most markets
High: More sensitive, detects subtle regime changes but may have more noise
Very High: Very sensitive, detects minor fluctuations but may produce frequent changes
This setting affects thresholds for regime detection across all methods.
💮 Dominant Cycle Period
This parameter allows you to specify the market's natural rhythm in bars. This represents a complete market cycle (up and down movement). Finding the right value for your specific market and timeframe might require some experimentation, but it's a crucial parameter that helps the detector accurately identify regime changes. Most of the times the cycle is between 20 and 40 bars.
💮 Consensus Mode
Determines how the signals from both detection methods are combined to produce the final market regime:
• Any Method (OR) : Signals bullish/bearish if either method detects that regime. If methods conflict (one bullish, one bearish), the stronger signal wins. More sensitive, catches more regime changes but may produce more false signals.
• All Methods (AND) : Signals only when both methods agree on the regime. More conservative, reduces false signals but might miss some legitimate regime changes.
• Weighted Decision : Balances both methods with equal weighting. Provides a middle ground between sensitivity and stability.
Each mode also calculates a continuous regime strength value that's used for colour intensity in the 'unconstrained' display mode.
💮 Display Mode
Choose how to display the market regime colours:
• Unconstrained regime: Shows the regime strength as a continuous gradient. This provides more nuanced visualisation where the intensity of the colour indicates the strength of the trend.
• Consensus only: Shows only the final consensus regime with fixed colours based on the detected regime type.
The background and bar colours will change to indicate the current market regime:
• Purple shades: Bullish trending market (darker purple indicates stronger bullish trend)
• Pink shades: Bearish trending market (darker pink indicates stronger bearish trend)
• Yellow: Cyclic (range-bound) market
💮 Custom Colour Options
The Market Regime Detector allows you to customize the colour scheme to match your personal preferences or to coordinate with other indicators:
• Use custom colours: Toggle to enable your own colour choices instead of the default scheme
• Transparency: Adjust the transparency level of all regime colours
• Bullish colours: Define custom colours for strong, medium, weak, and very weak bullish trends
• Bearish colours: Define custom colours for strong, medium, weak, and very weak bearish trends
• Cyclic colour: Define a custom colour for cyclic (range-bound) market conditions
🌸 --------- DETECTION METHODS --------- 🌸
💮 Dominant Cycle Average (DCA)
The Dominant Cycle Average method forms a key part of our detection system:
1. Theoretical Foundation :
The DCA method builds on cycle analysis and the observation that in trending markets, price consistently remains on one side of a moving average calculated using the dominant cycle period. In contrast, during cyclic markets, price oscillates around this average.
2. Calculation Process :
• We calculate a Simple Moving Average (SMA) using the specified lookback period - a proxy for the dominant cycle period
• We then analyse the proportion of time that price spends above or below this SMA over a lookback window. The theory is that the price should cross the SMA each half cycle, assuming that the dominant cycle period is correct and price follows a sinusoid.
• This lookback window is adaptive, scaling with the dominant cycle period (controlled by the Adaptability setting)
• The different values are standardised and normalised to possess more resolving power and to be more robust to noise.
3. Regime Classification :
• When the normalised proportion exceeds a positive threshold (determined by Sensitivity setting), the market is classified as bullish trending
• When it falls below a negative threshold, the market is classified as bearish trending
• When the proportion remains between these thresholds, the market is classified as cyclic
💮 Volatility Channel
The Volatility Channel method complements the DCA method by focusing on price movement relative to adaptive volatility bands:
1. Theoretical Foundation :
This method is based on the observation that trending markets tend to sustain movement outside of normal volatility ranges, while cyclic markets tend to remain contained within these ranges. By creating adaptive bands that adjust to current market volatility, we can detect when price behaviour indicates a trending or cyclic regime.
2. Calculation Process :
• We first calculate a smooth base channel center using a low pass filter, creating a noise-reduced centreline for price
• True Range (TR) is used to measure market volatility, which is then smoothed and scaled by the deviation factor (controlled by Sensitivity)
• Upper and lower bands are created by adding and subtracting this scaled volatility from the centreline
• Price is smoothed using an adaptive A2RMA filter, which has a very flat and stable behaviour, to reduce noise while preserving trend characteristics
• The position of this smoothed price relative to the bands is continuously monitored
3. Regime Classification :
• When smoothed price moves above the upper band, the market is classified as bullish trending
• When smoothed price moves below the lower band, the market is classified as bearish trending
• When price remains between the bands, the market is classified as cyclic
• The magnitude of price's excursion beyond the bands is used to determine trend strength
4. Adaptive Behaviour :
• The smoothing periods and deviation calculations automatically adjust based on the Adaptability setting
• The measured volatility is calculated over a period proportional to the dominant cycle, ensuring the detector works across different timeframes
• Both the center line and the bands adapt dynamically to changing market conditions, making the detector responsive yet stable
This method provides a unique perspective that complements the DCA approach, with the consensus mechanism synthesising insights from both methods.
🌸 --------- USAGE GUIDE --------- 🌸
💮 Starting with Default Settings
The default settings (Normal for Adaptability and Sensitivity, Weighted Decision for Consensus Mode) provide a balanced starting point suitable for most markets and timeframes. Begin by observing how these settings identify regimes in your preferred instruments.
💮 Finding the Optimal Dominant Cycle
The dominant cycle period is a critical parameter. Here are some approaches to finding an appropriate value:
• Start with typical values, usually something around 25 works well
• Visually identify the average distance between significant peaks and troughs
• Experiment with different values and observe which provides the most stable regime identification
• Consider using cycle-finding indicators to help identify the natural rhythm of your market
💮 Adjusting Parameters
• If you notice too many regime changes → Decrease Sensitivity or increase Consensus requirement
• If regime changes seem delayed → Increase Adaptability
• If a trending regime is not detected, the market is automatically assigned to be in a cyclic state
• If you want to see more nuanced regime transitions → Try the "unconstrained" display mode (note that this will not affect the output to other indicators)
💮 Trading Applications
Regime-Specific Strategies:
• Bullish Trending Regime - Use trend-following strategies, trail stops wider, focus on breakouts, consider holding positions longer, and emphasize buying dips
• Bearish Trending Regime - Consider shorts, tighter stops, focus on breakdown points, sell rallies, implement downside protection, and reduce position sizes
• Cyclic Regime - Apply mean-reversion strategies, trade range boundaries, apply oscillators, target definable support/resistance levels, and use profit-taking at extremes
Strategy Switching:
Create a set of rules for each market regime and switch between them based on the detector's signal. This approach can significantly improve performance compared to applying a single strategy across all market conditions.
GYTS Suite Integration:
• In the GYTS 🎼 Order Orchestrator, select the '🔗 STREAM-int 🧊 Market Regime' as the market regime source
• Note that the consensus output (i.e. not the "unconstrained" display) will be used in this stream
• Create different strategies for trending (bullish/bearish) and cyclic regimes. The GYTS 🎼 Order Orchestrator is specifically made for this.
• The output stream is actually very simple, and can possibly be used in indicators and strategies as well. It outputs 1 for bullish, -1 for bearish and 0 for cyclic regime.
🌸 --------- FINAL NOTES --------- 🌸
💮 Development Philosophy
The Market Regime Detector has been developed with several key principles in mind:
1. Robustness - The detection methods have been rigorously tested across diverse markets and timeframes to ensure reliable performance.
2. Adaptability - The detector automatically adjusts to changing market conditions, requiring minimal manual intervention.
3. Complementarity - Each detection method provides a unique perspective, with the collective consensus being more reliable than any individual method.
4. Intuitiveness - Complex technical parameters have been abstracted into easily understood controls.
💮 Ongoing Refinement
The Market Regime Detector is under continuous development. We regularly:
• Fine-tune parameters based on expanded market data
• Research and integrate new detection methodologies
• Optimise computational efficiency for real-time analysis
Your feedback and suggestions are very important in this ongoing refinement process!
XGBoost Approximation Indicator with HTF Filter Ver. 3.2XGBoost Approx Indicator with Higher Timeframe Filter Ver. 3.2
What It Is
The XGBoost Approx Indicator is a technical analysis tool designed to generate trading signals based on a composite of multiple indicators. It combines Simple Moving Average (SMA), Relative Strength Index (RSI), MACD, Rate of Change (ROC), and Volume to create a composite indicator score. Additionally, it incorporates a higher timeframe filter (HTF) to enhance trend confirmation and reduce false signals.
This indicator helps traders identify long (buy) and short (sell) opportunities based on a weighted combination of trend-following and momentum indicators.
How to Use It Properly
Setup and Configuration:
Add the indicator to your TradingView chart.
Customize input settings based on your trading strategy. Key configurable inputs include:
HTF filter (default: 1-hour)
SMA, RSI, MACD, and ROC lengths
Custom weightings for each component
Thresholds for buy and sell signals
Understanding the Signals:
Green "Long" Label: Appears when the composite indicator crosses above the buy threshold, signaling a potential buy opportunity.
Red "Short" Label: Appears when the composite indicator crosses below the sell threshold, signaling a potential sell opportunity.
These signals are filtered by a higher timeframe SMA trend to improve accuracy.
Alerts:
The indicator provides alert conditions for long and short entries.
Traders can enable alerts in TradingView to receive real-time notifications when a new signal is triggered.
Safety and Best Practices
Use in Conjunction with Other Analysis: Do not rely solely on this indicator. Combine it with price action, support/resistance levels, and fundamental analysis for better decision-making.
Adjust Settings for Your Strategy: The default settings may not suit all markets or timeframes. Test different configurations before trading live.
Backtest Before Using in Live Trading: Evaluate the indicator’s past performance on historical data to assess its effectiveness in different market conditions.
Avoid Overtrading: False signals can occur, especially in low volatility or choppy markets. Use additional confirmation (e.g., trendlines or moving averages).
Risk Management: Always set stop-loss levels and position sizes to limit potential losses.

TrendPredator PROThe TrendPredator PRO
Stacey Burke, a seasoned trader and mentor, developed his trading system over the years, drawing insights from influential figures such as George Douglas Taylor, Tony Crabel, Steve Mauro, and Robert Schabacker. His popular system integrates select concepts from these experts into a consistent framework. While powerful, it remains highly discretionary, requiring significant real-time analysis, which can be challenging for novice traders.
The TrendPredator indicators support this approach by automating the essential analysis required to trade the system effectively and incorporating mechanical bias and a multi-timeframe concept. They provide value to traders by significantly reducing the time needed for session preparation, offering all relevant chart analysis and signals for live trading in real-time.
The PRO version offers an advanced pattern identification logic that highlights developing context as well as setups related to the constellation of the signals provided. It provides real-time interpretation of the multi-timeframe analysis table, following an extensive underlying logic with more than 150 different setup variations specifically developed for the system and indicator. These setups are constantly back- and forward-tested and updated according to the results. This version is tailored to traders primarily trading this system and following the related setups in detail.
The former TrendPredator ES version does not provide that option. It is significantly leaner and is designed for traders who want to use the multi-timeframe logic as additional confluence for their trading style. It is very well suited to support many other trading styles, including SMC and ICT.
The Multi-timeframe Master Pattern
Inspired by Taylor’s 3-day cycle and Steve Mauro’s work with “Beat the Market Maker,” Burke’s system views markets as cyclical, driven by the manipulative patterns of market makers. These patterns often trap traders at the extremes of moves above or below significant levels with peak formations, then reverse to utilize their liquidity, initiating the next phase. Breakouts away from these traps often lead to range expansions, as described by Tony Crabel and Robert Schabacker. After multiple consecutive breakouts, especially after the psychological number three, overextension might develop. A break in structure may then lead to reversals or pullbacks. The TrendPredator Indicator and the related multi-timeframe trading system are designed to track these cycles on the daily timeframe and provide signals and trade setups to navigate them.
Bias Logic and Multi-Timeframe Concept
The indicator covers the basic signals of Stacey Burke's system:
- First Red Day (FRD): Bearish break in structure, signalling weak longs in the market.
- First Green Day (FGD): Bullish break in structure signalling weak shorts in the markt.
- Three Days of Longs (3DL): Overextension signalling potential weak longs in the market.
- Three Days of Shorts (3DS): Overextension signalling potential weak shorts in the market.
- Inside Day (ID): Contraction, signalling potential impulsive reversal or range expansion move.
It enhances the original system by introducing:
Structured Bias Logic:
Tracks bias by following how price trades concerning the last previous candle high or low that was hit. For example if the high was hit, we are bullish above and bearish below.
- Bullish state: Breakout (BO), Fakeout Low (FOL)
- Bearish state: Breakdown (BD), Fakeout High (FOH)
Multi-Timeframe Perspective:
- Tracks all signals across H4, H8, D, W, and M timeframes, to look for alignment and follow trends and momentum in a mechanical way.
Developing Context:
- Identifies specific predefined context states based on the monthly, weekly and daily bias.
Developing Setups:
- Identifies specific predefined setups based on context and H8 bias as well as SB signals.
The indicator monitors the bias and signals of the system across all relevant timeframes and automates the related graphical chart analysis as well as context and setup zone identification. In addition to the master pattern, the system helps to identify the higher timeframe situation and follow the moves driven by other timeframe traders to then identify favourable context and setup situations for the trader.
Example: Full Bullish Cycle on the Daily Timeframe with Multi-Timeframe Signals
- The Trap/Peak Formation
The market breaks down from a previous day’s and maybe week’s low—potentially after multiple breakdowns—but fails to move lower and pulls back up to form a peak formation low and closes as a first green day.
MTF Signals: Bullish daily and weekly fakeout low; three consecutive breakdown days (1W Curr FOL, 1D Curr FOL, BO 3S).
Context: Reversal (REV)
Setup: Fakeout low continuation low of day (FOL Cont LOD)
- Pullback and Consolidation
The next day pulls further up after first green day signal, potentially consolidates inside the previous day’s range.
MTF Signals: Fakeout low and first green day closing as an inside day (1D Curr IS, Prev FOL, First G).
Context: Reversal continuation (REV Cont)
Setup: Previous fakeout low continuation low handing fruit (Prev FOL Cont LHF)
- Range Expansion/Trend
The following day breaks up through the previous day’s high, launching a range expansion away from the trap.
MTF Signals: Bullish daily breakout of an inside day (1D Curr BO, Prev IS).
Context: Uptrend healthy (UT)
Setup: Breakout continuation low hanging fruit (BO Cont LHF)
- Overextension
After multiple consecutive breakouts, the market reaches a state of overextension, signalling a possible reversal or pullback.
MTF Signals: Three days of breakout longs (1D Curr BO, Prev BO, BO 3L).
Context: Uptrend extended (UT)
- Reversal
After a breakout of previous days high that fails, price pulls away from the high showing a rollover of momentum across all timeframes and a potential short setup.
MTF Signals: Three days of breakout longs, daily fakeout high (1D 3L, FOH)
Context: Reversal countertrend (REV)
Setup: Fakeout high continuation high of day (FOH Cont HOD)
Note: This is only one possible illustrative scenario; there are many variations and combinations.
Example Chart: Full Bullish Cycle with Correlated Signals
Multi-Timeframe Signals examples:
Context and Setups examples:
Note: The signals shown along the move are manually added illustrations. The indicator shows these in realtime in the table at top and bottom right. This is only one possible scenario; there are many variations and combinations.
Due to the fractal nature of markets, this cycle can be observed across all timeframes. The strongest setups occur when there is multi-timeframe alignment. For example, a peak formation and potential reversal on the daily timeframe have higher probability and follow-through when they align with bearish signals on higher timeframes (e.g., weekly/monthly BD/FOH) and confirmation on lower timeframes (H4/H8 FOH/BD). With this perspective, the system enables the trader to follow the trend and momentum while identifying rollover points in a highly differentiated and precise way.
Using the Indicator for Trading
The automated analysis provided by the indicator can be used for thesis generation in preparation for a session as well as for live trading, leveraging the real-time updates as well as the context and setup indicated or alerted. It is recommended to customize the settings deeply, such as hiding the lower timeframes for thesis generation or the specific alert time window and settings to the specific trading schedule and playbook of the trader.
1. Context Assessment:
Evaluate alignment of higher timeframes (e.g., Month/Week, Week/Day). More alignment → Stronger setups.
- The context table offers an interpretation of the higher timeframe automatically. See below for further details.
2. Setup Identification:
Follow the bias of daily and H8 timeframes. A setup mostly requires alignment of these.
Setup Types:
- Trend Trade: Trade in alignment with the previous day’s trend.
Example: Price above the previous day’s high → Focus on long setups (dBO, H8 FOL) until overextension or reversal signs appear (H8 BO 3L, First R).
- Reversal Trade: Identify reversal setups when lower timeframes show rollovers after higher timeframe weakness.
Example: Price below the previous day’s high → Look for reversal signals at the current high of day (H8 FOH, BO 3L, First R).
- The setup table shows potential setups for the specific price zone in the table automatically. See below for further details.
3. Entry Confirmation:
Confirm entries based on H8 and H4 alignment, candle closes and lower timeframe fakeouts.
- H8 and H4 should always align for a final confirmation, meaning the breach lines should be both in the back of a potential trade setup.
- M15/ 5 candle close can be seen as acceptance beyond a level or within the setup zone.
- M15/5 FOH/ FOL signals lower timeframe traps potentially indicating further confirmation.
Example Chart Reversal Trade:
Context: REV (yellow), Reversal counter trend, Month in FOL with bearish First R, Week in BO but bearishly overextended with BO 3L, Day in Fakeout high reversing bearishly.
Setup: FOH Cont HOD (red), Day in Fakeout high after BO 3L overextension, confirmed by H8 FOH high of day, First R as further confluence. Two star quality and countertrend.
Entry: H4 BD, M15 close below followed by M15 FOH.
Detailed Features and Options
1. Context and Setup table
The Context and Setup Table is the core feature of the TrendPredator PRO indicator. It delivers real-time interpretation of the multi-timeframe analysis based on an extensive underlying logic table with over 150 variations, specifically developed for this system and indicator. This logic is continuously updated and optimized to ensure accuracy and performance.
1.1. Developing Context
States for developing higher timeframe context are determined based on signals from the monthly, weekly, and daily timeframes.
- Green and Red indicate alignment and potentially interesting developing setups.
- Yellow signals a mixed or conflicting bias, suggesting caution when taking trades.
The specific states are:
- UT (yellow): Uptrend extended
- UT (green): Uptrend healthy
- REV (yellow): Reversal day counter trend
- REV (green): Reversal day mixed trend
- REV Cont (green): Reversal continuation mixed trend
- REV Cont (yellow): Reversal continuation counter trend
- REV into UT (green): Reversal day into uptrend
- REV Cont into UT (green): Reversal continuation into uptrend
- UT Pullback (yellow): Counter uptrend breakdown day
- Conflicting (yellow): Conflicting signals
- Consolidating (yellow): Consolidating sideways
- Inside (yellow): Trading inside after an inside week
- DT Pullback (yellow): Counter downtrend breakout day
- REV Cont into DT (red): Reversal continuation into downtrend
- REV into DT (red): Reversal day into downtrend
- REV Cont (yellow): Reversal continuation counter trend
- REV Cont (red): Reversal continuation mixed trend
- REV (red): Reversal day mixed trend
- REV (yellow): Reversal day countertrend
- DT (red): Downtrend healthy
- DT (yellow): Downtrend extended
Example: Uptrend
The Uptrend Context (UT, green) indicates a healthy uptrend with all timeframes aligning bullishly. In this case, the monthly is in a Fakeout Low (FOL) and currently inside the range, while the weekly and daily are both in Breakout (BO) states. This context is favorable for developing long setups in the direction of the trend.
Example: Uptrend pullback
The Uptrend Pullback Context (UT Pullback, yellow) indicates a Breakdown (BD) on the daily timeframe against a higher timeframe uptrend. In this case, the monthly is in a Fakeout Low (FOL) and currently inside its range, the weekly is in Breakout (BO) and also currently inside, while the daily is in Breakdown (BD). This context reflects a conflicting situation—potentially signaling either an early reversal back into the uptrend or, if the breakdown extends, the beginning of a possible trend change.
Example: Reversal into Uptrend
The Reversal into Uptrend Context (REV into UT, green) indicates a lower timeframe reversal aligning with a higher timeframe uptrend. In this case, the monthly is in Breakout (BO), the weekly is in Breakout (BO) and currently inside its range, while the daily is showing a bullish Fakeout Low (FOL) reversal. This context is potentially very favorable for long setups, as it signals a strong continuation of the uptrend supported across multiple timeframes.
Example: Reversal
The Bearish Reversal Context indicates a lower timeframe rollover within an ongoing higher timeframe uptrend. In this case, the monthly remains in Breakout (BO), the weekly has shifted into a Fakeout High (FOH) after three weeks of breakout longs, and the daily is already in Breakdown (BD). This context suggests a potentially favorable developing short setup, as early signs of weakness appear across timeframes.
1.2. Developing Setup
The states for specific setups are based on the context and the signals from the daily timeframe and H8, indicating that price is in the zone of alignment. The setup description refers to the state of the daily timeframe, while the suffix relates to the H8 timeframe. For example, "prev FOH Cont LHF" means that the previous day is in FOH (Fakeout High) relative to yesterday's breakout level, currently trading inside, and we are in an H8 breakdown, indicating a potential LHF (Lower High Formation) short trade if the entry confirms. The suffix HOD means that H8 is in FOH or BO (Breakout).
The specific states are:
- REV HOD (red): Reversal high of day
- REV Cont LHF (red): Reversal continuation low hanging fruit
- BO Cont LHF (green): Breakout continuation low hanging fruit
- BO Cont LOD (green): Breakout continuation low of day
- FOH Cont HOD (red): Fakeout high continuation high of day
- FOH Cont LHF ((red): Fakeout high continuation low hanging fruit
- prev BD Cont HOD (red): Previous breakdown continuation high of day
- prev BD Cont LHF (red): Previous breakdown continuation low hanging fruit
- prev FOH Cont HOD (red): Previous fakeout high continuation high of day
- prev FOH Cont LHF (red): Previous fakeout high continuation low hanging fruit
- prev FOL Cont LOD (green): Previous fakeout low continuation low of day
- prev FOL Cont LHF (green): Previous fakeout low continuation low hanging fruit
- prev BO Cont LOD (green): Previous breakout continuation low of day
- prev BO Cont LHF (green): Previous breakout continuation low hanging fruit
- FOL Cont LHF (green): Fakeout low continuation low hanging fruit
- FOL Cont LOD (green): Fakeout low continuation low of day
- BD Cont LHF (red): BD continuation low hanging fruit
- BD Cont LOD (red): Breakdown continuation low of day
- REV Cont LHF (green): Reversal continuation low hanging fruit
- REV LOD (green): Reversal low of day
- Inside: Trading inside after an inside day
Type: Indicates the situation of the indicated setup concerning:
- Trend: Following higher timeframe trend
- Mixed: Mixed higher timeframe signals
- Counter: Against higher timeframe bias
Quality: Indicates the quality of the indicated setup according to the specified logic table
No star: Very low quality
* One star: Low quality
** Two star: Medium quality
*** Three star: High quality
Example: Breakout Continuation Trend Setup
This setup highlights a healthy uptrend where the month is in a breakout, the week is in a fakeout low, and the day is in a breakout after a first green day. As the H8 breaks out to the upside, a long setup zone is triggered, presenting a breakout continuation low-hanging fruit trade. This is a trend trade in an overextended situation on the H8, with an H8 3L, resulting in an overall quality rating of one star.
Example: Fakeout Low Continuation Trend Setup
This setup shows a reversal into uptrend, with the month in a breakout, the week in a breakout, and the day in a fakeout low after breaking down the previous day and now reversing back up. As H8 breaks out to the upside, a long setup zone is triggered, presenting a previous fakeout low continuation, low-hanging fruit trade. This is a medium-quality trend trade.
Example: Reversal Setup - Mixed Trend
This setup shows a reversal setup in line with the weekly trend, with the month in a fakeout low, the week in a fakeout high, and the day in a fakeout high after breaking out earlier in the day and now reversing back down. As H8 loses the previous breakout level after 3 breakouts (with H8 3L), a short setup zone is triggered, presenting a fakeout high continuation at the high of the day. This is a high-quality trade in a mixed trend situation.
Setup Alerts:
Alerts can be activated for setups freshly triggered on the chart within your trading window.
Detailed filter logic for setup alerts:
- Setup quality: 1-3 star
- Setup type: Counter, Mixed and Trend
- Setup category: e.g. Reversal Bearish, Breakout, Previous Fakeout High
- 1D BO and First signals: 3DS, 3DL, FRD, FGD, ID
Options:
- Alerts on/ off
- Alert time window (from/ to)
- Alert filter customization
Note: To activate alerts from a script in TradingView, some settings need to be adjusted. Open the "Create Alert" dialog and select the option "Any alert() function call" in the "Condition" section. Choose "TrendPredator PRO" to ensure that alerts trigger properly from the code. Alerts can be activated for entire watchlists or individual pairs. Once activated, the alerts run in the background and notify the user whenever a setup is freshly triggered according to the filter settings.
2. Multi-Timeframe Table
Provides a real-time view of system signals, including:
Current Timeframe (Curr): Bias states.
- Breakout (green BO): Bullish after breaking above the previous high.
- Fakeout High (red FOH): Bearish after breaking above the previous high but pulling back down.
- Breakdown (red BD): Bearish after breaking below the previous low.
- Fakeout Low (green FOL): Bullish after breaking below the previous low but pulling back up.
- Inside (IS): Price trading neutral inside the previous range, taking the previous bias (color indicates the previous bias).
Previous Timeframe (Prev): Tracks last candle bias state and transitions dynamically.
- Bias for last candle: BO, FOH, BD, FOL in respective colors.
- Inside bar (yellow IS): Indicated as standalone signal.
Note: Also previous timeframes get constantly updated in real time to track the bias state in relation to the level that was hit. This means a BO can still lose the level and become a FOH, and vice versa, and a BD can still become a FOL, and vice versa. This is critical to see for example if traders that are trapped in that timeframe with a FOH or FOL are released. An inside bar stays fixed, though, since no level was hit in that timeframe.
Breakouts (BO): Breakout count 3 longs and 3 shorts.
- 3 Longs (red 3L): Bearish after three breakouts without hitting a previous low.
- 3 Shorts (green 3S): Bullish after three breakdowns without hitting a previous high.
First Countertrend Close (First): Tracks First Red or Green Day.
- First Green (G): After two consecutive red closes.
- First Red (R): After two consecutive green closes.
Options: Customizable font size and label colors.
3. Historic Highs and Lows
Displays historic highs and lows per timeframe for added context, enabling users to track sequences over time.
Timeframes: H4, H8, D, W, M
Options: Customize for timeframes shown, number of historic candles per timeframe, colors, formats, and labels.
4. Previous High and Low Extensions
Displays extended previous levels (high, low, and close) for each timeframe to assess how price trades relative to these levels.
H4: P4H, P4L, P4C
H8: P8H, P8L, P8C
Daily: PDH, PDL, PDC
Weekly: PWH, PWL, PWC
Monthly: PMH, PML, PMC
Options: Fully customizable for timeframes shown, colors, formats, and labels.
5. Breach Lines
Tracks live market reactions (e.g., breakouts or fakeouts) per timeframe for the last previous high or low that was hit, highlighting these levels originating at the breached candle to indicate bias (color-coded).
Red: Bearish below
Green: Bullish above
H4: 4FOL, 4FOH, 4BO, 4BD
H8: 8FOL, 8FOH, 8BO, 8BD
D: dFOL, dFOH, dBO, dBD
W: wFOL, wFOH, wBO, wBD
M: mFOL, mFOH, mBO, mBD
Options: Fully customizable for timeframes shown, colors, formats, and labels.
Overall Options:
Toggle single feature groups on/off.
Customize H8 open/close time as an offset to UTC to be provider independent.
Colour settings con be adjusted for dark or bright backgrounds.
Higher Timeframe Use Case Examples
Example Use Case: Weekly Template Analysis
The Weekly Template is a core concept in Stacey Burke’s trading style. The analysis is conducted on the daily timeframe, focusing on the higher timeframe bias and identifying overextended conditions within the week—such as multiple breakouts and peak formations signaling potential reversals.
In this example, the candles are colored by the TrendPredator FO indicator, which highlights the state of individual candles. This allows for precise evaluation of both the trend state and the developing weekly template. It is a valuable tool for thesis generation before a trading session and for backtesting purposes.
Example Use Case: High Timeframe 5-Star Setup Analysis (Stacey Burke "ain't coming back" ACB Template)
This analysis identifies high-probability trade opportunities when daily breakout or breakdown closes occur near key monthly levels mid-week, signaling overextensions and potentially large parabolic moves. The key signal to look for is a breakout or breakdown close on a Wednesday. This is useful for thesis generation before a session and also for backtesting.
In this example, the TrendPredator FO indicator colors the candles to highlight individual candle states, particularly those that close in breakout or breakdown. Additionally, an indicator is shown on the chart shading every Wednesday, making it easier to visually identify the signals.
5 Star Alerts:
Alerts can be activated for this potential 5-Star setup constellation. The alert is triggered when there is a breakout or breakdown close on a Wednesday.
Further recommendations:
- Higher timeframe context: TPO or volume profile indicators can be used to gain an even better overview.
- Late session trading: Entries later in the session, such as during the 3rd hour of the NY session, offer better analysis and follow-through on setups.
- Entry confirmation: Momentum indicators like VWAP, Supertrend, or EMA are helpful for increasing precision. Additionally, tracking lower timeframe fakeouts can provide powerful confluence. To track those the TrendPredator Fakeout Highlighter (FO), that has been specifically developed for this can be of great help:
Limitations:
Data availability using TradingView has its limitations. The indicator leverages only the real-time data available for the specific timeframe being used. This means it cannot access data from timeframes lower than the one displayed on the chart. For example, if you are on a daily chart, it cannot use H8 data. Additionally, on very low timeframes, the historical availability of data might be limited, making higher timeframe signals unreliable.
To address this, the indicator automatically hides the affected columns in these specific situations, preventing false signals.
Disclaimer
This indicator is for educational purposes only and does not guarantee profits.
None of the information provided shall be considered financial advice.
The indicator does not provide final buy or sell signals but highlights zones for potential setups.
Users are fully responsible for their trading decisions and outcomes.

Dual SuperTrend w VIX Filter - Strategy [presentTrading]Hey everyone! Haven't been here for a long time. Been so busy again in the past 2 months. I recently started working on analyzing the combination of trend strategy and VIX, but didn't get outstanding results after a few tries. Sharing this tool with all of you in case you have better insights.
█ Introduction and How it is Different
The Dual SuperTrend with VIX Filter Strategy combines traditional trend following with market volatility analysis. Unlike conventional SuperTrend strategies that focus solely on price action, this experimental system incorporates VIX (Volatility Index) as an adaptive filter to create a more context-aware trading approach. By analyzing where current volatility stands relative to historical norms, the strategy adjusts to different market environments rather than applying uniform logic across all conditions.
BTCUSD 6hr Long Short Performance
█ Strategy, How it Works: Detailed Explanation
🔶 Dual SuperTrend Core
The strategy uses two SuperTrend indicators with different sensitivity settings:
- SuperTrend 1: Length = 13, Multiplier = 3.5
- SuperTrend 2: Length = 8, Multiplier = 5.0
The SuperTrend calculation follows this process:
1. ATR = Average of max(High-Low, |High-PreviousClose|, |Low-PreviousClose|) over 'length' periods
2. UpperBand = (High+Low)/2 - (Multiplier * ATR)
3. LowerBand = (High+Low)/2 + (Multiplier * ATR)
Trend direction is determined by:
- If Close > previous LowerBand, Trend = Bullish (1)
- If Close < previous UpperBand, Trend = Bearish (-1)
- Otherwise, Trend = previous Trend
🔶 VIX Analysis Framework
The core innovation lies in the VIX analysis system:
1. Statistical Analysis:
- VIX Mean = SMA(VIX, 252)
- VIX Standard Deviation = StdDev(VIX, 252)
- VIX Z-Score = (Current VIX - VIX Mean) / VIX StdDev
2. **Volatility Bands:
- Upper Band 1 = VIX Mean + (2 * VIX StdDev)
- Upper Band 2 = VIX Mean + (3 * VIX StdDev)
- Lower Band 1 = VIX Mean - (2 * VIX StdDev)
- Lower Band 2 = VIX Mean - (3 * VIX StdDev)
3. Volatility Regimes:
- "Very Low Volatility": VIX < Lower Band 1
- "Low Volatility": Lower Band 1 ≤ VIX < Mean
- "Normal Volatility": Mean ≤ VIX < Upper Band 1
- "High Volatility": Upper Band 1 ≤ VIX < Upper Band 2
- "Extreme Volatility": VIX ≥ Upper Band 2
4. VIX Trend Detection:
- VIX EMA = EMA(VIX, 10)
- VIX Rising = VIX > VIX EMA
- VIX Falling = VIX < VIX EMA
Local performance:
🔶 Entry Logic Integration
The strategy combines trend signals with volatility filtering:
Long Entry Condition:
- Both SuperTrend 1 AND SuperTrend 2 must be bullish (trend = 1)
- AND selected VIX filter condition must be satisfied
Short Entry Condition:
- Both SuperTrend 1 AND SuperTrend 2 must be bearish (trend = -1)
- AND selected VIX filter condition must be satisfied
Available VIX filter rules include:
- "Below Mean + SD": VIX < Lower Band 1
- "Below Mean": VIX < VIX Mean
- "Above Mean": VIX > VIX Mean
- "Above Mean + SD": VIX > Upper Band 1
- "Falling VIX": VIX < VIX EMA
- "Rising VIX": VIX > VIX EMA
- "Any": No VIX filtering
█ Trade Direction
The strategy allows testing in three modes:
1. **Long Only:** Test volatility effects on uptrends only
2. **Short Only:** Examine volatility's impact on downtrends only
3. **Both (Default):** Compare how volatility affects both trend directions
This enables comparative analysis of how volatility regimes impact bullish versus bearish markets differently.
█ Usage
Use this strategy as an experimental framework:
1. Form a hypothesis about how volatility affects trend reliability
2. Configure VIX filters to test your specific hypothesis
3. Analyze performance across different volatility regimes
4. Compare results between uptrends and downtrends
5. Refine your volatility filtering approach based on results
6. Share your findings with the trading community
This framework allows you to investigate questions like:
- Are uptrends more reliable during rising or falling volatility?
- Do downtrends perform better when volatility is above or below its historical average?
- Should different volatility filters be applied to long vs. short positions?
█ Default Settings
The default settings serve as a starting point for exploration:
SuperTrend Parameters:
- SuperTrend 1 (Length=13, Multiplier=3.5): More responsive to trend changes
- SuperTrend 2 (Length=8, Multiplier=5.0): More selective filter requiring stronger trends
VIX Analysis Settings:
- Lookback Period = 252: Establishes a full market cycle for volatility context
- Standard Deviation Bands = 2 and 3 SD: Creates statistically significant regime boundaries
- VIX Trend Period = 10: Balances responsiveness with noise reduction
Default VIX Filter Selection:
- Long Entry: "Above Mean" - Tests if uptrends perform better during above-average volatility
- Short Entry: "Rising VIX" - Tests if downtrends accelerate when volatility is increasing
Feel Free to share your insight below!!!

Whale Buy Activity Detector (Real-Time)Whale Buy Activity Detector (Real-Time)
This indicator helps to identify abnormal spikes in the volume of purchases, which may indicate the activity of large players ("whales"). It analyzes the volume of purchases and compares it with the average volume over a certain period of time. If the volume of purchases exceeds a set threshold, the indicator marks this as potential whale activity.
Basic parameters:
Volume Threshold (x Average): The coefficient by which the current purchase volume must exceed the average volume in order to be considered abnormal. The default value is 2.0, which means that the purchase volume should be 2 times the average volume for the selected time period. This parameter can be adjusted in the range from 1.0 and higher in increments of 0.1.
Example: If you set the value to 1.5, the indicator will mark situations when the volume of purchases exceeds the average volume by 1.5 times.
Lookback Period: The time period used to calculate the average purchase volume. The default value is 20, which means that the average purchase volume will be calculated for the last 20 candles. This parameter can be set in the range from 1 and above.Example: If you set the value to 10, the average purchase volume will be calculated for the last 10 candles.
How to use:
Buy Volume: Shows the volume of purchases on each candle. This is the volume that was sold at a price higher than the opening price of the candle.
Average Buy Volume: The average volume of purchases over a given time period (Lookback Period). This parameter helps to determine the "normal" level of purchase volume.
Whale Buy: Notes abnormal spikes in the volume of purchases, which may indicate the activity of "whales". The indicator draws a mark on the top of the candle when the purchase volume exceeds the threshold set by the Volume Threshold parameter.
Notifications:
The indicator can send notifications when an abnormal volume of purchases is detected. You can set up notifications via the TradingView menu to receive real-time alerts.
Usage example:
If you are trading in a highly volatile market, you can increase the Volume Threshold to filter out small volume spikes.
If you trade in a low-volatility market, you can reduce the Volume Threshold to capture even small anomalies.

Fakeout, Breakout & Trend Switch Detector - TrendPredator FOTrendPredator Fakeout Highlighter (FO)
The TrendPredator Fakeout Highlighter is designed to enhance multi-timeframe trend analysis by identifying key market behaviors that indicate trend strength, weakness, and potential reversals. Inspired by Stacey Burke’s trading approach, this tool focuses on trend-following, momentum shifts, and trader traps, helping traders capitalize on high-probability setups.
At its core, this indicator highlights peak formations—anchor points where price often locks in trapped traders before making decisive moves. These principles align with George Douglas Taylor’s 3-day cycle and Steve Mauro’s BTMM method, making the FO Highlighter a powerful tool for reading market structure. As markets are fractal, this analysis works on any timeframe.
How It Works
The TrendPredator FO highlights key price action signals by coloring candles based on their bias state on the current timeframe.
It tracks four major elements:
Breakout/Breakdown Bars – Did the candle close in a breakout or breakdown relative to the last candle?
Fakeout Bars (Trend Close) – Did the candle break a prior high/low and close back inside, but still in line with the trend?
Fakeout Bars (Counter-Trend Close) – Did the candle break a prior high/low, close back inside, and against the trend?
Switch Bars – Did the candle lose/ reclaim the breakout/down level of the last bar that closed in breakout/down, signalling a possible trend shift?
Reading the Trend with TrendPredator FO
The annotations in this example are added manually for illustration.
- Breakouts → Strong Trend
Multiple candles closing in breakout signal a healthy and strong trend.
- Fakeouts (Trend Close) → First Signs of Weakness
Candles that break out but close back inside suggest a potential slowdown—especially near key levels.
- Fakeouts (Counter-Trend Close) → Stronger Reversal Signal
Closing against the trend strengthens the reversal signal.
- Switch Bars → Momentum Shift
A shift in trend is confirmed when price crosses back through the last closed breakout candles breakout level, trapping traders and fuelling a move in the opposite direction.
- Breakdowns → Trend Reversal Confirmed
Once price breaks away from the peak formation, closing in breakdown, the trend shift is validated.
Customization & Settings
- Toggle individual candle types on/off
- Customize colors for each signal
- Set the number of historical candles displayed
Example Use Cases
1. Weekly Template Analysis
The weekly template is a core concept in Stacey Burke’s trading style. FO highlights individual candle states. With this the state of the trend and the developing weekly template can be evaluated precisely. The analysis is done on the daily timeframe and we are looking especially for overextended situations within a week, after multiple breakouts and for peak formations signalling potential reversals. This is helpful for thesis generation before a session and also for backtesting. The annotations in this example are added manually for illustration.
📈 Example: Weekly Template Analysis snapshot on daily timeframe
2. High Timeframe 5-Star Setup Analysis (Stacey Burke "ain't coming back" ACB Template)
This analysis identifies high-probability trade opportunities when daily breakout or down closes occur near key monthly levels mid-week, signalling overextensions and potentially large parabolic moves. Key signals for this are breakout or down closes occurring on a Wednesday. This is helpful for thesis generation before a session and also for backtesting. The annotations in this example are added manually for illustration. Also an indicator can bee seen on this chart shading every Wednesday to identify the signal.
📉 Example: High Timeframe Setup snapshot
3. Low Timeframe Entry Confirmation
FO helps confirm entry signals after a setup is identified, allowing traders to time their entries and exits more precisely. For this the highlighted Switch and/ or Fakeout bars can be highly valuable.
📊 Example (M15 Entry & Exit): Entry and Exit Confirmation snapshot
📊 Example (M5 Scale-In Strategy): Scaling Entries snapshot
The annotations in this examples are added manually for illustration.
Disclaimer
This indicator is for educational purposes only and does not guarantee profits.
None of the information provided shall be considered financial advice.
Users are fully responsible for their trading decisions and outcomes.

Market Trend Levels Detector [BigBeluga]Market Trend Levels Detector is an trend-following tool that utilizes moving average crossovers to identify key market trend levels. By detecting local highs and lows after EMA crossovers, the indicator helps traders track significant price zones and trend strength.
🔵 Key Features:
EMA Crossover-Based Trend Levels Detection:
Uses a fast and slow EMA to detect market flow shifts.
When the fast EMA crosses under the slow EMA, the indicator searches for the most recent local top and marks it with a label and horizontal level.
When the fast EMA crosses over the slow EMA, it searches for the most recent local low and marks it accordingly.
Dynamic Zone Levels:
Each detected high or low is plotted as a horizontal level, highlighting important price zones.
Traders can extend these levels to observe how price interacts with them over time.
If price crosses a level, its extension stops. Uncrossed levels continue expanding.
Gradient Trend Band Visualization:
The trend band is formed by shading the area between the two EMAs.
Color intensity varies based on volatility and trend strength.
Strong trends and high volatility areas appear with more intense colors, making trend shifts visually distinct.
🔵 Usage:
Trend Identification: Use EMA crossovers and trend bands to confirm bullish or bearish momentum.
Key Zone Mapping: Observe local high/low levels to track historical reaction points.
Breakout & Rejection Signals: Monitor price interactions with extended levels to assess potential breakouts or reversals.
Volatility Strength Analysis: Use color intensity in the trend band to gauge trend power and possible exhaustion points.
Scalping & Swing Trading: Ideal for both short-term scalping strategies and larger swing trade setups.
Market Trend Levels Detector is a must-have tool for traders looking to track market flow, key price levels, and trend momentum with dynamic visual cues. It provides a comprehensive approach to identifying high-probability trade setups using EMA-based flow detection and trend analysis.

[COG]TMS Crossfire 🔍 TMS Crossfire: Guide to Parameters
📊 Core Parameters
🔸 Stochastic Settings (K, D, Period)
- **What it does**: These control how the first stochastic oscillator works. Think of it as measuring momentum speed.
- **K**: Determines how smooth the main stochastic line is. Lower values (1-3) react quickly, higher values (3-9) are smoother.
- **D**: Controls the smoothness of the signal line. Usually kept equal to or slightly higher than K.
- **Period**: How many candles are used to calculate the stochastic. Standard is 14 days, lower for faster signals.
- **For beginners**: Start with the defaults (K:3, D:3, Period:14) until you understand how they work.
🔸 Second Stochastic (K2, D2, Period2)
- **What it does**: Creates a second, independent stochastic for stronger confirmation.
- **How to use**: Can be set identical to the first one, or with slightly different values for dual confirmation.
- **For beginners**: Start with the same values as the first stochastic, then experiment.
🔸 RSI Length
- **What it does**: Controls the period for the RSI calculation, which measures buying/selling pressure.
- **Lower values** (7-9): More sensitive, good for short-term trading
- **Higher values** (14-21): More stable, better for swing trading
- **For beginners**: The default of 11 is a good balance between speed and reliability.
🔸 Cross Level
- **What it does**: The centerline where crosses generate signals (default is 50).
- **Traditional levels**: Stochastics typically use 20/80, but 50 works well for this combined indicator.
- **For beginners**: Keep at 50 to focus on trend following strategies.
🔸 Source
- **What it does**: Determines which price data is used for calculations.
- **Common options**:
- Close: Most common and reliable
- Open: Less common
- High/Low: Used for specialized indicators
- **For beginners**: Stick with "close" as it's most commonly used and reliable.
🎨 Visual Theme Settings
🔸 Bullish/Bearish Main
- **What it does**: Sets the overall color scheme for bullish (up) and bearish (down) movements.
- **For beginners**: Green for bullish and red for bearish is intuitive, but choose any colors that are easy for you to distinguish.
🔸 Bullish/Bearish Entry
- **What it does**: Colors for the entry signals shown directly on the chart.
- **For beginners**: Use bright, attention-grabbing colors that stand out from your chart background.
🌈 Line Colors
🔸 K1, K2, RSI (Bullish/Bearish)
- **What it does**: Controls the colors of each indicator line based on market direction.
- **For beginners**: Use different colors for each line so you can quickly identify which line is which.
⏱️ HTF (Higher Timeframe) Settings
🔸 HTF Timeframe
- **What it does**: Sets which higher timeframe to use for filtering (e.g., 240 = 4 hour chart).
- **How to choose**: Should be at least 4x your current chart timeframe (e.g., if trading on 15min, use 60min or higher).
- **For beginners**: Start with a timeframe 4x higher than your trading chart.
🔸 Use HTF Filter
- **What it does**: Toggles whether the higher timeframe filter is applied or not.
- **For beginners**: Keep enabled to reduce false signals, especially when learning.
🔸 HTF Confirmation Bars
- **What it does**: How many bars must confirm a trend change on higher timeframe.
- **Higher values**: More reliable but slower to react
- **Lower values**: Faster signals but more false positives
- **For beginners**: Start with 2-3 bars for a good balance.
📈 EMA Settings
🔸 Use EMA Filter
- **What it does**: Toggles price filtering with an Exponential Moving Average.
- **For beginners**: Keep enabled for better trend confirmation.
🔸 EMA Period
- **What it does**: Length of the EMA for filtering (shorter = faster reactions).
- **Common values**:
- 5-13: Short-term trends
- 21-50: Medium-term trends
- 100-200: Long-term trends
- **For beginners**: 5-10 is good for short-term trading, 21 for swing trading.
🔸 EMA Offset
- **What it does**: Shifts the EMA forward or backward on the chart.
- **For beginners**: Start with 0 and adjust only if needed for visual clarity.
🔸 Show EMA on Chart
- **What it does**: Toggles whether the EMA appears on your main price chart.
- **For beginners**: Keep enabled to see how price relates to the EMA.
🔸 EMA Color, Style, Width, Transparency
- **What it does**: Customizes how the EMA line looks on your chart.
- **For beginners**: Choose settings that make the EMA visible but not distracting.
🌊 Trend Filter Settings
🔸 Use EMA Trend Filter
- **What it does**: Enables a multi-EMA system that defines the overall market trend.
- **For beginners**: Keep enabled for stronger trend confirmation.
🔸 Show Trend EMAs
- **What it does**: Toggles visibility of the trend EMAs on your chart.
- **For beginners**: Enable to see how price moves relative to multiple EMAs.
🔸 EMA Line Thickness
- **What it does**: Controls how the thickness of EMA lines is determined.
- **Options**:
- Uniform: All EMAs have the same thickness
- Variable: Each EMA has its own custom thickness
- Hierarchical: Automatically sized based on period (longer periods = thicker)
- **For beginners**: "Hierarchical" is most intuitive as longer-term EMAs appear more dominant.
🔸 EMA Line Style
- **What it does**: Sets the line style (solid, dotted, dashed) for all EMAs.
- **For beginners**: "Solid" is usually clearest unless you have many lines overlapping.
🎭 Trend Filter Colors/Width
🔸 EMA Colors (8, 21, 34, 55)
- **What it does**: Sets the color for each individual trend EMA.
- **For beginners**: Use a logical progression (e.g., shorter EMAs brighter, longer EMAs darker).
🔸 EMA Width Settings
- **What it does**: Controls the thickness of each EMA line.
- **For beginners**: Thicker lines for longer EMAs make them easier to distinguish.
🔔 How These Parameters Work Together
The power of this indicator comes from how these components interact:
1. **Base Oscillator**: The stochastic and RSI components create the main oscillator
2. **HTF Filter**: The higher timeframe filter prevents trading against larger trends
3. **EMA Filter**: The EMA filter confirms signals with price action
4. **Trend System**: The multi-EMA system identifies the overall market environment
Think of it as multiple layers of confirmation, each adding more reliability to your trading signals.
💡 Tips for Beginners
1. **Start with defaults**: Use the default settings first and understand what each element does
2. **One change at a time**: When customizing, change only one parameter at a time
3. **Keep notes**: Write down how each change affects your results
4. **Backtest thoroughly**: Test any changes on historical data before trading real money
5. **Less is more**: Sometimes simpler settings work better than complicated ones
Remember, no indicator is perfect - always combine this with proper risk management and other forms of analysis!

Shark 32 Pattern ProHello Traders!
The Shark32 pattern comprises multiple inside bars —each candle’s high/low is contained within the previous candle’s range—creating a tight consolidation zone. Once price breaks out, volatility frequently expands, producing sharper moves. The pattern is known for its relatively high continuation rate and the ability to offer tight risk/reward setups. It also calculates statistics, highlights stop/target levels, and offers fully customizable visuals so you can adapt the tool to your trading style.
Key Features :
Detects Shark 32 With Unlimited Inside Bars:
Automatically spots consecutive inside candles (not limited to just two), enabling you to catch more nuanced patterns.
Highlights Breakout:
Clear visual lines and labels mark where price breaks above/below the pattern boundary.
Stop-Loss & Profit Targets:
Draws a suggested stop-loss line and a projected target line, helping you manage risk and set profit objectives quickly.
Statistics & Analysis:
A built-in statistics table tracks pattern frequency, breakouts, stop-hits, target-hits, and more—helping you refine your strategy over time.
Fully Customizable Visuals:
Control line styles, colors, breakout labels, box fill, and more to fit your preference or chart theme.
Quick Resolutions:
This pattern forms fast and typically resolves within just a few bars, appealing to short-term traders.
Statistics at a Glance (based on Bulkowski's studies):
Continuation Bias : ~60% continuation bias.
Measured Move : 70%+ of bullish breakouts (in bull markets) reach the measured move.
Throwback : ~64% chance price retraces to the breakout level after an upside break.
Trend Alignment : Historically, success rates improve when trading in line with the larger trend.
How to Trade with This Indicator :
Identifying the Pattern : Wait till a Shark 32 pattern is formed.
Entry Rule : Enter on a confirmed close above the pattern high (for bullish) or below the pattern low (for bearish).
Stop Placement : Place stops a few ticks beyond the opposite side of the pattern. Tight ranges = small risk. Or use the mid-range of the pattern as a stop level.
Target Options : Aim for Risk/Reward Ratio of 2R or 3R to capture a strong follow-through. Alternatively, use the measured move of the first bar's height as a target.
Tips for Better Reliability:
Trend Alignment : Shark 32 breakouts usually work best in the direction of the broader market or trend.
Confirmation : Look for a significant volume increase at the breakout—helps filter out “fake” moves.
Throwback Awareness : ~64% of upside breakouts retest the pattern boundary; stay patient if you see a pullback.
Risk Management : Maintain tight stops and consider using alerts for activation/breakout signals.
Why This Indicator?
Clear Visuals : Highlights the pattern boundary, breakout lines, and potential stop/target levels.
Customizable : Lets you adjust line styles, risk parameters, alerts, and statistics display.
Statistical Edge : Built-in table aggregates pattern counts, success/failure rates, and average durations.
Final Thoughts:
This Shark 32 Pro indicator gives you a systematic way to spot—and trade—a compact yet powerful three-candle formation. Combine it with solid risk management and trend analysis for best results. Monitor volume and confirm breakouts with a candle close beyond the pattern’s range. While the pattern can fail, tight stops and clear targets help keep your trading efficient and disciplined.
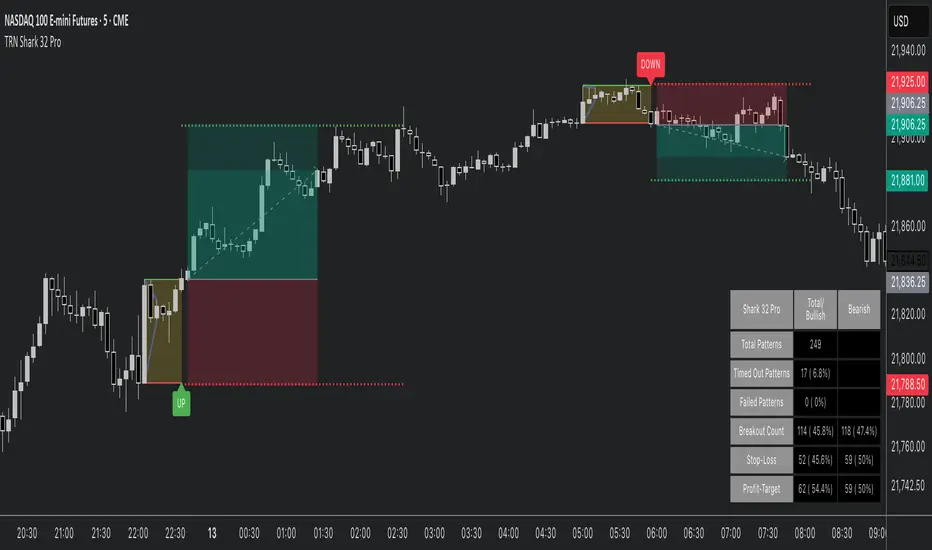
Tillson T3 Moving Average (improved)T3 Moving Average – Advanced Smoothing for Trend Analysis
Overview
The Tillson T3 Moving Average (T3 MA) is a superior smoothing moving average that reduces lag while maintaining responsiveness to price changes. Unlike traditional moving averages such as SMA, EMA, or WMA, the T3 applies multiple levels of smoothing, making it more adaptive to market conditions.
How It Works
The T3 MA is an exponentially smoothed moving average with a factor that controls the level of smoothing. This multi-layered smoothing process allows it to:
✅ React faster than a standard EMA while still filtering out market noise.
✅ Smooth out price fluctuations better than SMA or WMA, reducing false signals.
✅ Reduce lag compared to traditional moving averages, making it useful for both trend identification and entry/exit decisions.
How to Use This Script
🔹 Trend Identification – Use T3 MA as a dynamic trend filter. Price above T3 signals an uptrend, while price below signals a downtrend.
🔹 Direction Signal – The direction of the T3 MA (i.e. sloping upwards or downwards) can itself be used as a signal. The script allows the MA line to be colored, so it's easier to spot.
🔹 Crossover Signals – Combine T3 with another moving average (e.g., a shorter T3 or EMA, SMA, etc.) to generate trade signals when they cross.
🔹 Support & Resistance – The T3 can act as dynamic support and resistance in trending markets.
Features of This Script
✅ Custom Source Selection – Apply T3 not just to price, but also to any indicator (e.g., RSI, volume, etc.).
✅ Customizable Length & Smoothing – Adjust how smooth and responsive the T3 MA is.
✅ Optional Color Changes – The T3 MA can dynamically change color based on trend direction, making it easier to read.
✅ Versatile for Any Strategy – Works well in trend-following, mean-reversion, and breakout trading systems.
This script is ideal for traders looking for a smoother, more adaptive moving average that reduces noise while remaining reactive to price action. 🚀
Chaikin Money Flow with Moving AverageThis indicator combines the Chaikin Money Flow (CMF) with a moving average, helping traders analyze buying/selling pressure and whether it's increasing or decreasing.
What It Does:
Chaikin Money Flow (CMF) developed by Marc Chaikin is a volume-weighted average of accumulation and distribution over a specified period.
A moving average is applied to CMF to reduce noise and smooth trends, making it easier to identify sustained market sentiment shifts.
How to Use It?
CMF helps confirm trend strength and potential reversals. We reduces false signals from CMF by smoothing fluctuations and making it easier to spot trends.
A CMF value above zero is a sign of strength, and a value below zero is a sign of weakness.
A rising price with a falling CMF (below moving average) is a bearish divergence and a possible reversal of the uptrend.
Similarly, a falling price with a rising CMF (above moving average) is a bullish divergence and again signals a possible reversal of the downtrend.
Configurable Parameters:
CMF Length: Adjusts how many periods are used for CMF calculation.
MA Type: Choose between SMA, EMA, WMA, VWMA, or T3 for smoothing.
MA Length: Controls how much smoothing is applied.
This tool is great for traders looking to improve volume-based trend analysis while filtering out short-term noise.

ADX with Moving AverageADX with Moving Average is a powerful indicator that enhances trend analysis by combining the standard Average Directional Index (ADX) with a configurable moving average.
The ADX helps traders identify the strength of a trend. In general:
ADX 0-20 – Absent or Weak Trend
ADX 25-50 – Strong Trend
ADX 50-75 – Very Strong Trend
ADX 75-100 – Extremely Strong Trend
By adding a moving average we can judge if the ADX itself is trending upwards or downwards, i.e. if a new trend is emerging or an existing one is weakening.
This combination allows traders to better confirm strong trends and filter out weak or choppy market conditions.
Key Features & Customization:
✔ Configurable DI & ADX Lengths – Adjust how quickly the ADX reacts to price movements (default: 14, 14).
✔ Multiple Moving Average Options – Choose between SMA, EMA, WMA, VWMA, or T3 for trend confirmation.
✔ Custom MA Length – Fine-tune the sensitivity of the moving average to match your strategy.
🔹 Use this indicator to confirm strong trends before entering trades, filter out false signals, or refine existing strategies with a dynamic trend-strength component. 🚀

Blockchain Fundamentals: Liquidity Cycle MomentumLiquidity Cycle Momentum Indicator
Overview:
This indicator analyzes global liquidity trends by calculating a unique Liquidity Index and measuring its year-over-year (YoY) percentage change. It then applies a momentum oscillator to the YoY change, providing insights into the cyclical momentum of liquidity. The indicator incorporates a limited historical data workaround to ensure accurate calculations even when the chart’s history is short.
Features Breakdown:
1. Limited Historical Data Workaround
Function: The limit(length) function adjusts the lookback period when there isn’t enough historical data (i.e., near the beginning of the chart), ensuring that calculations do not break due to insufficient data.
2. Global Liquidity Calculation
Data Sources:
TVC:CN10Y (10-year yield from China)
TVC:DXY (US Dollar Index)
ECONOMICS:USCBBS (US Central Bank Balance Sheet)
FRED:JPNASSETS (Japanese assets)
ECONOMICS:CNCBBS (Chinese Central Bank Balance Sheet)
FRED:ECBASSETSW (ECB assets)
Calculation Methodology:
A ratio is computed (cn10y / dxy) to adjust for currency influences.
The Liquidity Index is then derived by multiplying this ratio with the sum of the other liquidity components.
3. Year-over-Year (YoY) Percent Change
Computation:
The indicator determines the number of bars that approximately represent one year.
It then compares the current Liquidity Index to its value one year ago, calculating the YoY percentage change.
4. Momentum Oscillator on YoY Change
Oscillator Components:
1. Calculated using the Chande Momentum Oscillator (CMO) applied to the YoY percent change with a user-defined momentum length.
2. A weighted moving average (WMA) that smooths the momentum signal.
3. Overbought and Oversold zones
Signal Generation:
Buy Signal: Triggered when the momentum crosses upward from an oversold condition, suggesting a potential upward shift in liquidity momentum.
Sell Signal: Triggered when crosses below an overbought condition, indicating potential downward momentum.
State Management:
The indicator maintains a state variable to avoid repeated signals, ensuring that a new buy or sell signal is only generated when there’s a clear change in momentum.
5. Visual Presentation and Alerts
Plots:
The oscillator value and signalline are plotted for visual analysis.
Overbought and oversold levels are marked with dashed horizontal lines.
Signal Markers:
Buy and sell signals are marked with green and maroon circles, respectively.
Background Coloration:
Optionally, the chart’s background bars are colored (yellow for buy signals and fuchsia for sell signals) to enhance visual cues when signals are triggered.
Conclusion
In summary, the Liquidity Cycle Momentum Indicator provides a robust framework to analyze liquidity trends by combining global liquidity data, YoY changes, and momentum oscillation. This makes it an effective tool for traders and analysts looking to identify cyclical shifts in liquidity conditions and potential turning points in the market.

Price Action Trend and Margin EquityThe Price Action Trend and Margin Equity indicator is a multifunctional market analysis tool that combines elements of money management and price pattern analysis. The indicator helps traders identify key price action patterns and determine optimal entry, exit and stop loss levels based on the current trend.
The main components of the indicator:
Money Management:
Allows the trader to set risk management parameters such as the percentage of possible loss on the position, the use of fixed leverage and the total capital.
Calculates the required leverage level to achieve a specified percentage of loss.
Price Action:
Correctly identifies various price patterns such as Pin Bar, Engulfing Bar, PPR Bar and Inside Bar.
Displays these patterns on the chart with the ability to customize candle colors and display styles.
Allows the trader to customize take profit and stop loss points to display them on the chart.
The ability to display patterns only in the direction of the trend.
Trend: (some code taken from ChartPrime)
Uses a trend cloud to visualize the current market direction.
The trend cloud is displayed on the chart and helps traders determine whether the market is in an uptrend or a downtrend.
Alert:
Allows you to set an alert that will be triggered when the pattern is formed.
Example of use:
Let's say a trader uses the indicator to trade the crypto market. He sets the money management parameters, setting the maximum loss per position to 5% and using a fixed leverage of 1:100. The indicator automatically calculates the required position size to meet these parameters ($: on the label). Or displays the leverage (X: on the label) to achieve the required risk.
The trader receives an alert when a Pin Bar is formed. The indicator displays the entry, exit, and stop loss levels based on this pattern. The trader opens a position for the recommended amount in the direction indicated by the indicator and sets the stop loss and take profit at the recommended levels.
General Settings:
Position Loss Percentage: Sets the maximum loss percentage you are willing to take on a single position.
Use Fixed Leverage: Enables or disables the use of fixed leverage.
Fixed Leverage: Sets the fixed leverage level.
Total Equity: Specifies the total equity you are using for trading. (Required for calculation when using fixed leverage)
Turn Patterns On/Off: You can turn on or off the display of various price patterns such as Pin Bar, Outside Bar (Engulfing), Inside Bar, and PPR Bar.
Pattern Colors: Sets the colors for displaying each pattern on the chart.
Candle Color: Allows you to set a neutral color for candles that do not match the price action.
Show Lines: Allows you to turn on or off the display of labels and lines.
Line Length: Sets the length of the stop, entry, and take profit lines.
Label color: One color for all labels (configured below) or the color of the labels in the color of the candle pattern.
Pin entry: Select the entry point for the pin bar: candle head, bar close, or 50% of the candle.
Coefficients for stop and take lines.
Use trend for price action: When enabled, will show price action signals only in the direction of the trend.
Display trend cloud: Enables or disables the display of the trend cloud.
Cloud calculation period: Sets the period for which the maximum and minimum values for the cloud are calculated. The longer the period, the smoother the cloud will be.
Cloud colors: Sets the colors for uptrends and downtrends, as well as the transparency of the cloud.
The logic of the indicator:
Pin Bar is a candle with a long upper or lower shadow and a short body.
Logic: If the length of one shadow is twice the body and the opposite shadow of the candle, it is considered a Pin Bar.
An Inside Bar is a candle that is completely engulfed by the previous candle.
Logic: If the high and low of the current candle are inside the previous candle, it is an Inside Bar.
An Outside Bar or Engulfing is a candle that completely engulfs the previous candle.
Logic: If the high and low of the current candle are outside the previous candle and close outside the previous candle, it is an Outside Bar.
A PPR Bar is a candle that closes above or below the previous candle.
Logic: If the current candle closes above the high of the previous candle or below its low, it is a PPR Bar.
Stop Loss Levels: Calculated based on the specified ratios. If set to 1.0, it shows the correct stop for the pattern by pushing away from the entry point.
Take Profit Levels: Calculated based on the specified ratios.
Create a Label: The label is created at the stop loss level and contains information about the potential leverage and loss.
The formula for calculating the $ value is:
=(Total Capital x (Maximum Loss Percentage on Position/100)) / (Difference between Entry Level and Stop Loss Level × Ratio that sets the stop loss level relative to the length of the candlestick shadow × Fixed Leverage Value) .
Labels contain the following information:
The percentage of price change from the recommended entry point to the stop loss level.
Required Leverage (X: ): The amount of leverage required to achieve the specified loss percentage. (Or a fixed value if selected).
Required Capital ($: ): The amount of capital required to open a position with the specified leverage and loss percentage (only displayed when using fixed leverage).
The trend cloud identifies the maximum and minimum price values for the specified period.
The cloud value is set depending on whether the current price is equal to the high or low values.
If the current closing price is equal to the high value, the cloud is set at the low value, and vice versa.
RU
Индикатор "Price Action Trend and Margin Equity" представляет собой многофункциональный инструмент для анализа рынка, объединяющий в себе элементы управления капиталом и анализа ценовых паттернов. Индикатор помогает трейдерам идентифицировать ключевые прайс экшн паттерны и определять оптимальные уровни входа, выхода и стоп-лосс на основе текущего тренда.
Основные компоненты индикатора:
Управление капиталом:
Позволяет трейдеру задавать параметры управления рисками, такие как процент возможного убытка по позиции, использование фиксированного плеча и общий капитал.
Рассчитывает необходимый уровень плеча для достижения заданного процента убытка.
Price Action:
Правильно идентифицирует различные ценовые паттерны, такие как Pin Bar, Поглащение Бар, PPR Bar и Внутренний Бар.
Отображает эти паттерны на графике с возможностью настройки цветов свечей и стилей отображения.
Позволяет трейдеру настраивать точки тейк профита и стоп лосса для отображения их на графике.
Возможность отображения паттернов только в натправлении тренда.
Trend: (часть кода взята у ChartPrime)
Использует облако тренда для визуализации текущего направления рынка.
Облако тренда отображается на графике и помогает трейдерам определить, находится ли рынок в восходящем или нисходящем тренде.
Оповещение:
Дает возможность установить оповещение которое будет срабатывать при формировании паттерна.
Пример применения:
Предположим, трейдер использует индикатор для торговли на крипто рынке. Он настраивает параметры управления капиталом, устанавливая максимальный убыток по позиции в 5% и используя фиксированное плечо 1:100. Индикатор автоматически рассчитывает необходимый объем позиции для соблюдения этих параметров ($: на лейбле). Или отображает плечо (Х: на лейбле) для достижения необходимого риска.
Трейдер получает оповещение о формировании Pin Bar. Индикатор отображает уровни входа, выхода и стоп-лосс, основанные на этом паттерне. Трейдер открывает позицию на рекомендуемую сумму в направлении, указанном индикатором, и устанавливает стоп-лосс и тейк-профит на рекомендованных уровнях.
Общие настройки:
Процент убытка по позиции: Устанавливает максимальный процент убытка, который вы готовы понести по одной позиции.
Использовать фиксированное плечо: Включает или отключает использование фиксированного плеча.
Уровень фиксированного плеча: Задает уровень фиксированного плеча.
Общий капитал: Указывает общий капитал, который вы используете для торговли. (Необходим для расчета при использовании фиксированного плеча)
Включение/отключение паттернов: Вы можете включить или отключить отображение различных ценовых паттернов, таких как Pin Bar, Outside Bar (Поглощение), Inside Bar и PPR Bar.
Цвета паттернов: Задает цвета для отображения каждого паттерна на графике.
Цвет свечей: Позволяет задать нейтральный цвет для свечей неподходящих под прйс экшн.
Показывать линии: Позволяет включить или отключить отображение лейблов и линий.
Длинна линий: Настройка длинны линий стопа, линии входа и тейк профита.
Цвет лейбла: Один цвет для всех лейблов (настраивается ниже) или цвет лейблов в цвет паттерна свечи.
Вход в пин: Выбор точки входа для пин бара: голова свечи, точка закрытия бара или 50% свечи.
Коэффиценты для стоп и тейк линий.
Использовать тренд для прайс экшна: При включении будет показывать прайс экшн сигналы только в направлении тренда.
Отображение облака тренда: Включает или отключает отображение облака тренда.
Период расчета облака: Устанавливает период, за который рассчитываются максимальные и минимальные значения для облака. Чем больше период, тем более сглаженным будет облако.
Цвета облака: Задает цвета для восходящего и нисходящего трендов, а также прозрачность облака.
Логика работы индикатора:
Pin Bar — это свеча с длинной верхней или нижней тенью и коротким телом.
Логика: Если длина одной тени вдвое больше тела и противоположной тени свечи, считается, что это Pin Bar.
Inside Bar — это свеча, полностью поглощенная предыдущей свечой.
Логика: Если максимум и минимум текущей свечи находятся внутри предыдущей свечи, это Inside Bar.
Outside Bar или Поглощение — это свеча, которая полностью поглощает предыдущую свечу.
Логика: Если максимум и минимум текущей свечи выходят за пределы предыдущей свечи и закрывается за пределами предыдущей свечи, это Outside Bar.
PPR Bar — это свеча, которая закрывается выше или ниже предыдущей свечи.
Логика: Если текущая свеча закрывается выше максимума предыдущей свечи или ниже ее минимума, это PPR Bar.
Уровни стоп-лосс: Рассчитываются на основе заданных коэффициентов. При значении 1.0 показывает правильный стоп для паттерна отталкиваясь от точки входа.
Уровки тейк-профита: Рассчитываются на основе заданных коэффициентов.
Создание метки: Метка создается на уровне стоп-лосс и содержит информацию о потенциальном плече и убытке.
Формула для вычисления значения $:
=(Общий капитал x (Максимальный процент убытка по позиции/100)) / (Разница между уровнем входа и уровнем стоп-лосс × Коэффициент, задающий уровень стоп-лосс относительно длины тени свечи × Значение фиксированного плеча).
Метки содержат следующую информацию:
Процент изменения цены от рекомендованной точки входа до уровня стоп-лосс.
Необходимое плечо (Х: ): Уровень плеча, необходимый для достижения заданного процента убытка. (Или фиксированное значение если оно выбрано).
Необходимый капитал ($: ): Сумма капитала, необходимая для открытия позиции с заданным плечом и процентом убытка (отображается только при использовании фиксированного плеча).
Облако тренда определяет максимальные и минимальные значения цены за указанный период.
Значение облака устанавливается в зависимости от того, совпадает ли текущая цена с максимальными или минимальными значениями.
Если текущая цена закрытия равна максимальному значению, облако устанавливается на уровне минимального значения, и наоборот.

HTF Trend IdentificationThis indicator identifies higher timeframe (HTF) trends and plots them on the chart. It uses a fixed higher timeframe input and a selectable source to calculate the HTF value. The indicator also plots an EMA and colors the candles based on the HTF trend and EMA crossover.
**Features:**
* **HTF Trend Identification:** Calculates and plots a higher timeframe trend based on a user-defined source and fixed timeframe. This allows you to visualize the larger trend context on your current chart.
* **Repainting Option:** Provides a toggle to control whether the HTF calculation repaints. Disabling repainting ensures that past HTF signals remain fixed, but may introduce a slight lag. Enabling repainting provides more up-to-date signals, but can cause past signals to change.
* **Customizable Colors:** Allows users to set custom colors for uptrends and downtrends.
* **EMA Plot:** Includes an Exponential Moving Average (EMA) plot with a customizable length and offset. The EMA color changes based on the HTF trend.
* **Candle Coloring:** Colors the candles based on the HTF trend, providing a clear visual representation of the overall trend direction.
* **Alerts:** (This would require adding alert conditions to the code, which I can do if you'd like) Could be extended to include alerts for HTF trend changes or EMA crossovers.
**Inputs:**
* **Repainting:** On/Off toggle to control repainting of the HTF calculation.
* **Source:** Select the source for HTF calculations (e.g., close, open, high, low, etc.).
* **Fixed Higher Timeframe:** Set the higher timeframe for trend calculation (e.g., 1D, 4H, 1W). *Note: Timeframes smaller than the current chart's timeframe are not allowed.*
* **Up Color:** Color for uptrends.
* **Down Color:** Color for downtrends.
* **EMA Length 1:** Length of the EMA.
* **Offset:** Offset for the EMA plot.
**How to Use:**
1. Add the indicator to your chart.
2. Configure the inputs to your desired settings.
3. Observe the plotted HTF trend line, EMA, and candle colors to identify potential trading opportunities.
**Limitations:**
* **Repainting:** Enabling repainting can cause past HTF signals to change. Use with caution.
* **No Alerts (by default):** This version does not include alerts. However, this can be added if requested.
**Author:** atulgalande75
**Disclaimer:** This script is for educational purposes only and should not be considered financial advice. Use at your own risk.
Machine Learning: kNN Trend PredictorThe kNN Trend Predictor is a machine learning-based indicator that uses the k-Nearest Neighbors (kNN) algorithm for price prediction in trading. By analyzing historical price movements and computing Euclidean distances, the script identifies the closest past price patterns and forecasts potential trends. It provides color-coded trend signals, optional trade entry labels, and alerts for long and short signals.