CapitalFlowResearch: N-ATRCapitalFlowsResearch: N-ATR — Normalised Volatility Regime Indicator
CapitalFlowsResearch: N-ATR transforms ATR into a normalised, directional volatility signal that oscillates within a fixed range. Instead of treating ATR as an absolute number—which varies widely across assets and market regimes—the tool rescales volatility into a consistent framework, allowing traders to compare conditions across instruments and timeframes without recalibrating settings.
The indicator identifies two core attributes simultaneously:
Volatility level relative to its recent environment
By normalising ATR, the script shows whether current volatility is high or low relative to its own historical context, not in arbitrary terms.
The direction of volatility pressure
A smoothing layer helps determine whether volatility is rising or falling, enabling a four-state volatility map (high → rising, high → falling, low → rising, low → falling).
These states are displayed via subtle background shading, giving a clear view of shifts in volatility regime without cluttering the chart.
A color-coded line plots the smoothed volatility signal itself, making transitions easy to spot and track over time.
Together, these features turn N-ATR into an effective volatility-regime compass—highlighting periods of compression, expansion, and volatility trend changes that often precede important market behaviour—while preserving the confidentiality of the underlying calculations.
التقلب

CapitalFlowsResearch: Vol RangesCapitalFlowsResearch: Vol Ranges — Multi-Timeframe ATR Expansion Map
CapitalFlowsResearch: Vol Ranges creates a structured volatility “roadmap” by projecting expected price extensions across multiple timeframes using ATR-based ranges. Instead of relying on a single ATR reading, the tool pulls in higher-timeframe volatility measures—such as daily and monthly expansions—and uses them to build a set of reference levels that anchor the current market against where it should trade under normal volatility conditions.
The script does two things simultaneously:
Projects volatility-derived target bands
It computes a set of upper and lower expansion levels (e.g., +100%, +50%, –50%, –100%) around prior closing levels on different timeframes. These levels act as structural markers for expected movement, allowing traders to quickly recognise when price is behaving within typical bounds or pressing into statistically stretched territory.
Displays a live dashboard for interpretation
A fully configurable on-chart table displays:
Recent volatility readings
Today's reference ranges
Distance from current price to each expansion level
Whether today's movement is expanding or contracting relative to prior volatility
This gives traders a compact situational summary without cluttering the price chart.
Optional high-timeframe projection lines can also be plotted directly on the chart, updating once per new day or new month, making it easy to visually align intraday price action with broader volatility structure.
In practical terms, Vol Ranges functions as a multi-timeframe volatility compass—highlighting when markets are trading inside normal ranges, when they are beginning to stretch, and when they may be entering conditions supportive of momentum or reversal behaviour. All core mechanics remain abstracted, preserving the proprietary nature of the volatility framework.

MPI Strategy (Hardcoded 2025)MPI Strategy (Hardcoded 2025)MPI Strategy (Hardcoded 2025)MPI Strategy (Hardcoded 2025)MPI Strategy (Hardcoded 2025)

UM VIX30/VIX Regime & Volatility Roll Yield
SUMMARY
A front-of-the-curve volatility indicator that compares spot VIX to a synthetic 30-day VIX (VIX30) built from VX1/VX2 futures, revealing early volatility pressure, regime shifts, and roll-yield transitions. Ideal for timing long/short volatility trades in VXX, UVXY, SVIX, and VIX futures.
DESCRIPTION
This indicator compares spot VIX to a synthetic 30-day constant-maturity volatility estimate (“VIX30”) built from VX1 and VX2 futures. The VIX30/VIX Ratio reveals short-term volatility pressure and regime shifts that traditional VX1/VX2 roll-yield alone often misses.
VIX30 is constructed using true calendar-day interpolation between VX1 and VX2, with VX1% and VX2% showing the real-time weights behind the 30-day volatility anchor. The table displays the volatility regime, the VX1/VX2 weights, spot-term roll yield (VIX30/VIX), and futures-term roll yield (VX2/VX1), giving a complete, front-of-the-curve perspective on volatility dynamics.
Use this to spot early volatility expansions, collapsing contango, and regime transitions that influence VXX, UVXY, SVIX, VX options, and VIX futures.
HOW IT WORKS
The script calculates the exact calendar days to expiration for the front two VIX futures. It then applies linear interpolation to blend VX1 and VX2 into a 30-day constant-maturity synthetic volatility measure (“VIX30”). Comparing VIX30 to spot VIX produces the VIX30/VIX Ratio, which highlights short-term volatility pressure and regime direction. A full term-structure table summarizes regime, VX1%/VX2% weights, and both spot-term and futures-term roll yields.
DEFAULT SETTINGS
VX1! and VX2! are used by default for front-month and second-month futures. These may be manually overridden if TradingView rolls contracts early. The default timeframe is 30 minutes, and the VIX30/VIX Ratio uses a 21-period EMA for regime smoothing. The historical threshold is set to 1.08, reflecting the long-run average relationship between VIX30 and VIX.
SUGGESTED USES
• Identify early volatility expansions before they appear in VX1/VX2 roll yield.
• Confirm contango/backwardation shifts with front-of-curve context.
• Time long/short volatility trades in VXX, UVXY, SVIX, and VX options.
• Monitor regime transitions (Low → Cautionary → High) to anticipate trend inflections.
• Combine with price action, Nadaraya-Watson trends, or MA color-flip systems for higher-confidence entries.
• MA red → green flips may signal opportunities to short volatility or increase equity exposure.
• MA green → red flips may signal opportunities to go long volatility, reduce equity exposure, or take short-equity positions.
ALERTS
Alerts trigger when the ratio crosses above or below the historical threshold or when the moving-average slope flips direction. A green flip signals rising volatility pressure; a red flip signals fading or collapsing volatility. These alert conditions can be used to automate long/short volatility bias shifts or trade-entry notifications.
FURTHER HINTS
• Increasing orange/red in the table suggests an emerging higher-volatility environment.
• SVIX (inverse volatility ETF) can trend strongly when volatility decays; on a 6-hour chart, MA green flips often align with attractive short-volatility opportunities.
• For long-volatility trades, consider shrinking to a 30-minute chart and watching for MA green → red flips as early entry cues.
• Experiment with different timeframes and smoothing lengths to match your trading style.
• Higher VIX30/VIX and VX2/VX1 roll yields generally imply faster decay in VXX, UVXY, and UVIX — or stronger upside momentum in SVIX.
• The author likes the 6-hour chart for short vol, and the 30-minute chart for long vol. Long vol trades are fast and furious so you want to be quick.

SigmaFrame-FESXSigmaFrame is a volatility-weighted standard deviation engine designed to generate dynamic intraday pivot levels which expand during volatility spikes and tighten during compression, giving traders a consistent structural map across trending and rotational environments.

Institutional VWAP Suite (Lite Compatible)The **Institutional VWAP Suite (Lite Compatible)** brings true institutional volume-weighted price analysis to every trader — even on TradingView Lite/Free accounts where standard VWAP tools are restricted.
This script recreates the most important VWAP models used by banks, funds, and high-frequency desks, including:
• **Daily VWAP** (exchange-accurate)
• **Weekly VWAP** (manually accumulated)
• **Monthly VWAP** (manually accumulated)
• **Rolling Window VWAP** (array-based, fully Lite-compatible)
All calculations avoid blocked functions like `ta.sum` or session-restricted VWAP calls. Everything is built manually from volume and price to ensure accuracy across all accounts and all markets.
### Features
• Multi-timeframe VWAPs (Daily/Weekly/Monthly)
• Manual Rolling VWAP with adjustable length
• Optional VWAP bands (Lite-safe)
• Clean visuals with color-coded levels
• Optimized arrays for fast, stable performance
• Free-tier compatible — no premium functions required
This tool is designed for traders who want institutional structure, premium-level VWAP calculations, and consistent execution regardless of plan level. Perfect for scalpers, day traders, futures traders, and anyone who uses intraday volume profiles.
### Recommended Use
• Map directional bias using Daily vs Weekly VWAP
• Use Monthly VWAP for macro trend context
• Track intraday mean reversion with Rolling VWAP
• Use VWAP bands as dynamic support/resistance zones
A simple, powerful, no-restrictions VWAP engine — built for everyone.

NYAM Trend PullbackThis is an trend-following strategy designed for trades taken during New York Morning. It aims to capture trend continuations by entering positions when price aligns with the dominant trend relative to a Exponential Moving Average (EMA).
If price is above the EMA then it is bullish and enters long, and if its below the EMA it is bearish and enters a short.

Open Interest Delta AggregateOpen Interest Delta - By Randy (Multi-Exchange Version)This Pine Script indicator calculates and displays the daily change (delta) in total Open Interest across multiple major perpetual futures exchanges.Key Features:Aggregates Open Interest from Binance, OKX, ByBit, Bitget, HTX, and the current chart’s exchange (if any).
You toggle each exchange on/off individually — it automatically sums all active sources.
Plots OI Delta as histogram columns (Type 1 = combined, Type 2 = separate positive/negative).
Uses dynamic thresholds based on standard deviation of positive/negative OI delta EMA to classify changes as:Normal (yellow)
Medium (orange)
Large (red)
Extreme (purple)
Optionally colors price candles when OI delta crosses these significant thresholds (great for spotting big money moves).
Works best on daily timeframe (automatically switches to daily OI data even if you're viewing lower timeframes).
In Simple Terms:It shows you when huge amounts of new positions (long or short) are being opened across the biggest crypto futures exchanges — a powerful signal of institutional/smart money activity and potential trend strength or reversals. The more exchanges light up with extreme OI delta, the stronger the conviction behind the move.

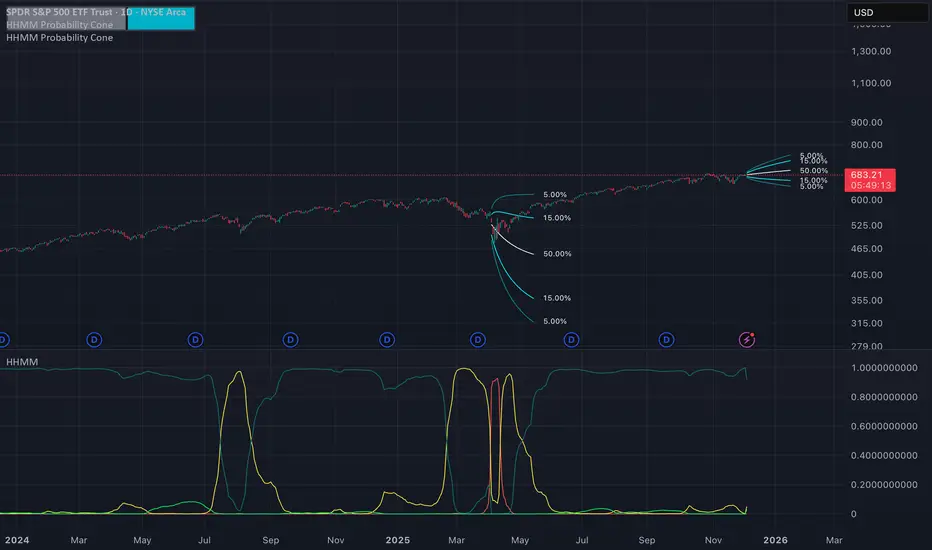
Hierarchical Hidden Markov Model - Probability Cone
The Hierarchical Hidden Markov Model - Probability Cone Indicator employs Hierarchical Hidden Markov Models for forecasting future price movements in financial markets. HHMMs are statistical tools that predict transitions between hidden states, such as different market regimes, based on observed data. This makes them valuable for understanding market behaviours and projecting future price trajectories. As discussed in the Hierarchical Hidden Markov Model indicator, HHMMs predict future states and their associated outputs based on the current state and model parameters. This tool is fundamentally very similar to the traditional HMM . The application of the HHMM for generating a probability cone forecast is therefore also fundamentally the same between HMM and HHMM. Despite their significant similarity I will go through the same fundamental examples of how probability cone is generated for the HHMM as I did for the HMM probability cone .
As you might know by now the probability cone indicator uses the knowledge about the current identified "state" or "regime" and with the help of transition probabilities, emission probabilities and initial probabilities generate a probabilistic forecast of the expected future price movements. To better understand the behind the Probability Cone we encourage you to use and learn about our free version of the Probability Cone as well as for even deeper understanding the Probability Cone Pro.
WHAT ARE REGIME DEPENDENT FORECASTS
We established that the indicator creates probabilistic forecasts of future price movements dependent on the current identified "state" or market "regime" via the Hidden Markov Model. In the image below we can see an example.
In this example we can see 4 different probability cones forecasting a 70% and 90% probability range (15% and 5% quantiles respectively). What you may notice is that the 4 probability cones look vastly different, despite using the same probability ranges as well as being generated from the same model trained on virtually the same data. What allows for this difference in the forecast, is conditioning the forecast on the current most likely identified state by the HHMM.
The first most cone is generating a forecast taking into account that the model identified the current market condition to be a extremely low in volatility this is a characteristic of the state identified by the light green coloured posterior probability. The second cone is significantly wider as well as has a negative drift, this is the case because that state identified by the red posterior probability is characterised by the most extreme volatility along with significant negative returns. The cone after that remains quite wide however is again associated with positive returns, this is characteristic of the state that the model identified via a high yelow coloured posterior probability. The last probability cone is again generated from a state that is characterised by quite low volatility albeit not the lowest. We can also see the state associated with that behaviour is identified by the high dark green posterior probability which is the highest at that time.
NOTE! Those are within sample forecasts, you can find more information on the difference between within sample model fit and out of sample prediction in the HHMM indicator description
This indicator also allows you to specify whether you wish to display probability based labels at the edges of the cone or whether you would prefer to display percent change based labels. With percent change labels you get the exact percentage value of the probabilistic increase or decrease of the price. See the example below
BARS BACK OFFSET vs DATE BASED OFFSET
The cones position can be offset by specifying the number of bars we wish to move it back similarly as with the rest of probability cone indicators. This indicator has however an additional, date based offset implemented. A user can therefore specify the position of the cone by specifying a date in the settings. The advantage of using the date based offset is that once it is turned on the user can also slide the cone up and down the chart with their mouse without having to manually adjust the date in the settings.
DIFFICULTIES WITH GENERATING FORECASTS (advanced):
The estimation of the probability cone, gets more difficult the more complex the model gets. A simple normal distribution probability cone can scale the distribution over time by simply multiplying the drift by the number of time steps and the volatility by the square root of time steps we wish to forecast for. More complex distributions often have to rely on mode advanced methods like convolutions, monte carlo or other kinds of approximations.
To estimate the probability cone forecast for the Hierarchial Hidden Markov Model, the indicator integrates two primary methodologies: Gaussian approximation and importance sampling. The Gaussian approximation is utilised for estimating the central 90% of future prices. This method provides a quick and efficient estimation within this central range, capturing the most likely price movements. The gaussian approximation will result in a forecast with an equal mean and variance as the true forecast, it will however not accurately reflect higher moments like skewness and kurtosis. For that reason the tail quantiles, which represent extreme price movements beyond the central range (90%), are estimated via importance sampling. This approach ensures a more accurate estimation of the skewness and kurtosis associated with extreme scenarios. While importance sampling leverages the flexibility of Monte Carlo as well as attempts to increase its efficiency by sampling from more precise areas of the distribution, the importance sampling may still underestimate most extreme quantiles associated with the lowest probabilities which is an inherent limitation of the indicator.
Example of gaussian approximation cone for probabilities above 5% (90% range):
Example of importance sampling cone for tail probabilities lower than 5% (beyond 90% range):
WARNING!
As per usual understand that the probabilities are estimations and best guesses based on the historical data and the patterns identified by the model and do not represent the true probability which is unknown in reality.
Settings:
- Source: Data source used for the model
- Forecast Period: Number of bars ahead for generating forecasts.
- Simulation Number: Number of Monte Carlo simulations to run in the case of importance sampling
-Body Probability: Specifies the inner range of the probability cone. The probability specifies the ammount of observations that are expected to fall outside of this range
- Tail Probability: Specifies the outter range of the probability cone. When this probability is under 5%, importance sampling will turn on
- Lock Cone: When ticked on, the cone will be locked at its current position.
- Offset Cone Based on Date: When ticked on, the position of the cone will be determined by the selected date.
- Offset: When "Offset Cone Based on Date" is turned off, you can use offset setting to specify the position of the cone projection.
- Date: When "Offset Cone Based on Date" is turned on, you can use the date setting to specify the date from which the forecast starts.
- Reestimate Model Every N Bars: This is especially useful if you wish to use the indicator on lower timeframes where model estimation might take longer than for the new datapoint to arrive. In that case you can specify after how many bars the model should be reestimated.
- Training Period: Length of historical data used to train the HMM.
- Expectation Maximization Iterations: Number of iterations for the EM algorithm.
- Cone Colors: Customizable colors for the probability cone, when approximation is on and when importance sampling is on
Hidden Markov Model - Probability Cone
The Hidden Markov Model - Probability Cone Indicator employs Hidden Markov Models (HMMs) for forecasting future price movements in financial markets. HMMs are statistical tools that predict transitions between hidden states, such as different market regimes, based on observed data. This makes them valuable for understanding market behaviours and projecting future price trajectories. As discussed in the Hidden Markov Model indicator, HMMs predict future states and their associated outputs based on the current state and model parameters.
The probability cone indicator therefore uses the knowledge about the current identified "state" or "regime" and with the help of transition probabilities, emission probabilities and initial probabilities generate a probabilistic forecast of the expected future price movements. To better understand the behind the Probability Cone we encourage you to use and learn about our free version of the Probability Cone as well as for even deeper understanding the Probability Cone Pro.
WHAT ARE REGIME DEPENDENT FORECASTS
As mentioned above the indicator creates probabilistic forecasts of future price movements dependent on the current identified "state" or market "regime" via the Hidden Markov Model. In the image below we can see an example.
In this example we can see 3 different probability cones forecasting a 70% and 90% probability range (15% and 5% quantiles respectively). What you may notice is that the 3 probability cones look vastly different, despite using the same probability ranges as well as being generated from the same model trained on virtually the same data. What allows for this difference in the forecast is conditioning the forecast on the current most likely identified state by the HMM.
The first most wide cone is generating a forecast taking into account that the model identified the current market condition to be a very volatile which is a characteristic of the state identified by the orange coloured posterior probability. The second cone is significantly more narrow as that state identified by the purple posterior probability is characterised by lower volatility. Nevertheless, the last probability cone is generated from the state that is characterised by the lowest volatility, we can also see the light blue posterior probability to be the highest at that time.
The indicator also allows you to specify whether you wish to display probability based labels at the edges of the cone or whether you would prefer to display percent change based labels. With percent change labels you get the exact percentage value of the probabilistic increase or decrease of the price. See the example below
BARS BACK OFFSET vs DATE BASED OFFSET
The cones position can be offset by specifying the number of bars we wish to move it back similarly as with the rest of probability cone indicators. This indicator has however an additional, date based offset implemented. A user can therefore specify the position of the cone by specifying a date in the settings. The advantage of using the date based offset is that once it is turned on the user can also slide the cone up and down the chart with their mouse without having to manually adjust the date in the settings.
DIFFICULTIES WITH GENERATING FORECASTS (advanced):
The estimation of the probability cone, gets more difficult the more complex the model gets. A simple normal distribution probability cone can scale the distribution over time by simply multiplying the drift by the number of time steps and the volatility by the square root of time steps we wish to forecast for. More complex distributions often have to rely on mode advanced methods like convolutions, monte carlo or other kinds of approximations.
To estimate the probability cone forecast for the Hidden Markov Model, the indicator integrates two primary methodologies: Gaussian approximation and importance sampling. The Gaussian approximation is utilized for estimating the central 90% of future prices. This method provides a quick and efficient estimation within this central range, capturing the most likely price movements. The gaussian approximation will result in a forecast with an equal mean and variance as the true forecast, it will however not accurately reflect higher moments like skewness and kurtosis. For that reason the tail quantiles, which represent extreme price movements beyond the central range (90%), are estimated via importance sampling. This approach ensures a more accurate estimation of the skewness and kurtosis associated with extreme scenarios. While impoortance sampling leverages the flexibility of monte carlo as well as attempts to increase its efficiency by sampling from more precise areas of the distribution, the importance sampling may still underestimate most extreme quantiles associated with the lowest probabilties which is an inherent limitation of the indicator.
Example of gaussian approximation cone for probabilities above 5% (90% range):
Example of importance sampling cone for tail probabilities lower than 5% (beyond 90% range):
WARNING!
As per usual understand that the probabilities are estimations and best guesses based on the historical data and the patterns identified by the model and do not represent the true probability which is unknown in reality.
Settings:
- Source: Data source used for the model
- Forecast Period: Number of bars ahead for generating forecasts.
- Simulation Number: Number of Monte Carlo simulations to run in the case of importance sampling
-Body Probability: Specifies the inner range of the probability cone. The probability specifies the ammount of observations that are expected to fall outside of this range
- Tail Probability: Specifies the outter range of the probability cone. When this probability is under 5%, importance sampling will turn on
- Lock Cone: When ticked on, the cone will be locked at its current position.
- Offset Cone Based on Date: When ticked on, the position of the cone will be determined by the selected date.
- Offset: When "Offset Cone Based on Date" is turned off, you can use offset setting to specify the position of the cone projection.
- Date: When "Offset Cone Based on Date" is turned on, you can use the date setting to specify the date from which the forecast starts.
- Reestimate Model Every N Bars: This is especially useful if you wish to use the indicator on lower timeframes where model estimation might take longer than for the new datapoint to arrive. In that case you can specify after how many bars the model should be reestimated.
- Training Period: Length of historical data used to train the HMM.
- Expectation Maximization Iterations: Number of iterations for the EM algorithm.
- Cone Colors: Customizable colors for the probability cone, when approximation is on and when importance sampling is on

ARCH ProxyARCH Proxy (ARCH) - Volatility Assessment Indicator
The ARCH Proxy indicator (short title: ARCH) is a dynamic, multi-factor volatility assessment tool designed to help traders quickly gauge the current energy and risk level of the market. It plots a real-time measure of price fluctuation against its long-term historical average and adaptive High/Low Volatility thresholds. This provides a clear, objective framework for distinguishing between periods of market compression (low-energy consolidation) and expansion (high-risk volatility), optimizing strategy selection and risk management.
Simplified Trading Guide
The ARCH indicator offers a clear, objective signal framework to guide your trading decisions based on market energy :
Spotting High-Risk Expansion (Climax):
Signal: The main ARCH Proxy line moves sharply above the High Volatility Threshold (typically a red line).
Action: This signals the market is in a period of intense, climactic price action. This is often a time to avoid new entries, reduce exposure, or look for potential trend exhaustion and reversals due to the high risk of a sudden correction.
Identifying Low-Energy Compression (Setup):
Signal: The main ARCH Proxy line trends consistently below the Low Volatility Threshold (typically a green line).
Action: This indicates a market consolidation phase. This "low-energy" compression frequently precedes a strong breakout (expansion). Traders should prepare for an entry in the direction of the dominant trend, anticipating a coming surge in momentum.
Normal Trading Conditions:
Signal: The ARCH Proxy line is fluctuating between the High and Low Volatility thresholds.
Action: The market is in a normal state. Use this time to follow the dominant trend with standard risk parameters.

Watermark | Bar Time | Average Daily RangeMulti Info Panel & Watermark
Multi Info Panel & Watermark is a utility indicator that displays several pieces of chart information in a single, customizable panel. It is designed to support intraday and swing analysis by making key data—such as symbol details, date, and average daily range—easy to see at a glance, as well as providing simple tools for notes and backtesting.
Features
Watermark / Custom Note
Optional text overlay that can be used as a watermark or personal note.
Can display a strategy name, reminder, or any other user-defined label on the chart.
Ticker Info
Shows information about the currently active symbol on the chart (for example, symbol name and other basic details depending on the inputs).
Helps keep track of which market or pair is being analyzed, especially when using multiple charts.
Current Date
Displays the current date directly on the chart.
Useful for screenshots, journaling, and documenting analysis.
Average Daily Range (ADR)
Calculates the average daily range of the active symbol over a user-defined number of recent days.
Helps visualize how much price typically moves in a day, which can support position sizing, target setting, or volatility awareness within your own trading approach.
Open Bar Time Marker
Marks the open time of a selected bar (for example, a session open or a specific reference bar).
Primarily intended as a visual aid for manual backtesting and reviewing historical price action.
Usage
Use the watermark and ticker info to keep your charts labeled and organized.
Refer to the ADR readout to understand typical daily volatility of the instrument you are studying.
Use the date and open bar time marker when creating screenshots, trade journals, or when replaying historical sessions for review.
This script does not generate trading signals and does not guarantee any performance or results. It is provided solely as an informational and visualization tool. Always combine it with your own analysis, risk management, and decision-making. Nothing in this indicator or description should be considered financial advice.

Force Pulse█ OVERVIEW
Force Pulse is a fast-reacting oscillator that measures the internal strength of market sides by analyzing the aggregated dominance of bulls and bears based on candle size.
The indicator normalizes this difference into a 0–100 range, generates signals (OB/OS, midline cross, MA midline cross), and detects divergences between price and the oscillator.
It also offers advanced visualization, signal markers, and alerts, making it a versatile tool suitable for many trading styles.
█ CONCEPTS
Force Pulse was designed as a universal tool that can be applied to various trading strategies depending on its settings:
- increasing the period lengths and smoothing transforms it into a momentum/trend indicator, revealing a stable dominance of one market side.
- Lowering these parameters turns it into a peak/low detector, ideal for contrarian and mean-reversion strategies.
The oscillator analyzes the relationship between the sum of bullish and bearish candles over a selected period, based on:
- candle body size, or
- average candle body size (AVG Body).
Depending on the selected mode, OB/OS levels should be adjusted, as value dynamics differ between modes.
The output is normalized to 0–100, where:
> 50 – bullish dominance,
< 50 – bearish dominance.
The additional MA line is derived from smoothed oscillator values and serves as a signal line for midline crosses and as a trend filter.
The indicator also detects divergences (HL/LL) between price and the oscillator.
█ FEATURES
Bull & Bear Strength:
- Calculations are based on Body or AVG Body – mode selection requires adjusting OB/OS levels.
- Bullish and bearish candle values are summed separately.
- All results are normalized to the 0–100 scale.
Force Pulse Oscillator:
- The main line reflects the current dominance of either market side.
Dynamic colors:
- Green – above 50,
- Red – below 50.
Signal MA:
- SMA based on oscillator values functions as a signal line.
- Helps detect momentum shifts and generates signals via midline crosses.
- Can serve as a trend confirmation filter.
Overbought / Oversold:
- Configurable OB/OS levels, also for the MA line.
- Dynamic OB/OS line colors: when the MA line exceeds the defined threshold (e.g., MA > maOverbought or MA < maOversold), OB/OS lines change color (red/green).
- This often signals a potential reversal or correction and may act as additional confirmation for oscillator-generated signals.
Divergences:
- Detection based on swing pivots:
- Bullish: price LL, oscillator HL
- Bearish: price HH, oscillator LH
- Displayed as “Bull” / “Bear” labels.
Signals:
Supports multiple signal types:
- Overbought/Oversold Cross
- Midline Cross
- MA Midline Cross (based on the signal MA line)
- Signals appear as triangles above/below the oscillator.
Visualization:
- Gradient options for lines and levels.
- Full customization of colors, transparency, and line thickness.
Alerts available for:
- Divergences
- OB/OS crossings
- Midline crossings
- MA midline crossings
█ HOW TO USE
Add the indicator to your TradingView chart → Indicators → search “Force Pulse”
Parameter Configuration
Calculation Settings:
- Calculation Period (lookback) – defines the strength calculation window.
Force Mode (Body / AVG Body):
- Body – faster response, higher sensitivity.
- AVG Body – more stable output; adjust band levels and periods to your strategy.
- EMA Smoothing (smoothLen) – reduces oscillator noise.
- MA Length – length of the signal line (SMA).
Threshold Levels:
- Set Overbought/Oversold levels for both the oscillator and the MA line.
- Adjust levels depending on Body / AVG Body mode.
Divergence Detection:
- Enable/disable divergence detection.
- PivotLength affects both delay and signal quality.
- Signal Settings: Choose one or multiple signal types.
- Style & Colors: Full control over color schemes, gradients, and transparency.
Signal Interpretation
BUY:
- Oscillator leaves oversold (OS crossover).
- Midline cross upward.
- MA crosses the midline from below.
- Bullish divergence.
SELL:
- Oscillator leaves overbought (drops below OB).
- Midline cross downward.
- MA crosses the midline from above.
- Bearish divergence.
Trend / Momentum:
-Longer periods and stronger smoothing → stable directional signals.
-MA as a trend filter: e.g., signal line above the midline (50) and MA pointing upward indicates continuation of a bullish impulse.
Contrarian / Mean Reversion:
- Short periods → rapid detection of peaks and troughs; ideal for contrarian signals and pullback entries.
█ APPLICATIONS
- Trend Trading: Using midline and MA midline crosses to determine direction.
- Reversal Trading: OB/OS levels and divergences help identify reversals.
- Scalping & Intraday: Short settings + signal line above the midline with bullish MA → shows short-term impulse and continuation.
- Swing Trading: Longer MA and higher lookback provide a stable view of market-side dominance.
- Momentum Analysis: Force Pulse highlights the strength of the wave before price movement occurs.
█ NOTES
- In strong trends, the oscillator may stay in extreme zones for a long time — this reflects dominance, not necessarily a reversal signal.
- Divergences are more reliable on higher timeframes.
- OB/OS levels should be tailored to Body/AVG Body mode and the instrument.
- Best results come from combining the indicator with other tools (S/R, market structure, volume).

Probability Cone ProProbability Cone Pro is based on the Expected Move Pro . While Expected Move only shows the historical value band on every bar, probability cone extend the period in the future and plot a cone or curve shape of the probable range. It plots the range from bar 1 all the way to any specified number of bars up to 1000.
Probability Cone Pro is an upgraded version of the Probability Cone indicator that uses a Normal Distribution to model the returns. This newer version uses a maximum likelihood estimation for Asymmetric Laplace distribution parameters. Asymmetric Laplace distribution takes into account fatter tails and volatility clustering during low volatility. So it will be thinner in the body (eg: <70% range) and fatter in the tails (>95% range) which fits the stock return better. Despite a better fit users should not blindly follow the probabilities derived from the indicator and should understand that these are very precise estimations of probability based on historical data, not the true probability which is in reality unknown.
When we compare the more peaked asymmetric laplace to the bell curve shaped normal distribution we can see that the asymmetric laplace fits the empirical data (blue histogram) significantly better. The fit is improved in both the body (middle peaked part) as well as in the fatter tails (more of extreme occurrences far from the center)
The area of probability range is based on an inverse cumulative distribution function. The inverse cumulative distribution gives the range of price for given input probability. People can adjust the range by adjusting the input probability in the settings. The entered probability will be shown at the edges of the cone when the “show probability” setting is on.
The indicator allows for specifying the probability for 2 quantiles on each side of the distribution , therefore 4 distinct probability values. The exact probability input is another distinction compared to the Normal Distribution based Probability Cone, in which the probability range is determined by the input of a standard deviation. Additionally now the displayed labels at the edges of the probability cone no longer correspond to the total number of outcomes that are expected to occur within the specific range, instead we chose to display the inverse which is the probability of outcomes outside of the specified range. See comparison below:
Probability cone pro with 68% and 95% ranges also defined by 16% and 2.5% probabilities at the tails on both sides:
Normal Probability cone with 68% and 95% ranges defined by 1st and 2nd standard deviation
SETTINGS:
Bars Back : Number of bars the cone is offset by.
Forecast Bar: Number of bars we forecast the cone for in the future.
Lock Cone : Specify whether we wish t lock the cone to the current bar, so it does not move when new bars arrive.
Show Probability : Specify whether you wish to show the probability labels at the edges of the cone.
Source : Source for computation of log returns whose distribution we forecast
Drift : Whether to take into account the drift in returns or assume 0 mean for the distribution.
Period: The sampling period or lookback for both the drift and the volatility estimation (full distribution estimation).
Up/Down Probabilities: 4 distinct probabilities are specified, 2 for the upper and 2 for the lower side of the distribution.

Expected Move ProExpected Move is the amount that an asset is predicted to increase or decrease from its current price, based on the current levels of volatility.
This Expected Move Pro indicator uses a maximum likelihood estimation for Asymmetric Laplace distribution parameters, and is an upgrade from the regular Expected Move indicator that uses a Normal Distribution. The use of the Asymmetric Laplace distribution ensures a probability range more accurate than the more common expected moves based on a normal distribution assumption for returns. Asymmetric Laplace distribution takes in account fatter tails and volatility clustering during low volatility. So it will be thinner in the body (eg: <70% range) and fatter in the tails (>95% range) which fits the stock return better.
When we compare the more peaked asymmetric laplace to the bell curve shaped normal distribution we can see that the asymmetric laplace fits the empirical data (blue histogram) significantly better. The fit is improved in both the body (middle peaked part) as well as in the fatter tails (more of extreme occurrences far from the center)
EXPECTED MOVE PROBABILITY:
In the expected move settings, the user can specify the range probability they wish to display. In a normal distribution a 1 standard deviation range corresponds to a range within which just under 70% of observations fall. So to specify a 70% probability range one would set 15% probability for both the upper and lower range.
For the more extreme ranges a two tail function is used so the user can only specify one probability. When 5% probability is specified the range will cover 95% and on each side of the range the probability of an occurence that extreme will be 2.5%. In the above Image we can see two tail probabilities specified at 5% and 1%, covering the 95% and 99% ranges respectively.
The indicator also allows for multi timeframe usecases. One can request a daily or perhaps even weekly expected move on an hourly chart, like we see below.
SETTINGS:
Resolution: Specify the timeframe and if you want to use the multi timeframe functionality.
Real Time : Do you wish the expected move to adjust with the current open price or do you wish it to be a forecast based on the yesterdays close. If latter, keep it OFF.
Sample Size : Lookback or the number of bars we sample in the calculation.
Optimization : Keep it on for speed purposes, only slightly higher precision will be achieved without optimization.
Probabilities: One tail - left and right, specify probability for each side of the range, two tail - single probability split in half for each side of the range
Center : Displays the central line which is the central tendency of a distribution / the median
Hide History : Hides expected moves and only the expected move for the current bar remains.
Plot Style Settings : One can adjust the line styles, box styles as well as width and transparency.

Probability Cone█ Overview:
Probability Cone is based on the Expected Move . While Expected Move only shows the historical value band on every bar, probability panel extend the period in the future and plot a cone or curve shape of the probable range. It plots the range from bar 1 all the way to bar 31.
In this model, we assume asset price follows a log-normal distribution and the log return follows a normal distribution.
Note: Normal distribution is just an assumption; it's not the real distribution of return.
The area of probability range is based on an inverse normal cumulative distribution function. The inverse cumulative distribution gives the range of price for given input probability. People can adjust the range by adjusting the standard deviation in the settings. The probability of the entered standard deviation will be shown at the edges of the probability cone.
The shown 68% and 95% probabilities correspond to the full range between the two blue lines of the cone (68%) and the two purple lines of the cone (95%). The probabilities suggest the % of outcomes or data that are expected to lie within this range. It does not suggest the probability of reaching those price levels.
Note: All these probabilities are based on the normal distribution assumption for returns. It's the estimated probability, not the actual probability.
█ Volatility Models :
Sample SD : traditional sample standard deviation, most commonly used, use (n-1) period to adjust the bias
Parkinson : Uses High/ Low to estimate volatility, assumes continuous no gap, zero mean no drift, 5 times more efficient than Close to Close
Garman Klass : Uses OHLC volatility, zero drift, no jumps, about 7 times more efficient
Yangzhang Garman Klass Extension : Added jump calculation in Garman Klass, has the same value as Garman Klass on markets with no gaps.
about 8 x efficient
Rogers : Uses OHLC, Assume non-zero mean volatility, handles drift, does not handle jump 8 x efficient.
EWMA : Exponentially Weighted Volatility. Weight recently volatility more, more reactive volatility better in taking account of volatility autocorrelation and cluster.
YangZhang : Uses OHLC, combines Rogers and Garmand Klass, handles both drift and jump, 14 times efficient, alpha is the constant to weight rogers volatility to minimize variance.
Median absolute deviation : It's a more direct way of measuring volatility. It measures volatility without using Standard deviation. The MAD used here is adjusted to be an unbiased estimator.
You can learn more about each of the volatility models in out Historical Volatility Estimators indicator.
█ How to use
Volatility Period is the sample size for variance estimation. A longer period makes the estimation range more stable less reactive to recent price. Distribution is more significant on larger sample size. A short period makes the range more responsive to recent price. Might be better for high volatility clusters.
People usually assume the mean of returns to be zero. To be more accurate, we can consider the drift in price from calculating the geometric mean of returns. Drift happens in the long run, so short lookback periods are not recommended.
The shape of the cone will be skewed and have a directional bias when the length of mean is short. It might be more adaptive to the current price or trend, but more accurate estimation should use a longer period for the mean.
Using a short look back for mean will make the cone having a directional bias.
When we are estimating the future range for time > 1, we typically assume constant volatility and the returns to be independent and identically distributed. We scale the volatility in term of time to get future range. However, when there's autocorrelation in returns( when returns are not independent), the assumption fails to take account of this effect. Volatility scaled with autocorrelation is required when returns are not iid. We use an AR(1) model to scale the first-order autocorrelation to adjust the effect. Returns typically don't have significant autocorrelation. Adjustment for autocorrelation is not usually needed. A long length is recommended in Autocorrelation calculation.
Note: The significance of autocorrelation can be checked on an ACF indicator.
ACF
Time back settings shift the estimation period back by the input number. It's the origin of when the probability cone start to estimation it's range.
E.g., When time back = 5, the probability cone start its prediction interval estimation from 5 bars ago. So for time back = 5 , it estimates the probability range from 5 bars ago to X number of bars in the future, specified by the Forecast Period (max 1000).
█ Warnings:
People should not blindly trust the probability. They should be aware of the risk evolves by using the normal distribution assumption. The real return has skewness and high kurtosis. While skewness is not very significant, the high kurtosis should be noticed. The Real returns have much fatter tails than the normal distribution, which also makes the peak higher. This property makes the tail ranges such as range more than 2SD highly underestimate the actual range and the body such as 1 SD slightly overestimate the actual range. For ranges more than 2SD, people shouldn't trust them. They should beware of extreme events in the tails.
The uncertainty in future bars makes the range wider. The overestimate effect of the body is partly neutralized when it's extended to future bars. We encourage people who use this indicator to further investigate the Historical Volatility Estimators , Fast Autocorrelation Estimator , Expected Move and especially the Linear Moments Indicator .
The probability is only for the closing price, not wicks. It only estimates the probability of the price closing at this level, not in between.

WSMR v3.9 — WhaleSplash → Mean Reversal
# WSMR v3.9 — WhaleSplash → Mean Reversal
*A Non-Repainting Impulse‑Reversal Engine for Systematic Futures Trading*
## Overview
WSMR v3.9 is a complete impulse → exhaustion → mean‑reversion framework designed for systematic intraday trading. It identifies high‑energy displacement events (“WhaleSplashes”), measures volatility structure, tracks VWAP deviation, and confirms reversals using RSI divergence, Z‑Score resets, SMA20 reclaim, and pivot-based structure.
All signals are non‑repainting and alerts fire on bar close.
---
## Core Components
### 1. WhaleSplash (Short Impulse Event)
Triggered when a candle meets displacement conditions:
- Large bar range vs ATR
- Minimum % move
- Volume expansion
- VWAP deviation (tick-based)
- Z‑Score oversold / RSI exhaustion
- Volatility-gated
### 2. Mean Reversal Long (MR)
Requires:
- RSI bullish divergence
- Z‑Score reset
- SMA20 reclaim
- Higher-low confirmation
### 3. First-Candle Confirmation (Optional)
- MR Confirm → first green after MR
- WS Confirm → first red after WS
- TTL window configurable
### 4. Asia Session Filter
Optional restriction to:
**23:00 → 09:00 UTC**
### 5. Volatility Monitor
Detects:
- Normal
- Wicky
- Spiky
- Extreme
### 6. WS Frequency Analytics
Rolling frequency calculation across:
- Bars / Days / Weeks / Months
---
## Status Panel (Top-Right)
Shows:
- Mode (Global / Asia-only)
- Timeframe + TTL
- WS frequency
- Volatility state
---
## Alerts
- WhaleSplash SHORT
- WhaleSplash LONG (MR)
- MR Confirm LONG
- WS Confirm SHORT
- Volatility Warning
---
## Notes
- Fully non‑repainting
- Stable bar-close logic
- Optimised for 1m–5m
- Works on futures, indices, metals, FX


Supertrend Cloud ProSupertrend Cloud Pro is a next-generation trend + breakout system designed for traders who want clean structure, early breakout confirmation, and disciplined exits.
The strategy combines Fast + Slow Supertrend layers, a dynamic cloud compression model , and a breakout-based entry engine to deliver clarity in trending as well as contracting markets.
How It Works
1. Dual Supertrend Structure (Fast + Slow)
Fast ST reacts quickly to volatility
Slow ST establishes dominant trend bias
Combined color logic instantly reveals market direction
Green Cloud → Bullish Trend
Red Cloud → Bearish Trend
Yellow Cloud → Compression / Squeeze Zone
2. Cloud Compression Logic
The zone between Fast/Slow Supertrend creates a structure-based “cloud.”
When price enters this zone, markets are typically preparing for expansion.
Yellow shading highlights these high-probability breakout zones.
3. Breakout Entry Engine
Long Entry : Price closes above the cloud top
Short Entry: Price closes below the cloud bottom
This avoids premature entries and filters out false noise.
4. Smart Exit Logic
Positions exit automatically when Fast or Slow Supertrend flips direction, ensuring disciplined exit and minimizing emotional decisions.

RSI Cross Below 30 – Red Background StripShows red bars on chart in instances where RSI drops below 30

Book of Fish: Universal Deep DiveAhoy, Captain. 🏴☠️
Here is your official Angler’s Manual for the Book of Fish: Universal Deep Dive. This guide translates every pixel on your TradingView chart into nautical instruction so you can navigate the currents and land the big catch.
Print this out, tape it to your monitor, and respect the code of the sea.
________________________________________
📖 The Angler’s Manual: How to Fish
A Guide to the "Universal Deep Dive" Indicator
🌊 1. Check the Current (Background Color)
Before you cast a line, you must know which way the river is flowing.
• Green Water (Background): The tide is coming in. The broad market (Advancers) is beating the losers.
o The Rule: We prefer Longs (Calls). Swimming upstream against the green current is dangerous.
• Red Water (Background): The tide is going out. The market is heavy.
o The Rule: We prefer Shorts (Puts). Don't fight the gravity.
Captain’s Note: If your specific fish (stock) is Green while the water is Red, that’s a Monster Fish (Relative Strength). It’s strong, but keep a tight drag—if it gets tired, the current will drag it down fast.
________________________________________
🐟 2. Identify the Species (Candle Colors)
The color of your bars tells you exactly what strategy to deploy.
🟢 The Marlin (Ultra Bull)
• Visual: Green Candles. Price is riding above the Yellow Wave (20 EMA), and the Yellow Wave is above the White Whale (200 EMA).
• Strategy: Trend Following.
• How to Fish:
o Wait for the fish to swim down and touch the Yellow Wave.
o If it bounces? CAST! (Enter Long).
o Target: Let it run until the trend bends.
🔴 The Barracuda (Ultra Bear)
• Visual: Red Candles. Price is diving below the Yellow Wave, and the Yellow Wave is below the White Whale.
• Strategy: Trend Following (Short).
• How to Fish:
o Wait for the fish to jump up and hit the Yellow Wave.
o If it rejects? CAST! (Enter Short).
🟠 The Bottom Feeder (No Man’s Zone)
• Visual: Orange or Lime Candles. The price is fighting the trend (e.g., Price is below Yellow, but Yellow is still above White).
• Strategy: Reversion to Mean (Scalping).
• How to Fish:
o You are catching small fry here.
o Target: The Purple Anchor (VWAP) or the White Whale (200 EMA).
o Rule: As soon as it hits the Anchor or the Whale, cut the line and take your profit. Do not hold for a home run.
________________________________________
🎣 3. The Tackle Box (Signals & Icons)
These shapes are your triggers. They tell you when to strike.
Icon Name Meaning Action
▲ (Green Triangle) 3-Bar Play THE STRIKE. Momentum is breaking out after a rest. ENTER NOW. This is the sharpest hook in the box. Trend is resuming.
🔷 (Blue Diamond) Inside Bar The Nibble. Price is coiling/resting. Set a trap. Place a stop-entry slightly above the diamond (for longs).
⚫ (Black Dots) The Squeeze Calm Waters. Volatility has died. DO NOT CAST. Wait. When the dots disappear, the storm (and the move) begins.
9️⃣ (Red/Green Number) Exhaustion Full Net. The school has swum too far in one direction. Take Profits. A Red 9 at the top means the bull run is tired. A Green 9 at the bottom means the bear dive is ending.
✖️ (Purple Cross) RSI Snag Hazard. The engine is overheated (Overbought/Oversold). Don't add weight. The line might snap if you buy here.
________________________________________
🗺️ 4. The Map (The Lines)
• The Yellow Wave (20 EMA): Your surfboard. In a strong trend, price should surf this line. If it closes below it, the surf is over.
• The White Whale (200 EMA): The deep ocean trend. This is massive support/resistance. We generally do not short above the Whale or long below it.
• The Purple Anchor (VWAP): The average price. Prices love to return here when they get lost in the No Man's Zone.
• The Dotted Lines (PDH/PDL): The Horizon. Previous Day High (Green) and Low (Red). Crossing these means you are entering open ocean (Discovery Mode).
⚓ The Captain's Code
1.Don't force the fish. If the chart is chopping (Gray candles), stay on the dock.
2.Respect the '9'. When you see that number, lock in some gains.
3.The Trend is your Friend. Green Candles + Green Background = Smooth Sailing.
Fair winds and following seas.

Pro Bollinger Bands Strategy [Breno]This strategy excels in highly volatile financial instruments, including cryptocurrencies, high-beta stocks, commodity futures, and certain exchange-traded funds (ETFs) that exhibit clear mean-reversion characteristics around their Bollinger Bands. The system's ability to utilize scaling (position averaging) and an ATR-based stop loss makes it particularly effective in markets with significant price swings, allowing the trader to capture profits from price extremes while managing increased volatility-related risk.
Core Strategy Logic
This Strategy implements a comprehensive trend-following and mean-reversion strategy primarily leveraging the Bollinger Bands (BB) indicator for entry and exit signals, complemented by an Average True Range (ATR)-based Stop Loss mechanism and an optional EMA filter. It is designed with robust features for capital management, including configurable leverage and a sophisticated position averaging (scaling) system.
Long Entry: A long position is initiated when the closing price crosses over the Lower Bollinger Band (ta.crossover(close,lowerBB)). This signals a potential mean-reversion opportunity following a price dip.
Short Entry: A short position is initiated when the closing price crosses under the Upper Bollinger Band (ta.crossunder(close,upperBB)). (Note: Short entries are disabled by default in the script inputs).
Exit Conditions (Profit Target): Long positions aim to exit upon interaction with the Upper Bollinger Band. Users can select from three exit methods:
"Close When Touch": Exits when close≥upperBB.
"Close Above then Below": Exits when the previous close was above the upper band, and the current close is below it (a reversal signal).
"High Above": Exits when high>upperBB. The strategy features an optional profitOnly setting, which restricts all exits to only occur if the trade is currently in profit (i.e., close is above the strategy.position_avg_price for longs).
Key Features and Customization
Bollinger Bands & Filters -
Customizable BB Parameters: The Length and Deviation of the Bollinger Bands are fully adjustable, allowing users to fine-tune the sensitivity of the entry and exit signals.
Optional EMA Filter: An optional EMA Filter can be enabled to align entries with the prevailing trend, where a Long entry is only permitted if close≥EMA(EmaFilterRange).
Risk and Capital Management -
Equity Allocation: Position size is dynamically calculated based on a Percentage of Equity (capitalPerc) combined with the set Leverage multiplier.
Dynamic Stop Loss (ATR-Based):
An optional Stop Loss (SL) is calculated using a multiple (slAtrInput) of the Average True Range (ATR).
The SL is set relative to the entry price upon trade activation, providing a volatility-adjusted risk management layer.
Position Averaging (Scaling): The script supports the addition of multiple units (pyramiding) to an existing position based on three user-selected criteria:
"No": No averaging.
"Percent": Adds to the position if the price has dropped by a set percentage (addPct) from the average price.
"ATR": Adds to the position if the current price is significantly below a calculated ATR-based support level from the average price.

XRP Non-Stop Strategy (TP 25% / SL 15%)XRP Non-Stop Strategy (TP 25% / SL 15%) is a continuous long-side trading system designed specifically for XRP. The strategy uses an EMA-based trend filter (EMA20/EMA50) to confirm bullish conditions before entering a long position. Each trade applies a fixed +25% Take Profit target and a −15% Stop Loss, calculated dynamically from the entry price.
When a trade closes—whether by TP or SL—the strategy automatically re-enters on the next qualifying signal, enabling uninterrupted position cycling.
Features include:
• EMA-based trend confirmation
• Dynamic TP/SL visualization on the chart
• Clear BUY and EXIT markers
• Dedicated alert conditions for automation
