The Beast (Main)This Indicator combines Trendline Break + Z-Score + Adaptive Re-Entry
🔥 Quick Start
Trade trendline breakouts only
Confirm entries with Z-Score momentum
Optional adaptive re-entries (✕) after pullbacks
Clean signals, no clutter, no repaint
Works best when paired with the Z-Score Oscillator Companion
🚀 Overview
This indicator is a clean, rule-based breakout and continuation system designed to highlight high-quality trend trades while avoiding noise and overtrading.
It combines:
Structural trendline breaks
Statistical momentum (Z-Score)
Adaptive re-entry logic based on timeframe behavior
The result is a disciplined, professional signal framework focused on clarity and confidence rather than signal quantity.
🧠 How It Works
1️⃣ Trendline Break (Structure First)
Signals are only considered after price breaks a dynamically calculated trendline based on swing highs/lows.
This ensures alignment with real market structure.
2️⃣ Z-Score Momentum Confirmation
After a break:
BUY → Z-Score ≥ positive threshold
SELL → Z-Score ≤ negative threshold
This filters out weak moves and confirms statistical momentum, not guesswork.
3️⃣ Controlled Timing Window
Signals are valid only for a limited number of bars after the break.
This avoids late entries and stale setups.
🔁 Adaptive Re-Entries (Optional)
Re-entries allow controlled continuation trades in strong trends.
Marked with a ✕ (cross) for clear distinction
Always occur after a pullback
Printed one bar after confirmation (non-repainting)
Timeframe-aware modes:
Auto (Recommended)
Low / Mid / High TF
Off
A max re-entry limit prevents overexposure.
🔄 Alternate Signal Protection
An optional filter prevents:
BUY → BUY → BUY
SELL → SELL → SELL
This enforces signal discipline and avoids overtrading.
🎨 Visual Design
Primary entries: Arrow or Label (user choice)
Re-entries: ✕ only (always discreet)
Adjustable transparency for clean charts
🛠 Best Use
Trend-focused markets
Crypto, Forex, Indices, Futures
Intraday and Swing trading
Combine with "The Beast (Adaptive Companion)" for maximum clarity.
التقلب

First Strike ORB Strategy [BlackBelt Futures]My own personal take on the opening range breakout.
2:1RR, 45% win rate. Fully automated. DM for access.

VLB Cycle Market ToolThe VLB Dynamic Levels Tool provides a visual framework for observing price structure on XAUUSD.
It displays automatically generated levels based on a rules-based approach, allowing traders to study how price interacts with important reference areas on the chart.
The tool updates dynamically as market structure evolves, reflecting changes in price movement without requiring manual redrawing.
Its purpose is to offer a clear, consistent layout of structural levels that users can incorporate into their own market analysis.
Features:
Automatically displayed structural reference levels
Dynamic recalculation as new highs and lows form
Neutral, non-predictive visual layout
A consistent framework for studying price behavior
This tool does not generate trading signals or provide predictive information.
It simply organizes price structure into visual reference points that may assist users in their independent chart analysis.
Traders remain fully responsible for their own interpretation, timing, and risk management.
The VLB Dynamic Levels Tool is intended for those who prefer a clean and adaptable way to observe XAUUSD structure throughout changing market conditions.

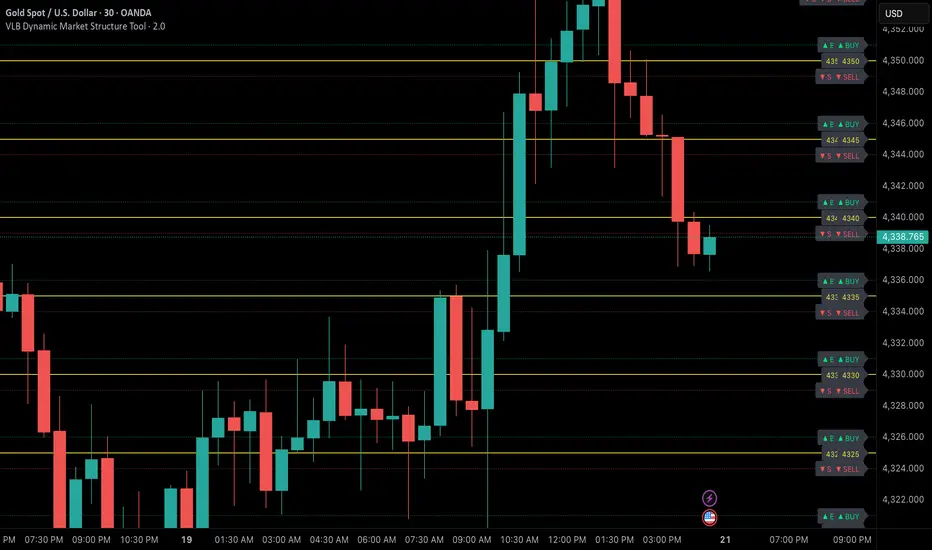
VLB Dynamic Market Structure ToolAdaptive Structural Continuation Framework for XAUUSD
The VLB Dynamic Market Structure Tool is a proprietary, rules-driven market structure framework designed specifically to analyze price continuation behavior in XAUUSD under live market conditions.
This tool does not plot static support and resistance.
Instead, it provides a continuously adapting structural model that reorganizes itself around current price, allowing traders to observe acceptance, rejection, and expansion behavior between key structural zones.
Core Conceptual Foundation
The framework is built on three integrated components that work together as a single methodology:
1. Dynamic Price-Anchored Structural Range
Unlike traditional indicators that rely on fixed historical levels, this tool anchors its entire structural range to live market price.
As price migrates:
Levels that are no longer relevant are automatically removed
New forward-relevant levels are introduced
The framework re-centers itself around active price action
This ensures that the trader is always viewing current, actionable structure, without manual redrawing or chart repositioning.
2. Evenly Spaced Structural Reference Levels
Within the dynamically anchored range, price is organized into consistent structural intervals that frequently act as transition points in XAUUSD price behavior.
These levels serve as objective reference boundaries, allowing traders to:
Compare reactions across identical structural distances
Observe recurring price behavior in a normalized framework
Maintain consistency across different sessions and market conditions
The levels are contextual, not predictive.
3. Post-Break Acceptance & Expansion Zones
The framework distinguishes between:
Initial structural breaks that fail or retrace
Confirmed acceptance beyond a defined offset from the level
Expansion phases as price transitions toward the next structural interval
By visualizing this sequence, the tool allows traders to study continuation behavior only after confirmation, rather than reacting to first-touch or initial breakouts.
Adaptive Behavior (Why This Is Not Static S&R)
A defining feature of the VLB Dynamic Levels Tool is its continuous recalculation and real-time adaptation:
The visible structure evolves with price
The framework moves up or down as market conditions change
Historical clutter is intentionally removed to preserve clarity
The trader’s focus remains on the active trading environment
This adaptive behavior is integral to the methodology and cannot be replicated through manual drawing or static indicators.
Intended Use
This tool is designed for discretionary traders who:
Study market structure, acceptance, and momentum
Prefer confirmation-based continuation frameworks
Value rule-based consistency over subjective interpretation
Combine structural context with their own execution, fundamentals, and risk management
The indicator does not generate automated buy or sell signals and does not execute trades.
Important Disclosures
No performance or outcome is guaranteed
No predictive claims are made
All trading decisions remain the responsibility of the user
Summary
The VLB Dynamic Levels Tool provides a self-adjusting, structurally consistent framework for observing how XAUUSD price transitions between key zones in real time.
Its proprietary value lies in the integration of dynamic price anchoring, structural normalization, and post-break acceptance visualization, offering a methodical way to study continuation behavior in changing market conditions.
Hybrid CCI Scalper ProHybrid CCI Scalper Pro is a sophisticated trading system designed to solve the biggest problem in scalping: False Signals in Choppy Markets.
Unlike standard CCI indicators that fire on every crossover, the HCS Pro uses a Hybrid Logic Engine that distinguishes between high-probability Trend Continuations and powerful Reversal Setups. It processes every potential entry through a 6-factor "Quality Filter" before generating a signal.
Core Features:
1. The Hybrid Signal Engine The script identifies two distinct market conditions:
TREND Mode: Triggers when price is aligned with the Daily/Local trend AND the CCI angle is steep.
REVERSAL Mode (REV): Triggers only on Extreme Momentum (steep angle) combined with a Zero-Line cross, allowing you to catch tops and bottoms without waiting for lagging trend indicators.
2. The Quality Scoring System (Q-Score) Every signal is rated from 0 to 6 stars based on confluence. The signal label shows Q: 4/6, Q: 5/6, etc.
Score 4+: High probability (Recommended).
Score 6: "The Perfect Storm" – All filters (Trend, Volume, RSI, ADX) align.
3. The "Ironclad" Filters To eliminate fake-outs, the script enforces strict rules:
Candle Color Guard: Never Buys on a Red candle or Sells on a Green one.
Angle validation: Flat CCI movement is ignored.
MTF Trend: Checks the Daily timeframe (D1 EMA) to ensure you aren't scalping against the major flow.
Noise Filter: Uses ATR and Volume to ignore low-volatility "dead" markets.
4. The Information Panel A clean dashboard on the top-right displays real-time metrics:
Current Daily Trend (Bull/Bear)
Momentum Strength (Weak/Strong/Extreme)
ADX Power (Trending vs Ranging)
Live Signal Score
How to Trade:
BUY Signal: Look for a Green Triangle. Ideally, the Label should say TREND or REV with a Quality Score of 4/6 or higher.
SELL Signal: Look for a Red Triangle with a high Quality Score.
No Signal? If the panel says "WAIT" or the score is low, the market is likely choppy. Stay out.
Recommended Settings:
Gold (XAUUSD): Works best on 15m.
Forex (EURUSD): Works well on 5m - 15m.
Default settings are optimized for a balance between frequency and accuracy.

Falcon 1Introducing the MyFXSchool Falcon 1Leading Indicator™, a next-generation market prediction tool designed exclusively for traders who want accuracy, clarity, and early trend identification. Built using advanced price-action logic, institutional order-flow concepts, and dynamic volatility algorithms, this indicator gives you a true leading advantage—not just lagging signals.

Falcon 2Introducing the MyFXSchool Falcon 2 Leading Indicator™, a next-generation market prediction tool designed exclusively for traders who want accuracy, clarity, and early trend identification. Built using advanced price-action logic, institutional order-flow concepts, and dynamic volatility algorithms, this indicator gives you a true leading advantage—not just lagging signals.

@tom_w777 Turtles Systems with 2N marks//// @tom_w777
//// 2 systems from the Turtles trading system, including S1 and S2 2N marks for the drawbacks to enter an existing trend
//// data to program it taken from the book : "the complete turtle trader" from Michael W. COVEL
/////////

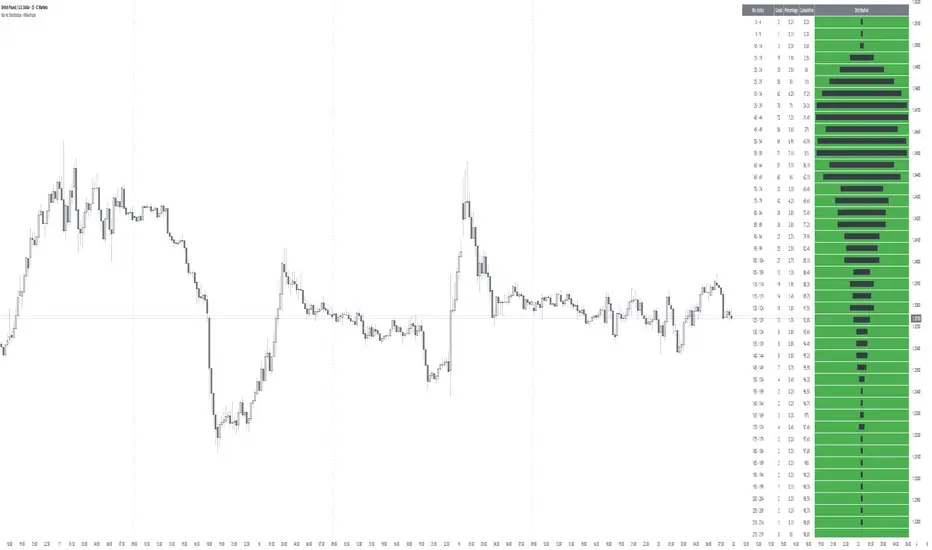
Bar HL Distribution - XWiseTradeBar HL Distribution - XWiseTrade
Analyze the distribution of High-Low ranges over the last N bars.
This indicator groups candle ranges (in ticks) into bins and displays:
• Count per bin
• Percentage and cumulative %
• Visual histogram bars
Perfect for understanding typical volatility, setting realistic targets/stops, and spotting unusual bar sizes.
Features:
• Adjustable lookback and bin size
• Clean table with truncation warning
• Lightweight and always up-to-date
More premium indicators and strategies coming soon at:
xwisetrade.com
Be Wise. Trade X.
VuManChu Strategy [ADX + Vol + Risk] - Good for BTC- The strategy uses the VuManChu WaveTrend oscillator
- Before entering any trade, the ADX filter must show a reading above 25. For more reliable momentum moves
- Three-Layer Exit System:
Fixed Stop Loss (3%): Hard stop placed 3% below entry for longs (above for shorts) to limit maximum loss per trade. This accommodates typical BTC 5-minute volatility without premature stopouts.
Take Profit Target (9%): Fixed profit target at 9% providing a 1:3 risk-reward ratio. This means you only need a 40-50% win rate to be profitable overall.
Conditional Trailing Stop: The most sophisticated protection - a trailing stop that only activates after the trade reaches 4.5% profit (halfway to target). Once activated, it trails price by 2%, locking in gains while still allowing the trade to reach the full 9% target.

quotex with DashboardI’m offering a professionally developed trading strategy with around 80% accuracy based on backtested results.
If you are interested in purchasing the strategy,
please contact me as soon as possible before the TradingView script gets removed.
📩 Telegram: t.me
📲 WhatsApp: wa.me
Serious buyers only.

Frequency AnalyzerFREQUENCY ANALYZER
This indicator is called Frequency Analyzer to analyze the movement of volatility explosion, to detect exploding candles, before they explode. The indicator only describes large volatility would happen in the future, but we don't know, it's volatility as a buy or sell transaction. Of course this has an impact on whether the candle after that occurs a rally or a drop.
That this is useful for detecting exploding candles before exploding, to detect super bullish before bullish, or detect super bearish before bearish. If the candle is in the support position and there is the Spike Bar on Frequency Analyzer, that high probability the exploding volatility becomes a rally. Conversely, if the candle position is in the resistance and there is the Spike Bar on Frequency Analyzer, that high probability the exploding volatility becomes a drop. So this is an indicator to detect exploding candles before they explode, the candles become super rally or super drop.

ATR + Moving AverageThis indicator shows a manually calculated Average True Range (ATR) along with a moving average of the ATR.
The ATR measures current candle volatility.
The ATR Moving Average shows the average candle size over the selected period.
Both can use different smoothing types (RMA, SMA, EMA, WMA) for flexibility.
It’s useful for seeing when price is stretched, volatility is expanding or contracting, and for higher-timeframe mean-reversion analysis.

BBMA by RWBTradeLabBBMA by RWBTradeLab
A clean, non-repainting BBMA indicator built for traders who combine Bollinger Bands with Linear Weighted Moving Averages and EMA to track volatility expansion, price extremes, and confirmed breakout behavior using closed candles only.
What this indicator does
This script combines Bollinger Bands (20, 2) with Linear Weighted Moving Averages (LWMA) and a 50 EMA to help traders identify high-probability price extension zones and confirmed BBMA break conditions—without repainting.
All calculations and alerts are based strictly on closed candles (no running-bar signals).
Core components
Bollinger Bands
*Period: 20
*Deviations: 2
*Apply to: Close
*Visual shift supported (default 0)
*Clean white band structure for clarity
Linear Weighted Moving Averages (LWMA)
*LW MA 5 Low
*LW MA 10 Low
*LW MA 5 High
*LW MA 10 High
These weighted averages react faster to recent price action and help define dynamic BBMA zones.
Exponential Moving Average
*EMA 50
*Apply to: Close
*Method: Exponential
Used as a higher-timeframe trend and structure reference.
BBMA alert logic (closed candle only)
Lower BBMA Break
Triggered when:
*LW MA 5 Low crosses below the Lower Bollinger Band
*The candle closes below the Lower Bollinger Band
*LW MA 5 Low remains below the Lower Bollinger Band after close
Upper BBMA Break
Triggered when:
*LW MA 5 High crosses above the Upper Bollinger Band
*The candle closes above the Upper Bollinger Band
*LW MA 5 High remains above the Upper Bollinger Band after close
⚠️ No alerts are generated on running candles—only on confirmed bar close.
Visuals on chart
*Bollinger Bands plotted in clean white
*LW MAs color-coded for easy distinction
*EMA 50 plotted in green
*Optional show/hide toggles for BB, LW MAs, and EMA
Alerts
Built-in alerts trigger only on candle close:
*BBMA Lower Break (confirmed)
*BBMA Upper Break (confirmed)
Designed for reliable discretionary trading and automation without repainting issues.
Key settings
*BB Period & Deviations
*LW MA periods (5 & 10, High / Low)
*EMA period
*Visual shift for Bollinger Bands
*Individual visibility toggles
Non-repainting confirmation
All calculations, plots, and alerts are based on confirmed candles only.
No running-bar logic → no repainting.
Disclaimer
This indicator is a technical analysis tool, not financial advice.
Trading involves risk—always use proper risk management and confirm signals with your own analysis.
Creator: RWBTradeLab
If you find this indicator useful, please leave a like ⭐ and share your feedback.

London BoxThis indicator specifically optimized for intraday trading strategies.
HOW IT WORKS
Volume and Volatility Analysis:
The opening hours of the London session represent periods when trading volume and volatility typically peak. The indicator is designed to visualize this specific window to highlight the initial market direction and range.
Daily Redraw and Custom Timing:
The boxes are redrawn daily at a user-defined time between 18:00 and 23:30 (UTC+3). This allows traders to refresh their intraday zones consistently according to their preferred daily routine or market close bias.
Timeframe Filtering:
The script is designed to operate on specific timeframes.
Visual Customization:
The box color, background transparency, and the width can be fully adjusted in the settings
KEY FEATURES
Automatic Daily Updates:
Automatically calculates and draws the London session range every single day.
Adjustable Redraw Time:
It offers the flexibility to choose when the box appears on the chart.

EDY Smart Log ChannelEDY Smart Log Channel is a logarithmic price channel indicator designed to visualize market structure in percentage-based (logarithmic) space rather than fixed price levels.
Unlike traditional linear channels, this indicator constructs true parallel channels using logarithmic price calculations, allowing channel bands to expand proportionally with price movement. This makes it suitable for long-term trend analysis, macro market structure evaluation, and assets that exhibit exponential growth behavior.
The indicator supports both horizontal and trend-based channel modes, multiple upper and lower channel copies, optional middle bands, and fully customizable visual settings such as color, thickness, and extension behavior.
As price interacts with the main channel, the structure can adapt dynamically to maintain contextual relevance across different market conditions. Alerts are available for wick touches and close-confirmed breakouts of the main channel bands, helping highlight significant price interactions and potential volatility.
This indicator is intended for analytical and visualization purposes only and does not provide direct buy or sell signals.
Changelog:
v1.0 – Initial public release.

Genesis Vector Ontology [GVO]Overview:
The Genesis Vector Ontology (GVO) is a high-fidelity market analysis tool designed to identify the "Birth" (Genesis) of market trends by calculating the transition from potential energy to kinetic movement. It treats price action not as a random walk, but as a vibrational field that "collapses" into a directional vector when market mass and tension reach a critical threshold.
Core Mathematical Logic:
Ontological Potential (Ψ): Based on the volatility-vibration principle, Ψ measures the energy stored in the price field. Using a normalized standard deviation, the script identifies "Squeeze" states where energy is compressed and ready for release.
Gravitational Mass (g(m)):
Unlike traditional volume indicators, GVO calculates "Mass" as a ratio of current volume relative to a moving average. A move is only considered "Real" (Ontologically Actualized) if it exceeds the user-defined Mass Threshold.
The Vector Resultant: The final Genesis Vector is the product of Potential, Mass, and Directional Momentum ($Vector = \Psi \cdot g(m) \cdot Direction$). This provides a smoothed representation of the true market wave, filtering out noise.
The Mizan (Fairness) Filter: Unique to the GVO framework is the Fairness Filter. By integrating the Money Flow Index (MFI), the script monitors "Greed" and "Fear" zones. It prevents entries in "Unfair" zones (extremes), ensuring that signals occur only when the market is in a state of balanced participation.
How to Use:
Charging (Grey Columns): Market is in a Squeeze state. Energy is building.
Release (Green/Red Columns): Ontological collapse detected. A new vector has been born.
GVO Signals: Labels appear when a Squeeze is released with high-mass confirmation and directional clarity.

Mizan v5: L-Score Framework (Digital)Title: Mizan v5: L-Score Framework (Digital)
Overview: Mizan v5: L-Score is a quantitative multi-factor oscillator designed to measure market "actualization" based on the Mizan Ontological Framework. It synthesizes velocity, saturation, and volume-mass into a single normalized index (L-Score) to distinguish between market noise and established trends
Technical Components:
Velocity (H): Based on a normalized CCI, it measures the rate of price displacement relative to statistical means.
Saturation (T): Utilizes RSI to identify the exhaustion levels of the current directional move.
Volume Mass (R): Implements a corrected Chaikin Money Flow (CMF) calculation to determine the "ontological weight" behind price action.
The L-Score Logic: The final score is a weighted composite of these three elements. By assigning the highest weight to Volume Mass (60%), the indicator ensures that a price move is only validated as "Real" when it is backed by significant capital flow.
How to Read:
L-Score > 65: Strong trend emergence. Ontological collapse into a "Classical" regime is confirmed.
L-Score < 35: Trend degradation. The market is returning to a state of high entropy or reversal.
Background Shading: Visualizes the price location within a global lookback range (Concentration) to provide a macro context for the L-Score signals.

Cosmic Manifestation v1.2: Ontological CloudOverview:
The Ontological Cloud is a forward-projecting volatility bands system based on the philosophy of "Universal Potential" ($\Psi_U$). Unlike standard Bollinger Bands or Keltner Channels, this indicator adjusts its width based on the Probability Strength of the market state.
Core Concepts:
\Psi_U (Universal Potential):
A composite momentum and volatility index (0-100) that measures the degree of market uncertainty. When \Psi_U$ is high, the "Cloud" crystallizes (narrows), signaling a high-probability trend path.g(m)
(Gravitational Drift):
A proprietary calculation using normalized volume-to-price-action ratios. It creates a "gravitational pull" that shifts the cloud's center, predicting the most likely direction of the "collapse" from potential to actual trend.
The Matryoshka Structure:
The cloud consists of a high-probability "Core" and a lower-probability "Atmosphere," visualizing the superposition of price paths.
How to Use:
Crystallization: When the cloud narrows significantly, it indicates a phase transition is imminent.
Gravitational Shift: Green cloud indicates a "Logos Buy" bias, Red indicates "Logos Sell", and Purple signals a state of "Chaos" (Range).
Future Projection: The cloud is offset into the future to help traders visualize the expected path of price realization.

ORB Fusion Adaptive🎯 ORB Fusion Adaptive Strategy
Professional Opening Range Breakout Trading System
═══════════════════════════════════════════════════════════════════════════════
The first fully-automated, multi-instrument ORB strategy on TradingView.
💡 WHAT IT DOES:
Automatically trades Opening Range breakouts and failed breakout reversals with intelligent position sizing, professional risk management, and complete trade lifecycle tracking. Built for serious backtesting and live trading.
⚡ KEY FEATURES:
✓ Automated Entry & Exit (breakouts + reversals)
✓ Adaptive Position Sizing (3 modes: Fixed, Risk-Based, Risk-Based Initial)
✓ Multi-Instrument Support (Futures, Forex, Crypto, Stocks)
✓ Advanced Risk Management (daily limits, drawdown protection)
✓ ML-Powered Breakout Filtering (pContinue/pFail scoring)
✓ Failed Breakout Detection (high-probability reversals)
✓ Native Trailing Stops (Pine Script v5)
✓ Multi-Target Management (T1, T2, T3)
✓ Real-Time Performance Dashboard
✓ Comprehensive Backtesting (5+ years tested)
🎯 STRATEGY LOGIC:
Entry Signals
The strategy enters trades on two high-probability setups:
1. ORB Breakouts
• Detects when price breaks above/below Opening Range
• Confirms with volume (configurable threshold)
• ML filter scores probability of continuation
• Enters within 3 bars of breakout (no late entries)
• Stop placed at ORB midpoint or ATR-based
• Targets at Fibonacci extensions (1.0x, 1.618x, 2.5x ORB range)
2. Failed Breakout Reversals
• Monitors for breakouts that fail and reverse
• Confirms failure after price returns inside ORB
• Automatic reversal entry with tight stops
• Three profit targets (0.5x, 1.0x, 1.5x ORB range)
• Historical 65-75% win rate on reversals
Exit Management
• Stop Loss: Multiple methods (ATR, ORB Mid, ORB Opposite, Hybrid)
• Native Trailing Stop: Activates after configurable R-multiple profit
• Profit Targets: Single target or scaled exits at T1/T2/T3
• Daily Stop: Halts trading after max daily loss
• Drawdown Protection: Circuit breaker at max drawdown threshold
🔧 ADAPTIVE POSITION SIZING:
The strategy's most powerful feature - intelligent position sizing that adapts to your instrument and account:
Mode 1: Fixed
• Simple contract/lot size
• Best for: Testing, stable position sizing
• Use case: "Always trade 2 contracts"
Mode 2: Risk-Based (Current Equity)
• Size = (Current Equity × Risk%) / (Stop Distance × Point Value)
• Compounds with wins, reduces with losses
• Best for: Aggressive compounding
• Use case: Maximize geometric growth
Mode 3: Risk-Based (Initial Capital)
• Size = (Initial Capital × Risk%) / (Stop Distance × Point Value)
• No compounding - consistent risk exposure
• Best for: Professional risk management
• Use case: Live trading with stable risk
Multi-Instrument Intelligence
Auto-detects and calculates correctly for:
• Futures: Uses contract point value (ES $50/pt, NQ $20/pt, MES $5/pt, MNQ $2/pt)
• Forex: Uses pip value per lot (Standard/Mini/Micro/Nano)
• Crypto: Uses contract multiplier (1.0 BTC, 0.001 BTC, etc)
• Stocks: Uses $1 per share
Manual override available if auto-detect fails.
📊 RISK MANAGEMENT:
Multi-Layer Protection
• Per-Trade Risk: 0.5-2% of capital (configurable)
• Daily Risk Limit: Max 4% loss per day (halts trading)
• Max Drawdown Pause: Circuit breaker at 12% drawdown
• Position Size Limits: Min/max contracts enforced
• Max Stop Distance: ATR-based hard limit (prevents catastrophic losses)
Trailing Stop System
• Uses Pine Script's native trail_price and trail_offset
• Activates after configurable R-multiple profit (default 0.5R)
• Trail distance: ATR-based (tight 0.5 ATR to loose 2.0 ATR)
• Works reliably in backtesting AND live trading
• No manual stop management needed
🌍 GLOBAL MARKET SUPPORT:
Configurable Sessions
Unlike basic ORB indicators, this strategy works globally:
• US Equities: 9:30 AM ET default
• Forex London: Custom session 08:00-08:30 GMT
• Forex NY: Custom session 13:30-14:00 GMT
• Asian Markets: Custom session with Tokyo timezone
• Crypto: 24/7 support with custom ORB windows
Timezone support includes:
America/New_York, Europe/London, Asia/Tokyo, Asia/Hong_Kong, UTC, and more.
Session ORBs
• Asian Session ORB (Tokyo open)
• London Session ORB (Forex primary)
• NY Session ORB (US market hours)
Critical for Forex traders working multiple sessions.
📈 BACKTESTING CAPABILITIES:
Realistic Simulation
• Commission: Configurable (default $1 per order)
• Slippage: 2 ticks default (adjustable)
• Volume Confirmation: Prevents unrealistic fills
• RTH Filtering: Optional Regular Trading Hours only
• Bar Magnifier: Improved intrabar execution
Performance Metrics Dashboard
Real-time statistics displayed:
• Total Trades & Win Rate
• Net P&L & Profit Factor
• Current Drawdown
• Daily P&L tracking
• Position details (if in trade)
• Position sizing mode & current size
Historical Testing
• Supports 5000+ bars of history
• Test across multiple market conditions
• Bull markets, bear markets, range-bound periods
• Optimize by day type (trend vs rotation)
🎛️ CUSTOMIZATION OPTIONS:
ORB Settings
• Timeframe: 5, 15, 30, or 60 minutes
• Confirmation: Close, Wick, or Body
• Volume: On/off with multiplier threshold
• LTF Precision: Sub-minute high/low detection
• RTH Filter: Regular Trading Hours only option
Breakout Detection
• ML Filtering: Enable/disable with thresholds
• Failed Breakout: Sensitivity (2-10 bars)
• Failure Buffer: ATR-based confirmation
• Entry Window: Bars after signal (prevents late entries)
Stop Methods
• ATR: Tight dynamic stops (recommended)
• ORB Mid: Structural stop at midpoint
• ORB Opposite: Wide stop at opposite boundary
• Hybrid: Best of ATR and structural
Target Methods
• Single: One target, full exit
• Scaled: Partial exits at T1/T2/T3 (recommended)
• Trail Only: No fixed targets, trail to exit
🔬 OPTIMIZATION GUIDE:
For Futures (ES, NQ, MNQ, MES)
• ORB: 30 min
• Confirmation: Close
• Volume: ON (1.5x)
• Stop Method: ATR (1.0x multiplier)
• Position Mode: Risk-Based (Initial)
• Risk Per Trade: 1.5%
• Failed Breakouts: ENABLE
For Forex Majors
• ORB: 60 min (or 15 min at London open)
• Confirmation: Close
• Volume: OFF (tick volume unreliable)
• Stop Method: ATR (1.5x multiplier)
• Position Mode: Risk-Based (Initial)
• Risk Per Trade: 1.0%
• Custom Session: 0800-0900 GMT
• Timezone: Europe/London
For Crypto (BTC, ETH)
• ORB: 60 min
• Confirmation: Close
• Volume: OFF or ON (1.2x)
• Stop Method: ATR (2.0x wider stops)
• Position Mode: Fixed or Risk-Based
• Risk Per Trade: 2.0% (higher volatility)
• Custom Session: Define your preferred window
For Stocks/ETF
• ORB: 15-30 min
• Confirmation: Body (most conservative)
• Volume: ON (2.0x threshold)
• Stop Method: Hybrid
• Position Mode: Risk-Based (Initial)
• Risk Per Trade: 1.0%
• RTH Only: ENABLED
• Gap Analysis: ENABLED
💎 ADVANCED FEATURES:
Initial Balance Analysis
• First hour range tracking (A + B periods)
• IB extensions at 0.5x, 1.0x, 1.5x, 2.0x
• Day type classification (Trend/Normal/Rotation)
• Adjusts strategy behavior by day type
ORB Extensions
• Fibonacci targets: 1.272x, 1.5x, 1.618x, 2.0x, 2.618x, 3.0x
• Dynamic monitoring for take-profit zones
• Extension tracking in statistics
VWAP Integration
• Institutional benchmark reference
• Standard deviation bands (1σ and 2σ)
• Breakout alignment scoring
• Context for trade quality
Gap Analysis
• Overnight gap detection
• Gap fill target projection
• Gap fill rate statistics
• Direction bias from gap type
Comprehensive Statistics
• Bull/Bear breakout win rates
• Reversal win rate (typically 65-75%)
• Day type distribution
• Extension statistics
• Gap fill rate
• Real-time performance tracking
🎨 VISUAL FEEDBACK:
Enhanced Plots
• ORB levels (High/Low/Mid continuous lines)
• Entry markers (L for long, S for short, 🔥 for reversals)
• Extension levels with labels
• Session ORBs (Asian/London/NY)
• IB levels and extensions
• VWAP with bands
• Failed breakout markers
Color-Coded Momentum Boxes
• Blue: Inside ORB (consolidation)
• Green: Above ORB (bullish momentum)
• Red: Below ORB (bearish momentum)
• Orange: Failed breakout zones
• Variable intensity based on distance
Dynamic Dashboards
• Main Dashboard: ORB status, breakout info, setup details, market context
• Strategy Dashboard: Trades, Win%, P&L, Profit Factor, Daily P&L, Drawdown, Position info
• Narrative Dashboard: Plain-language market interpretation
Three Display Modes
• Simple: Clean chart, essential ORB only
• Standard: ORB + IB + Sessions + VWAP (recommended)
• Advanced: All features + statistics
🔔 ALERT SYSTEM:
Strategy Alerts
• Breakout Entry (with ML probabilities)
• Failed Breakout Entry (with targets)
• Stop Hit (position closed)
• Target Hit (T1, T2, T3 partials)
• Extension Reached (profit zone)
• IB Break (potential trend day)
All alerts include:
• Direction and setup type
• Entry price and position size
• Stop and target levels
• ML scores (if enabled)
• Setup grade (A+ to D)
• Win rate context
⏱️ TIMEFRAMES: 1m-15m optimal (works on all)
💎 INSTRUMENTS: Futures, Forex, Crypto, Stocks, Indices
🎓 SKILL LEVEL: Intermediate to Advanced
📚 WHAT'S INCLUDED:
Comprehensive Documentation
• 200+ lines of detailed tooltips
• Every setting fully explained
• Optimization guides by market
• Position sizing calculator explanations
• Risk management framework
• Best practices and common pitfalls
Ready-to-Use Configurations
• Default settings optimized for ES/NQ
• Recommended settings for each instrument type
• Conservative vs Aggressive profiles
• Scalping vs Swing configurations
Full Transparency
• All calculations shown in dashboard
• Position sizing visible in real-time
• Strategy performance metrics live
• No black boxes or hidden logic
🚨 RISK DISCLAIMERS:
CRITICAL INFORMATION - PLEASE READ:
• This is a trading strategy that executes real trades in backtesting
• Past performance does NOT guarantee future results
• All trading involves substantial risk of loss
• Never risk money you cannot afford to lose
• This is NOT financial advice - for educational purposes only
• Requires understanding of ORB methodology and risk management
• Test thoroughly on paper/demo account before live trading
• Position sizing must be configured correctly for your account
• Stop losses are NOT guaranteed in all market conditions
• Slippage and commissions will affect live results
• Volatile markets may trigger circuit breakers (drawdown pause)
Strategy-Specific Risks:
• Opening range breakouts can fail (hence the reversal system)
• Volume confirmation may limit signals in low-volume instruments
• Custom sessions must match your market's actual hours
• Multi-instrument support requires correct point value configuration
• Trailing stops may exit early in volatile conditions
• Daily limits may prevent recovery trades
• Backtesting results may not match live execution
Position Sizing Warnings:
• Risk-Based modes can size large positions if stops are tight
• Always set max position size limits appropriate for your account
• Verify point values are correct for your instrument
• Test with small size first
• Monitor position size in dashboard before every trade
🎓 WHO THIS IS FOR:
Best Suited For:
• Traders with ORB methodology knowledge
• Those seeking a fully-automated system
• Backtesting enthusiasts
• Multi-instrument traders
• Risk-conscious systematic traders
• Traders who understand position sizing
Not Recommended For:
• Complete beginners to trading
• Those seeking "set and forget" with zero monitoring
• Traders unwilling to backtest first
• Those who don't understand risk management
• Accounts under $5,000 (position sizing too small)
💡 PRO TIPS:
Backtesting Best Practices
• Start with 2+ years of data
• Include both bull and bear markets
• Test on same timeframe you'll trade (5-min for 5-min ORB)
• Account for commissions/slippage realistically
• Verify win rate >45% and profit factor >1.3
Position Sizing
• Use Risk-Based (Initial Capital) for most consistent results
• Start with 1% risk per trade, increase to 1.5-2% if comfortable
• Set max position size to prevent oversizing
• Verify point values are correct before live trading
• Monitor dashboard for actual size before each trade
Risk Management
• NEVER disable daily loss limit
• Keep max drawdown pause at 12% or lower
• Use ATR stop method for best R:R
• Enable trailing stops for trend capturing
• Take partial profits at T1 (at least 30-40%)
Failed Breakout Trading
• These are your highest win-rate setups (65-75%)
• Always enable this feature
• Use tighter stops on reversals than breakouts
• Don't chase if you miss the entry window
• Three targets allow you to scale out profitably
ML Filtering
• Dramatically improves breakout quality
• Reduce signals but increase win rate
• Start with default thresholds (pCont≥0.55, pFail≤0.35)
• Lower signals = higher quality in choppy markets
• Can disable for more signals in strong trends
⚙️ TECHNICAL DETAILS:
Strategy Engine
• Pine Script v5
• Native strategy.entry() and strategy.exit()
• Trailing stops use trail_price/trail_offset (no repainting)
• Proper position sizing with strategy.position_size
• Realistic fills with commission and slippage
• Bar magnifier for improved intrabar execution
Performance
• Optimized for 1-minute to 15-minute charts
• Supports 5000+ bars of history
• Efficient calculations (no arrays in hot loops)
• Max 500 visual objects (boxes/lines/labels)
• No repainting - all signals confirmed on bar close
Position Sizing Engine
• Auto-detects Futures, Forex, Crypto, Stocks
• Uses syminfo.pointvalue when available
• Falls back to manual configuration
• Proper rounding to exchange increments
• Min/max limits enforced
Risk System
• Per-trade risk percentage enforced
• Daily P&L tracking
• Drawdown from peak equity
• Circuit breakers halt trading when limits hit
• Resets daily for fresh start
🔄 VERSION HISTORY:
Current Version: 1.0 (Initial Release)
• Complete ORB breakout + reversal strategy
• Adaptive position sizing (3 modes)
• Multi-instrument support
• Advanced risk management
• Native trailing stops
• ML filtering integration
• Comprehensive backtesting
• Real-time performance dashboard
Planned Updates:
• Additional session templates (Tokyo, Sydney)
• More stop methods
• Enhanced ML model training
• Volatility regime detection
• Trade journal export
═══════════════════════════════════════════════════════════════════════════════
Trade the opening range with institutional precision.
Automated entries. Intelligent sizing. Professional risk management.
Test first. Trade smart. Scale safely.
Taking you to school. — Dskyz, Trade with insight. Trade with anticipation.

Sen Regression ChannelSen Regression Channel
OVERVIEW
The Sen Regression Channel is a trend-structure visualization tool built on the Theil–Sen estimator, a median-based regression method designed to reduce sensitivity to price outliers. Unlike traditional least-squares regression channels, this approach anchors trend using the most representative slope across the lookback period, resulting in a more stable and noise-resistant structure.
TECHNICAL LOGIC & ORIGINALITY
To protect the proprietary implementation of the median-slope engine and adaptive band construction, this script is published as Protected.
Median Slope Engine
Calculates the Theil–Sen slope by evaluating the median rate of change across the lookback window, producing a trendline less distorted by extreme candles or transient volatility.
Adaptive Volatility Bands
Channel width can be derived from either Standard Deviation or ATR, allowing the envelope to adjust dynamically to changing volatility regimes.
Multi-Reference Context (Optional)
VWAP and EMA/SMA overlays can be enabled to compare the median regression structure against commonly used price and volume-weighted references.
HOW TO USE (EDUCATIONAL)
This tool is designed to help analyze trend quality and market structure, not to generate trade signals.
Trend Direction & Stability
A sustained upward or downward slope of the median regression line indicates directional structure with reduced noise sensitivity.
Volatility Expansion Zones
Price closing outside the channel bands highlights volatility expansion relative to the median trend and may signal regime change.
Mean-Reversion Context
Price oscillation between the median line and bands reflects balanced conditions; movement toward the outer bands indicates relative extension.
VWAP Confluence
Alignment between the regression midline and VWAP may highlight areas of consensus value.
USER INPUTS
Lookback Period – Sets the window for the median slope calculation
Band Multiplier – Scales the channel width
Band Method – Standard Deviation or ATR-based envelope
Visual Overlays – Toggle VWAP, midline, and cloud transparency
NOTES
This script is a historical charting and visualization tool for educational purposes only.
It does not provide trade signals, alerts, or financial advice.
All values are calculated in real time using available chart data.
Market State & Candlestick Patterns Made in ChinaIndicator Overview
The Market State & Candlestick Patterns Master (MSCP-Master) is a comprehensive, all-in-one technical analysis indicator that combines real-time market state identification with multiple candlestick pattern recognition. This powerful tool not only identifies classic price action patterns but also adapts their significance based on the current market volatility environment, providing context-aware trading signals for smarter decision-making.
Core Innovation: Adaptive Pattern Recognition
Traditional candlestick pattern indicators work in isolation, often giving false signals in the wrong market conditions. MSCP-Master revolutionizes this approach by:
First assessing market state (Low Volatility/Ranging/High Volatility) through a multi-dimensional scoring system
Then applying different confirmation criteria for each pattern based on the detected market state
Finally providing context-aware signals that are more reliable because they consider the broader market environment
Three-Layer Analysis System
Layer 1: Market State Identification (The Foundation)
Uses four key metrics to calculate a comprehensive market state score:
ATR Relative Volatility: Measures current volatility against historical norms
Bollinger Band Width: Identifies contraction/expansion periods
Amplitude Analysis: Evaluates recent price range activity
Momentum Strength: Assesses directional movement power
Based on the composite score, the market is classified into:
🔵 Low Volatility: Tight ranges, potential for breakout
🟡 Ranging: Normal oscillation within established bounds
🟢 High Volatility: Wide ranges, strong momentum moves
Layer 2: Pattern Recognition With Context Adaptation
Each pattern uses different confirmation logic based on market state:
High Volatility State: Uses SMA-based trend confirmation (Long/Short SMA comparison)
Low Volatility/Ranging States: Uses ATR-adjusted threshold confirmation (dynamic based on current vs. baseline volatility)
This adaptive approach means patterns are only considered valid when they make sense for the current market environment.
Layer 3: Comprehensive Pattern Library
The indicator identifies 10+ critical candlestick patterns:
Engulfing Patterns (Bullish/Bearish) with Harami confirmation requirement
Outside Bars (Bullish/Bearish) with customizable engulfing criteria
False Breakouts (Bullish/Bearish) with sophisticated tracking of "trap" moves
Hammer/Inverted Hammer with ATR-adjusted significance thresholds
Doji Variations (Standard, Dragonfly, Gravestone) with precise mathematical definitions
Three Soldiers Method (Enhanced) with dual absolute/relative strength measurements
Enhanced Three Soldiers Method - Beyond Traditional Interpretation
Unlike traditional "Three White Soldiers/Black Crows" patterns that rely on simple visual recognition, our enhanced version introduces:
Quantifiable Strength Metrics: Each candle must meet customizable thresholds for both absolute price movement (%) and relative efficiency (close-to-open vs. total range)
Two Signal Types: Preparation signals (amber) for early warnings and True signals (green/red) for confirmed breakouts
Breakout Confirmation: "True signals" only trigger when price breaks above/below recent signal cluster extremes
Full Customization: All parameters adjustable to match your trading style and market conditions
Key Features
🎯 Context-Aware Signals: Patterns are validated differently in high vs. low volatility markets
📊 Real-Time Market State: Clear color-coded background shows current market conditions
🔍 Multiple Confirmation Methods: Uses both SMA trend-following and ATR-adjusted threshold approaches
⚙️ Fully Customizable: Every parameter adjustable across all pattern types and market state calculations
📈 Comprehensive Visualization: Color-coded labels, reference lines, and information tables
Strategic Application
Preparation Signals: Use amber "single candle" or "three candle" signals to prepare for potential moves
True Signals: Green/red "True" signals indicate confirmed momentum - ideal for main entries
Market State Alignment: Trade with the market's character - aggressive in high volatility, cautious in low volatility
Pattern Convergence: Look for multiple patterns confirming the same direction for higher probability setups
Parameter Groups (Organized for Easy Customization)
Market State Identification: ATR, Bollinger Band, Amplitude, Momentum parameters
Pattern-Specific Settings: Engulfing, Outside Bars, False Breakouts, Hammer/Doji patterns
Three Soldiers Method: Absolute/Relative strength thresholds, lookback periods
Confirmation Logic: SMA lengths, ATR adjustment factors, sensitivity settings

Linear Regression Channel with Crossover SignalsLinear Regression Channel with Crossover Signals is an overlay indicator that plots a statistically derived **linear regression channel** around price and optionally generates **crossover / re-entry signals**, labels, alerts, and a small on-chart dashboard. It is designed to help visualize trend direction (via regression slope), typical price “containment” (via deviation bands), and potential breakout/mean-reversion events when price interacts with the channel.
---
## What this indicator shows
### 1) Linear Regression Midline (trend estimate)
The midline is the **linear regression value** of `close` over the selected *Regression Length*. It represents the “best fit” straight line through the last *N* bars, providing:
- **Trend direction** (via slope: rising/falling/flat)
- A dynamic reference level for midline cross signals (optional)
### 2) Upper / Lower Deviation Bands (channel)
A channel is built around the regression midline using the **standard deviation of price from the regression line**:
- Upper Band = midline + (stdDev × Deviation Multiplier)
- Lower Band = midline − (stdDev × Deviation Multiplier)
This creates a volatility-scaled envelope that adapts to how tightly or loosely price has been tracking the regression line.
### 3) Optional visual aids
You can independently toggle:
- Channel lines (upper/lower)
- Midline
- Channel fill (shaded area between bands)
- Background coloring to reflect whether price is **above / inside / below** the channel
A dashboard (optional) displays live values and context such as band values, distance from bands, current position, and trend direction.
---
## How it works (calculation overview)
### Regression calculation (manual)
The script calculates slope and intercept using a least-squares approach across the last `lengthInput` bars:
- It iterates over the window, builds sums (X, Y, XY, X²), and computes:
- **Slope** and **Intercept** of the regression line
- The midline value plotted is the regression value at the most recent point in the window.
### Standard deviation from the regression line
Instead of using standard deviation of closes directly, it measures the **deviation of each close from the regression line** and computes:
- variance = average of squared deviations
- stdDev = sqrt(variance)
This is what makes the channel represent “how far price typically strays from the trend line” over the lookback period.
---
## Signal logic (what triggers markers)
All signals are optional and controlled by the **Signal Types** toggles.
### A) Upper band cross signals (optional)
- **Upper Breakout (OB)**: price crosses **above** the Upper Band (`crossover(close, upperBand)`)
- **Upper Re-entry**: price crosses **back below** the Upper Band (`crossunder(close, upperBand)`)
These are often interpreted as “extension above channel” and “return from extension,” but interpretation depends on your style (breakout vs mean reversion).
### B) Lower band cross signals (optional)
- **Lower Breakdown (OS)**: price crosses **below** the Lower Band (`crossunder(close, lowerBand)`)
- **Lower Re-entry**: price crosses **back above** the Lower Band (`crossover(close, lowerBand)`)
### C) Midline cross signals (optional)
- **Mid Bullish**: price crosses above the regression midline
- **Mid Bearish**: price crosses below the regression midline
### D) Re-entry-to-channel signals (enabled by default)
The script tracks whether price was previously:
- **above** the channel (close > upperBand)
- **below** the channel (close < lowerBand)
- **inside** the channel
It then triggers “re-entry” when price returns inside the channel:
- **Bullish Re-entry (Bounce Support)**: price was below and crosses back above the Lower Band
- **Bearish Re-entry (Rejection Resistance)**: price was above and crosses back below the Upper Band
These are intended to highlight potential mean-reversion acceptance back into the “normal” channel range.
---
## Plot markers and labels (what you’ll see)
If enabled, the indicator can plot:
- Triangles and circles for band/midline crosses (with short text such as **OB**, **OS**, ▲, ▼)
- Diamond markers for re-entry confirmations (✓ / ✗)
- Optional text labels describing the event (e.g., “OVERBOUGHT Breakout”, “REJECTION Resistance”, etc.)
Note: this script sets high label/line limits (`max_labels_count` / `max_lines_count`) to reduce the chance of hitting platform limits when many signals occur.
---
## Alerts (optional)
When “Enable Alerts” is ON, the script can fire alerts for:
- Upper breakout / upper re-entry
- Lower breakdown / lower re-entry
- Re-entry bounce / re-entry rejection
- Midline bullish / bearish cross
Alerts are triggered **once per bar** when conditions occur. They are informational and should be validated within your trading plan.
---
## Inputs (how to tune it)
### Channel Settings
- **Regression Length**: larger = smoother and slower to react; smaller = more responsive but noisier
- **Deviation Multiplier**: larger = wider channel (fewer band touches); smaller = tighter channel (more touches)
- **Extend Forward**: present as an input, but this version does not draw forward-projected lines; it primarily affects nothing visually unless you add line objects later
### Signal Settings / Types
- Enable only the signal types you actually use to keep charts clean.
- Re-entry signals are ON by default because they depend on context (previously outside → back inside), which many traders find more meaningful than a single cross alone.
### Visual Settings
- Show/hide channel, midline, fill, background coloring
- Customize colors for upper/lower/mid and fill for readability
---
## Limitations / notes (important for public descriptions)
- This is an **indicator**, not a strategy; it does not backtest performance.
- Linear regression channels are **context-dependent**: strong trends can “ride” a band, and ranging markets can produce frequent crosses.
- Signals are based on **price crossing computed bands** and do not predict direction by themselves.
- Standard deviation bands reflect past dispersion around the regression line; volatility regime shifts can change behavior quickly.
- Always apply risk management and confirm with additional context (structure, volume, higher timeframe bias, session conditions, etc.).
