TR ADR/AWR/AMR (with 25%, 50%, 75%) - RodolfoThis script uses the TR ADR/AWR/AMR indicator code and only the 25 and 75% levels for all 3 volatilities
النطاقات والقنوات

Multi-Timeframe EMA Trend Dashboard with Volume and RSI Filters═══════════════════════════════════════════════════════════
MULTI-TIMEFRAME EMA TREND DASHBOARD
═══════════════════════════════════════════════════════════
OVERVIEW
This indicator provides a comprehensive view of trend direction across multiple timeframes using the classic EMA 20/50 crossover methodology, enhanced with volume confirmation and RSI filtering. It aggregates trend information from six timeframes into a single dashboard for efficient market analysis.
The indicator is designed for educational purposes and to assist traders in identifying potential trend alignments across different time horizons.
═══════════════════════════════════════════════════════════
FEATURES
═══════════════════════════════════════════════════════════
MULTI-TIMEFRAME ANALYSIS
• Monitors 6 timeframes simultaneously: 1m, 5m, 15m, 1H, 4H, 1D
• Each timeframe analyzed independently using request.security()
• Non-repainting implementation with proper lookahead settings
• Calculates overall trend strength as percentage of bullish timeframes
EMA CROSSOVER SYSTEM
• Fast EMA (default: 20) and Slow EMA (default: 50)
• Bullish: Fast EMA > Slow EMA
• Bearish: Fast EMA < Slow EMA
• Neutral: Fast EMA = Slow EMA (rare condition)
• Visual EMA plots with optional fill area
VOLUME CONFIRMATION
• Optional volume filter for crossover signals
• Compares current volume against moving average (default: 20-period SMA)
• Categorizes volume as: High (>1.5x average), Normal (>average), Low (70), oversold (<30), and neutral zones
• Used in quality score calculation
• Optional display toggle
SUPPORT & RESISTANCE DETECTION
• Automatic detection using highest/lowest over lookback period (default: 50 bars)
• Plots resistance (red), support (green), and mid-level (gray)
• Step-line style for clear visualization
• Optional display toggle
QUALITY SCORING SYSTEM
• Rates trade setups from 1-5 stars
• Considers: MTF alignment, volume confirmation, RSI positioning
• 5 stars: 4+ timeframes aligned + volume confirmed + RSI 50-70
• 4 stars: 4+ timeframes aligned + volume confirmed
• 3 stars: 3+ timeframes aligned
• 2 stars: Exactly 3 timeframes aligned
• 1 star: Other conditions
VISUAL DASHBOARD
• Clean table display (position customizable)
• Color-coded trend indicators (green/red/yellow)
• Extended statistics panel (toggleable)
• Shows: Trends, Strength, Quality, RSI, Volume, Price Distance
═══════════════════════════════════════════════════════════
TECHNICAL SPECIFICATIONS
═══════════════════════════════════════════════════════════
CALCULATIONS
Trend Determination per Timeframe:
• request.security() fetches EMA values with gaps=off, lookahead=off
• Compares Fast EMA vs Slow EMA
• Returns: 1 (bullish), -1 (bearish), 0 (neutral)
Trend Strength:
• Counts number of bullish timeframes
• Formula: (bullish_count / 6) × 100
• Range: 0% (all bearish) to 100% (all bullish)
Price Distance from EMA:
• Formula: ((close - EMA) / EMA) × 100
• Positive: Price above EMA
• Negative: Price below EMA
• Warning when absolute distance > 5%
ANTI-REPAINTING MEASURES
• All request.security() calls use lookahead=barmerge.lookahead_off
• Dashboard updates only on barstate.islast
• Historical bars remain unchanged
• Crossover signals finalize on bar close
═══════════════════════════════════════════════════════════
USAGE GUIDE
═══════════════════════════════════════════════════════════
INTERPRETING THE DASHBOARD
Timeframe Rows:
• Each row shows individual timeframe trend status
• Look for alignment (multiple timeframes same direction)
• Higher timeframes generally more significant
Strength Indicator:
• >66.67%: Strong bullish (4+ timeframes bullish)
• 33.33-66.67%: Mixed/choppy conditions
• <33.33%: Strong bearish (4+ timeframes bearish)
Quality Score:
• Higher stars = better confluence of factors
• 5-star setups have strongest multi-factor confirmation
• Lower scores may indicate weaker or conflicting signals
SUGGESTED APPLICATIONS
Trend Confirmation:
• Check if multiple timeframes confirm current chart trend
• Higher agreement = stronger trend confidence
• Use for position sizing decisions
Entry Timing:
• Wait for EMA crossover on chart timeframe
• Confirm with higher timeframe alignment
• Volume above average preferred
• RSI not in extreme zones
Divergence Detection:
• When lower timeframes diverge from higher
• May indicate trend exhaustion or reversal
• Requires additional confirmation
CUSTOMIZATION
EMA Settings:
• Adjust Fast/Slow lengths for different sensitivities
• Shorter periods = more responsive, more signals
• Longer periods = smoother, fewer signals
• Common alternatives: 10/30, 12/26, 50/200
Volume Filter:
• Enable for higher-quality signals (fewer false positives)
• Disable in always-liquid markets or for more signals
• Adjust MA length based on typical volume patterns
Display Options:
• Toggle EMAs, S/R levels, extended stats as needed
• Choose dashboard position to avoid chart overlap
• Adjust colors for visibility preferences
═══════════════════════════════════════════════════════════
ALERTS
═══════════════════════════════════════════════════════════
AVAILABLE ALERT CONDITIONS
1. Bullish EMA Cross (Volume Confirmed)
2. Bearish EMA Cross (Volume Confirmed)
3. Strong Bullish Alignment (4+ timeframes)
4. Strong Bearish Alignment (4+ timeframes)
5. Trend Strength Increasing (>16.67% jump)
6. Trend Strength Decreasing (>16.67% drop)
7. Excellent Trade Setup (5-star rating)
Alert messages use standard placeholders:
• {{ticker}} - Symbol name
• {{close}} - Current close price
• {{time}} - Bar timestamp
═══════════════════════════════════════════════════════════
LIMITATIONS & CONSIDERATIONS
═══════════════════════════════════════════════════════════
KNOWN LIMITATIONS
• Lower timeframe data may not be available on all symbols
• 1-minute data typically limited to recent history
• request.security() subject to TradingView data limits
• Dashboard requires screen space (may overlap on small screens)
• More complex calculations may affect load time on slower devices
NOT SUITABLE FOR
• Highly volatile/illiquid instruments (many false signals)
• News-driven markets during announcements
• Automated trading without additional filters
• Markets where EMA strategies don't perform well
DOES NOT PROVIDE
• Exact entry/exit prices
• Stop-loss or take-profit levels
• Position sizing recommendations
• Guaranteed profit signals
• Market predictions
═══════════════════════════════════════════════════════════
BEST PRACTICES
═══════════════════════════════════════════════════════════
RECOMMENDED USAGE
✓ Combine with price action analysis
✓ Use appropriate risk management
✓ Backtest on historical data before live use
✓ Adjust settings for specific market characteristics
✓ Wait for higher-quality setups in important trades
✓ Consider overall market context and fundamentals
NOT RECOMMENDED
✗ Using as standalone trading system without confirmation
✗ Trading every signal without discretion
✗ Ignoring risk management principles
✗ Trading without understanding the methodology
✗ Applying to unsuitable markets/timeframes
═══════════════════════════════════════════════════════════
EDUCATIONAL BACKGROUND
═══════════════════════════════════════════════════════════
EMA CROSSOVER STRATEGY
The Exponential Moving Average crossover is a classical trend-following technique:
• Golden Cross: Fast EMA crosses above Slow EMA (bullish signal)
• Death Cross: Fast EMA crosses below Slow EMA (bearish signal)
• Widely used since the 1970s in various markets
• More responsive than SMA due to exponential weighting
MULTI-TIMEFRAME ANALYSIS
Analyzing multiple timeframes helps traders:
• Identify alignment between short and long-term trends
• Reduce false signals from single-timeframe noise
• Understand market context across different horizons
• Make informed decisions about trade duration
VOLUME ANALYSIS
Volume confirmation adds reliability:
• High volume suggests institutional participation
• Low volume signals may indicate false breakouts
• Volume precedes price in many market theories
• Helps distinguish genuine moves from noise
═══════════════════════════════════════════════════════════
TECHNICAL IMPLEMENTATION
═══════════════════════════════════════════════════════════
CODE STRUCTURE
• Organized in clear sections with proper commenting
• Uses explicit type declarations (int, float, bool, color, string)
• Constants defined at top (BULLISH=1, BEARISH=-1, etc.)
• Functions documented with @function, @param, @returns
• Follows PineCoders naming conventions (camelCase variables)
PERFORMANCE OPTIMIZATION
• var keyword for table (created once, not every bar)
• Calculations cached where possible
• Dashboard updates only on last bar
• Minimal redundant security() calls
SECURITY IMPLEMENTATION
• Proper gaps and lookahead parameters
• No future data leakage
• Signals finalize on bar close
• Historical bars remain static
═══════════════════════════════════════════════════════════
VERSION INFORMATION
═══════════════════════════════════════════════════════════
Current Version: 2.0
Pine Script Version: 5
Last Updated: 2024
Developed by: Zakaria Safri
═══════════════════════════════════════════════════════════
SETTINGS REFERENCE
═══════════════════════════════════════════════════════════
EMA SETTINGS
• Fast EMA Length: 1-500 (default: 20)
• Slow EMA Length: 1-500 (default: 50)
VOLUME & MOMENTUM
• Use Volume Confirmation: true/false (default: true)
• Volume MA Length: 1-500 (default: 20)
• Show RSI Levels: true/false (default: true)
• RSI Length: 1-500 (default: 14)
PRICE ACTION FEATURES
• Show Price Distance: true/false (default: true)
• Show Key Levels: true/false (default: true)
• S/R Lookback Period: 10-500 (default: 50)
DISPLAY SETTINGS
• Show EMAs on Chart: true/false (default: true)
• Fast EMA Color: customizable (default: cyan)
• Slow EMA Color: customizable (default: orange)
• EMA Line Width: 1-5 (default: 2)
• Show Fill Between EMAs: true/false (default: true)
• Show Crossover Signals: true/false (default: true)
DASHBOARD SETTINGS
• Position: Top Left/Right, Bottom Left/Right
• Show Extended Statistics: true/false (default: true)
ALERT SETTINGS
• Alert on Multi-TF Alignment: true/false (default: true)
• Alert on Trend Strength Change: true/false (default: true)
═══════════════════════════════════════════════════════════
RISK DISCLAIMER
═══════════════════════════════════════════════════════════
This indicator is provided for educational and informational purposes only. It should not be considered financial advice or a recommendation to buy or sell any security.
IMPORTANT NOTICES:
• Past performance does not indicate future results
• All trading involves risk of capital loss
• No indicator guarantees profitable trades
• Always conduct independent research and analysis
• Use proper risk management and position sizing
• Consult a qualified financial advisor before trading
• The developer assumes no liability for trading losses
By using this indicator, you acknowledge that you understand these risks and accept full responsibility for your trading decisions.
═══════════════════════════════════════════════════════════
SUPPORT & CONTRIBUTIONS
═══════════════════════════════════════════════════════════
FEEDBACK WELCOME
• Constructive comments appreciated
• Bug reports help improve the indicator
• Feature suggestions considered for future versions
• Share your experience to help other users
OPEN SOURCE
This code is published as open source for the TradingView community to:
• Learn from the implementation
• Modify for personal use
• Understand multi-timeframe analysis techniques
If you find this indicator useful, please consider:
• Leaving a thoughtful review
• Sharing with other traders who might benefit
• Following for future updates and releases
═══════════════════════════════════════════════════════════
ADDITIONAL RESOURCES
═══════════════════════════════════════════════════════════
RECOMMENDED READING
• TradingView Pine Script documentation
• PineCoders community resources
• Technical analysis textbooks on moving averages
• Multi-timeframe trading strategy guides
• Risk management principles
RELATED CONCEPTS
• Trend following strategies
• Moving average convergence/divergence
• Multiple timeframe analysis
• Volume-price relationships
• Momentum indicators
═══════════════════════════════════════════════════════════
Thank you for using this indicator. Trade responsibly and continue learning!
═══════════════════════════════════════════════════════════

Power candle_v4-----------------------------Power candle_v4Power candle_v4------------------------------------------------
-----------------------------Power candle_v4Power candle_v4------------------------------------------------
-----------------------------Power candle_v4Power candle_v4------------------------------------------------
-----------------------------Power candle_v4Power candle_v4------------------------------------------------
-----------------------------Power candle_v4Power candle_v4------------------------------------------------
-----------------------------Power candle_v4Power candle_v4------------------------------------------------
-----------------------------Power candle_v4Power candle_v4------------------------------------------------
-----------------------------Power candle_v4Power candle_v4------------------------------------------------
-----------------------------Power candle_v4Power candle_v4-----------------------------------------------------------------------------Power candle_v4Power candle_v4-----------------------------------------------------------------------------Power candle_v4Power candle_v4-----------------------------------------------------------------------------Power candle_v4Power candle_v4-----------------------------------------------------------------------------Power candle_v4Power candle_v4-----------------------------------------------------------------------------Power candle_v4Power candle_v4------------------------------------------------

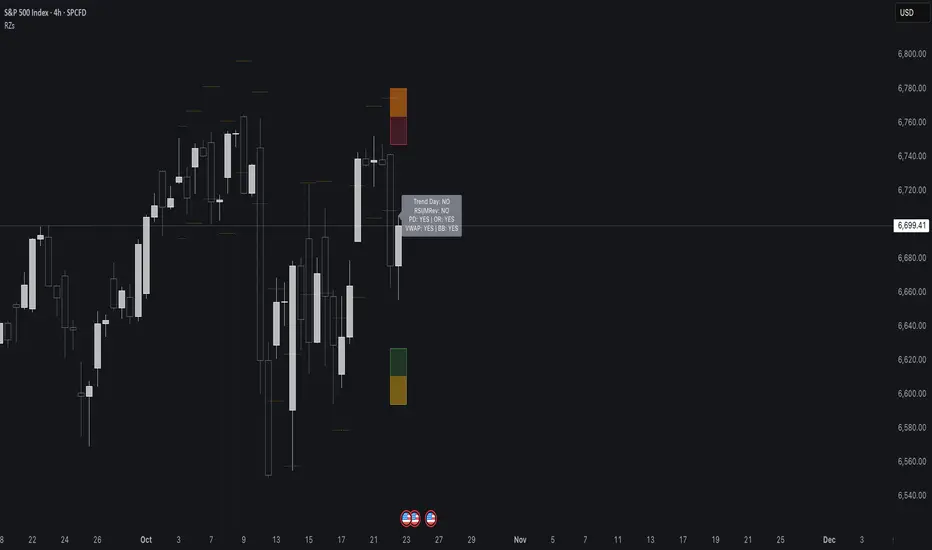
Reversal Zones// This indicator identifies likely reversal zones above and below current price by aggregating multiple technical signals:
// • Prior Day High/Low
// • Opening Range (9:30–10:00)
// • VWAP ±2 standard deviations
// • 60‑minute Bollinger Bands
// It draws shaded boxes for each base level, then computes a single upper/lower reversal zone (closest level from combined signals),
// with configurable zone width based on the expected move (EM). Within those reversal zones, it highlights an inner “strike zone”
// (percentage of the box) to suggest optimal short-option strikes for credit spreads or iron condors.
// Additional features:
// • Optional Expected Move lines from the RTH open
// • 15‑minute RSI/Mean‑Reversion and Trend‑Day confluence flags displayed in a dashboard
// • Toggles to include/exclude each signal and adjust styling
// How to use:
// 1. Adjust inputs to select which levels to include and set the expected move parameters.
// 2. Reversal boxes (red above, green below) show zones where price is most likely to reverse.
// 3. Inner strike zones (darker shading) guide optimal short-strike placement.
// 4. Dashboard confirms whether mean-reversion or trend-day conditions are active.
// Customize colors and visibility in the settings panel. Enjoy disciplined, confluence-based trade entries!
The Vishnu Zone Ver 2 by Dr. Sudhir Khollam## 📜 **The Vishnu Zone — Trade When the Brahma Zone Ends**
**Author:** Dr. Sudhir Khollam (SALSA© Method of Astrology & Market Psychology)
**Category:** Volatility Phase Detection / Bollinger Band Expansion Analysis
---
### 🔶 **Concept Overview**
In the **SALSA© Market Philosophy**, every market phase follows a cosmic rhythm —
* **Brahma Phase** represents *creation and expansion* (high volatility and strong directional movement).
* **Vishnu Phase** represents *maintenance and stability* (where expansion cools down and balanced opportunities appear).
**“The Vishnu Zone”** indicator identifies the exact moments when the **Brahma Phase ends** — signaling that the expansion has completed and the market is likely to enter a more stable, tradable state.
This is a **precision-timing indicator** that helps traders avoid entering at the end of impulsive phases and instead prepare for equilibrium-based trades (mean reversion, range setups, or steady trends).
---
### ⚙️ **How It Works**
The indicator measures **Bollinger Band Width (BBW)** to quantify expansion and contraction in volatility.
1. It calculates the **adaptive expansion threshold** using the average BBW over a rolling lookback period.
2. When the current BBW **drops below** this adaptive threshold **after being above it**, the script marks it as the **end of the Brahma Phase**.
3. This moment is shown visually as:
* 🕉 **“Vishnu” label** above the candle
* A **horizontal dotted line** extending for several bars
Together, these mark a **Vishnu Zone**, where the market transitions from expansion to consolidation — an ideal time for stabilization or entry planning.
---
### 📊 **Inputs & Settings**
| Parameter | Description |
| ---------------------------------- | ------------------------------------------------------------------------------ |
| **Bollinger Band Length** | The number of bars used for SMA and standard deviation (default 20). |
| **Bollinger Multiplier** | Determines the width of Bollinger Bands (default 2.0). |
| **Adaptive Lookback Period** | Rolling window to calculate the mean BBW for dynamic adjustment (default 150). |
| **Expansion Multiplier** | Multiplies the mean BBW to define the expansion threshold (default 1.35). |
| **Horizontal Line Extension Bars** | Number of bars to extend the Vishnu Zone line into the future (default 40). |
| **Show End-of-Brahma Labels?** | Toggle 🕉 labels on/off. |
| **Show Horizontal Lines?** | Toggle Vishnu Zone lines on/off. |
---
### 🔔 **Alerts**
When the **Brahma Phase ends**, the indicator triggers an alert:
> *“Brahma Phase Ends, Vishnu has taken over.”*
This helps traders receive real-time notification of volatility contraction and possible entry zones.
---
### 🧠 **Best Practices**
* Works effectively on **5-minute to 1-hour timeframes** for intraday trading.
* Best paired with **momentum or volume filters** to confirm trend exhaustion.
* Avoid entering during rapid expansion (Brahma phase). Wait for a Vishnu signal to ensure market stabilization.
---
### 🌌 **Philosophical Interpretation (SALSA© Principle)**
Just as Vishnu sustains the universe after Brahma’s creation, the market too enters a **maintenance phase** after every burst of expansion.
Recognizing this shift allows traders to align with **cosmic rhythm and price psychology**, not just technical metrics.
---
### 🧩 **Summary**
✅ Detects when expansion volatility ends
✅ Marks transition zones between impulsive and stable phases
✅ Sends real-time alerts
✅ Adaptive and self-adjusting across markets and assets
✅ Simple, clean visualization — ideal for disciplined trading
---
### ⚡ **Use Case**
Perfect for traders who:
* Prefer **low-risk entries** after volatility spikes
* Trade **mean reversion**, **range breakouts**, or **volatility collapses**
* Believe in the **cyclic nature of market energy**
---

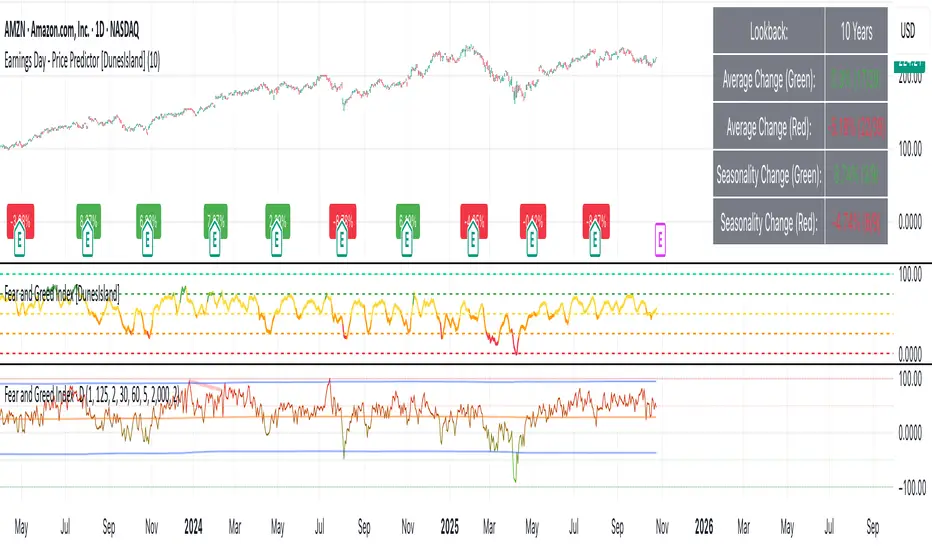
Earnings Day - Price Predictor [DunesIsland]It's designed to analyze and visualize historical stock price movements on earnings report days, focusing on percentage changes.
Here's a breakdown of what it does, step by step:
Key Inputs and Setup
User Input: There's a single input for "Lookback Years" (default: 10), which determines how far back in time (approximately) the indicator analyzes earnings data. It uses a rough calculation of milliseconds in that period to filter historical data.
Data Fetching: It uses TradingView's request.earnings function to pull actual earnings per share (EPS) data for the current ticker. Earnings days are identified where EPS data exists on a bar but not on the previous one (to avoid duplicates).
Price Change Calculation: For each detected earnings day, it computes the percentage price movement as (close - close ) / close * 100, representing the change from the previous close to the current close on that day.
Processing and Calculations (on the Last Bar)
Lookback Filter: It calculates a cutoff timestamp for the lookback period and processes only earnings events within that window.
Overall Averages:
Separates positive (≥0%) and negative (<0%) percentage changes.
Seasonality (Next Quarter Prediction):
Identifies the most recent earnings quarter (latest_q).
Predicts the "next" quarter (e.g., if latest is Q4, next is Q1;
Again, separates positive and negative changes, computing their respective averages.
Visual Outputs
Lookback: How far to fetch the data in years.
Average Change (Green): Showing the average of all positive changes.
Average Change (Red): Showing the average of all negative changes.
Seasonality Change (Green): Showing the average of positive changes for the predicted next quarter.
Seasonality Change (Red): Showing the average of negative changes for the predicted next quarter.
Purpose and Usage
This indicator helps traders assess a stock's historical reaction to earnings announcements. The overall averages give a broad sense of typical gains/losses, while the seasonality focuses on quarter-specific trends to "predict" potential movement for the upcoming earnings (based on past same-quarter performance). It's best used on daily charts for stocks with reliable earnings data. Note that quarter inference is calendar-based and may not perfectly match fiscal calendars for all companies—it's an approximation.
Trend Telescope v4 Basic Configuration
pine
// Enable only the components you need
Order Flow: ON
Delta Volume: ON
Volume Profile: ON
Cumulative Delta: ON
Volatility Indicator: ON
Momentum Direction: ON
Volatility Compression: ON
📊 Component Breakdown
1. Order Flow Analysis
Purpose: Identifies buying vs selling pressure
Visual: Histogram (Green=Buying, Red=Selling)
Calculation: Volume weighted by price position
Usage: Spot institutional order blocks
2. Delta Volume Values
Purpose: Shows volume imbalance
Bull Volume (Green): Volume on up bars
Bear Volume (Red): Volume on down bars
Usage: Identify volume divergences
3. Anchored Volume Profile
Purpose: Finds high-volume price levels
POC (Point of Control): Price with highest volume
Profile Length: Adjustable (default: 50 bars)
Usage: Identify support/resistance zones
4. Cumulative Volume Delta
Purpose: Tracks net buying/selling pressure over time
Trend Analysis: Rising=Buying pressure, Falling=Selling pressure
Divergence Detection: Price vs Delta divergences
Usage: Confirm trend strength
5. Volatility Indicator
Purpose: Measures market volatility with cycle detection
Volatility Ratio: ATR as percentage of price
Volatility Cycle: SMA of volatility (identifies periods)
Histogram: Difference between current and average volatility
Usage: Adjust position sizing, identify breakout setups
6. Real-time Momentum Direction
Purpose: Multi-factor momentum assessment
Components: Price momentum (50%), RSI momentum (30%), Volume momentum (20%)
Visual: Line plot with color coding
Labels: Clear BULLISH/BEARISH/NEUTRAL signals
Usage: Trend confirmation, reversal detection
7. Volatility Compression Analysis
Purpose: Identifies low-volatility consolidation periods
Compression Detection: True Range below threshold
Strength Meter: How compressed the market is
Histogram: Red when compressed, Gray when normal
Usage: Predict explosive moves, prepare for breakouts
⚙️ Advanced Configuration
Optimal Settings for Different Timeframes
pine
// Scalping (1-15 min)
Profile Length: 20
ATR Period: 10
Momentum Length: 8
Compression Threshold: 0.3
// Day Trading (1H-4H)
Profile Length: 50
ATR Period: 14
Momentum Length: 14
Compression Threshold: 0.5
// Swing Trading (Daily)
Profile Length: 100
ATR Period: 20
Momentum Length: 21
Compression Threshold: 0.7
Alert Setup Guide
Enable "Enable Alerts" in settings
Choose alert types:
Momentum Alerts: When momentum changes direction
Compression Alerts: When volatility compression begins
Set alert frequency to "Once Per Bar"
Configure notification preferences
🎯 Trading Strategies
Strategy 1: Compression Breakout
pine
Entry Conditions:
1. Volatility Compression shows RED histogram
2. Cumulative Delta trending upward
3. Momentum turns BULLISH
4. Price breaks above POC level
Exit: When Momentum turns BEARISH or Compression ends
Strategy 2: Momentum Reversal
pine
Entry Conditions:
1. Strong Order Flow in opposite direction
2. Momentum divergence (price makes new high/low but momentum doesn't)
3. Volume confirms the reversal
Exit: When Order Flow returns to trend direction
Strategy 3: Institutional Accumulation
pine
Identification:
1. High Cumulative Delta but flat/sideways price
2. Consistent Order Flow in one direction
3. Volume Profile shows accumulation at specific levels
Trade: Enter in direction of Order Flow when price breaks level
📈 Interpretation Guide
Bullish Signals
✅ Order Flow consistently green
✅ Cumulative Delta making higher highs
✅ Momentum above zero and rising
✅ Bull Volume > Bear Volume
✅ Price above POC level
Bearish Signals
✅ Order Flow consistently red
✅ Cumulative Delta making lower lows
✅ Momentum below zero and falling
✅ Bear Volume > Bull Volume
✅ Price below POC level
Caution Signals
⚠️ Momentum divergence (price vs indicator)
⚠️ Volatility compression (potential big move coming)
⚠️ Mixed signals across components
🔧 Troubleshooting
Common Issues & Solutions
Problem: Indicators not showing
Solution: Check "Show on Chart" is enabled
Problem: Alerts not triggering
Solution: Verify alert is enabled in both script and TradingView alert panel
Problem: Performance issues
Solution: Reduce number of enabled components or increase timeframe
Problem: Volume Profile not updating
Solution: Adjust Profile Length setting, ensure sufficient historical data
Performance Optimization
Disable unused components
Increase chart timeframe
Reduce historical bar count
Use on lower timeframes with fewer indicators enabled
💡 Pro Tips
Risk Management
Use Volatility Indicator for position sizing
Monitor Cumulative Delta for trend confirmation
Use POC levels for stop-loss placement
Multi-Timeframe Analysis
Use higher timeframe for trend direction
Use current timeframe for entry timing
Correlate signals across timeframes
Market Condition Adaptation
Trending Markets: Focus on Momentum + Order Flow
Ranging Markets: Focus on Volume Profile + Compression
High Volatility: Use smaller position sizes
Low Volatility: Prepare for compression breakouts
📚 Educational Resources
Key Concepts to Master
Volume-price relationships
Market microstructure
Institutional order flow
Volatility regimes
Momentum vs mean reversion
Recommended Learning Path
Start with Order Flow + Momentum only
Add Volume Profile once comfortable
Incorporate Volatility analysis
Master multi-component correlation
🆘 Support
Getting Help
Check component toggles are enabled
Verify sufficient historical data is loaded
Test on major pairs/indices first
Adjust settings for your trading style
Continuous Improvement
Backtest strategies thoroughly
Keep a trading journal
Adjust parameters based on market conditions
Combine with price action analysis
Remember: No indicator is perfect. Use this tool as part of a comprehensive trading plan with proper risk management. Always test strategies in demo accounts before live trading.
Happy Trading! 📈

Smooth Theil-SenI wanted to build a Theil-Sen estimator that could run on more than one bar and produce smoother output than the standard implementation. Theil-Sen regression is a non-parametric method that calculates the median slope between all pairs of points in your dataset, which makes it extremely robust to outliers. The problem is that median operations produce discrete jumps, especially when you're working with limited sample sizes. Every time the median shifts from one value to another, you get a step change in your regression line, which creates visual choppiness that can be distracting even though the underlying calculations are sound.
The solution I ended up going with was convolving a Gaussian kernel around the center of the sorted lists to get a more continuous median estimate. Instead of just picking the middle value or averaging the two middle values when you have an even sample size, the Gaussian kernel weights the values near the center more heavily and smoothly tapers off as you move away from the median position. This creates a weighted average that behaves like a median in terms of robustness but produces much smoother transitions as new data points arrive and the sorted list shifts.
There are variance tradeoffs with this approach since you're no longer using the pure median, but they're minimal in practice. The kernel weighting stays concentrated enough around the center that you retain most of the outlier resistance that makes Theil-Sen useful in the first place. What you gain is a regression line that updates smoothly instead of jumping discretely, which makes it easier to spot genuine trend changes versus just the statistical noise of median recalculation. The smoothness is particularly noticeable when you're running the estimator over longer lookback periods where the sorted list is large enough that small kernel adjustments have less impact on the overall center of mass.
The Gaussian kernel itself is a bell curve centered on the median position, with a standard deviation you can tune to control how much smoothing you want. Tighter kernels stay closer to the pure median behavior and give you more discrete steps. Wider kernels spread the weighting further from the center and produce smoother output at the cost of slightly reduced outlier resistance. The default settings strike a balance that keeps the estimator robust while removing most of the visual jitter.
Running Theil-Sen on multiple bars means calculating slopes between all pairs of points across your lookback window, sorting those slopes, and then applying the Gaussian kernel to find the weighted center of that sorted distribution. This is computationally more expensive than simple moving averages or even standard linear regression, but Pine Script handles it well enough for reasonable lookback lengths. The benefit is that you get a trend estimate that doesn't get thrown off by individual spikes or anomalies in your price data, which is valuable when working with noisy instruments or during volatile periods where traditional regression lines can swing wildly.
The implementation maintains sorted arrays for both the slope calculations and the final kernel weighting, which keeps everything organized and makes the Gaussian convolution straightforward. The kernel weights are precalculated based on the distance from the center position, then applied as multipliers to the sorted slope values before summing to get the final smoothed median slope. That slope gets combined with an intercept calculation to produce the regression line values you see plotted on the chart.
What this really demonstrates is that you can take classical statistical methods like Theil-Sen and adapt them with signal processing techniques like kernel convolution to get behavior that's more suited to real-time visualization. The pure mathematical definition of a median is discrete by nature, but financial charts benefit from smooth, continuous lines that make it easier to track changes over time. By introducing the Gaussian kernel weighting, you preserve the core robustness of the median-based approach while gaining the visual smoothness of methods that use weighted averages. Whether that smoothness is worth the minor variance tradeoff depends on your use case, but for most charting applications, the improved readability makes it a good compromise.


Constant Auto Trendlines (Extended Right)📈 Constant Auto Trendlines (Extended Right)
This indicator automatically detects market structure by connecting swing highs and lows with permanent, forward-projecting trendlines.
Unlike standard trendline tools that stop at the last pivot, this version extends each trendline infinitely into the future — helping traders visualize where price may react next.
🔍 How It Works
The script identifies pivot highs and lows using user-defined left/right bar counts.
When a new lower high or higher low appears, the indicator draws a line between the two pivots and extends it forward using extend.right.
Each new confirmed trendline stays fixed, creating a historical map of structure that evolves naturally with market action.
Optional filters:
Min Slope – ignore nearly flat trendlines
Show Latest Only – focus on the most relevant trendline
Alerts – get notified when price crosses the most recent uptrend or downtrend line
🧩 Why It’s Useful
This tool helps traders:
Spot emerging trends early
Identify dynamic support/resistance diagonals
Avoid redrawing trendlines manually
Backtest structure breaks historically
⚙️ Inputs
Pivot Left / Right bars
Min slope threshold
Line color, width, and style
Show only latest line toggle
Alert options

NWOG/NDOG + EHPDA🌐 ENGLISH DESCRIPTION
Hybrid NWOG/NDOG + EHPDA – Advanced Gaps & Event Horizon Indicator
(Enhanced with Real-Time Alerts and Info Table)
📊 Overview
This advanced indicator combines automatic detection of weekly gaps (NWOG) and daily gaps (NDOG) with the Event Horizon (EHPDA) concept, now featuring customizable alerts and a real-time info table for a more efficient trading experience. Designed for traders who operate based on institutional price structures, liquidity zones, and SMC/ICT confluences.
✨ Key Features
1. Gap Detection & Visualization
NWOG (New Week Opening Gap): Identifies and visualizes the gap between Friday’s close and Monday’s open.
NDOG (New Day Opening Gap): Detects daily gaps on intraday timeframes.
Enhanced visualization: Semi-transparent boxes, price levels (top, middle, bottom), and lines extended to the current bar.
Customizable labels: Display gap formation date and price levels (optional).
2. Event Horizon (EHPDA)
Automatically calculates the Event Horizon level between two non-overlapping gaps.
Dashed line marking the equilibrium zone between bullish and bearish gaps.
3. Advanced 5pm-6pm Mode
Special option to detect the Sunday-Monday gap using 4H bars.
4. Real-Time Alerts
New gaps (NWOG/NDOG): Immediate notification when a new gap forms.
Gap fill: Alert when price completely fills a gap.
Event Horizon active: Notification when the Event Horizon level is triggered.
5. Info Table
Real-time display: number of active gaps, Event Horizon status, time remaining until weekly/daily close.
Customizable: position, size, and style.
🎨 Customization
Configurable colors for bullish gaps, bearish gaps, and Event Horizon line.
Customizable price labels and date format.
📈 Use Cases
Reversal trading, price targets, liquidity zones, SMC/ICT confluences.
⚙️ Recommended Settings
Timeframes: Daily and intraday (15m, 1H, 4H, etc.).
NWOG: Enable on all timeframes.
NDOG: Enable only on intraday.
Max Gaps: 3-5 for clean charts, 10-15 for historical analysis.
📝 Important Notes
Works best on 24/5 markets (Forex, Crypto).
Gaps automatically close when filled.
Event Horizon only appears with at least 2 non-overlapping gaps.

VBE Pro - Advanced Volatility Bands with Zero Lag & PredictionVBE Pro: Zero-Lag Predictive Bands
A next-gen volatility envelope that blends zero-lag smoothing with forward-looking volatility models (EWMA/GARCH/HAR/ML) to keep bands tight in calm markets, responsive in shocks, and adaptive across regimes.
What it does
Builds volatility from multiple methods (ATR, StDev, Parkinson, Garman-Klass, Rogers-Satchell, Yang-Zhang).
Projects near-term vol with your choice of predictor, then blends it via a weight slider.
Applies zero-lag smoothing (ZLEMA/ZLMA/DEMA/TEMA/HMA/JMA/Ehlers/Kalman/T3) to cut delay without over-shoot.
Auto-adapts band width by regime (high/low/normal) and can expand dynamically with price acceleration.
Optional displacement to align with your execution style.
On-chart
Upper/Lower zero-lag bands with optional fill.
Middle line (ZL-smoothed source).
Regime-tinted background (High/Low).
Displacement marker (if used).
Compact top-right info table: current vs predicted vol, regime, squeeze, multiplier, methods, ZL gain, est. lag reduction.
Signals & Alerts
Break↑ / Break↓ when price crosses the bands.
Vol↑ / Vol↓ expansion/contraction sequences.
“Squeeze” when band width compresses vs its ZL average.
“ZL” marker when significant zero-lag is active.
Prediction divergence ⚠ when projected vol deviates > threshold.
Built-in alertconditions for all of the above.
Quick start
Method: ATR or Hybrid for robustness.
Smoothing: ZLEMA, length 5–8, ZL gain 2–3 (push higher only if you accept more projection).
Bands: Multiplier 2.0, Adaptive on, Dynamic off to start.
Prediction: EWMA, weight 0.25–0.35. Move to GARCH in mean-reverty tapes; HAR-RV for mixed regimes.
Regime lookback: 50.

PulseRPO Zero-Lag BandsPulseRPO is a momentum and volatility timing suite built on a zero-lag Relative Price Oscillator. It pairs an RPO (fast vs slow MA spread, in %) with adaptive volatility envelopes that tighten or widen as conditions change, so you can spot true momentum bursts, exhaustion and “quiet-before-the-move” squeezes—without the usual MA lag.
What it shows
Zero-Lag RPO: Choose EMA, SMA, WMA, RMA, HMA or ZLEMA for the base, then apply ZLEMA/DEMA/TEMA/HMA zero-lag smoothing to cut delay.
Adaptive Bands: StdDev, ATR, Range or Hybrid volatility; bands auto-tighten in high vol and widen in quiet regimes.
Dynamic OB/OS: Levels scale with current regime so extremes mean something even as volatility shifts.
Signal & Histogram: Classic signal cross plus histogram for quick read of acceleration vs deceleration.
Squeeze Paint: Subtle background highlight when band width compresses below its average.
Divergences & Triggers: Optional bullish/bearish divergence tags, plus band-cross and signal-cross alerts out of the box.
How to use it (general guide)
Momentum entries: Look for RPO crossing up its signal from below or snapping out of a squeeze; extra weight if it also re-enters from below the lower band.
Trend continuation: RPO riding outside the upper (or lower) band with rising histogram = power move; trail risk on pullbacks to the signal line.
Exhaustion / fades: Taps beyond dynamic OB/OS or band re-entries can mark mean-revert windows—confirm with price/volume.
Risk filter: During squeeze, size down and prepare for expansion; after expansion, respect extremes.
Tweak the MA type, band method and zero-lag strength to match your timeframe. PulseRPO is designed to be a self-contained read: regime → setup → trigger → alert.

MA Oscillator Map [ChartPrime]⯁ OVERVIEW
The MA Oscillator Map transforms moving average deviations into an oscillator framework that highlights overextended price conditions. By normalizing the difference between price and a chosen moving average, the tool maps oscillations between -100 and +100 , with gradient coloring to emphasize bullish and bearish momentum. When the oscillator cools from extreme levels (-100/100), the indicator marks potential reversal points and extends short-term levels from those extremes. A compact side table and dynamic bar coloring make momentum context visible at a glance.
⯁ KEY FEATURES
Oscillator Mapping (±100 Scale):
Price deviation from the selected MA is normalized into a percentage scale, allowing consistent overbought/oversold readings across assets and timeframes.
// MA
MA = ma(close, maLengthInput, maTypeInput)
diff = src - MA
maxVal = ta.highest(math.abs(diff), 50)
osc = diff / maxVal * 100
Customizable MA Types:
Choose SMA, EMA, SMMA, WMA, or VWMA to fine-tune the smoothing method that powers the oscillator.
Extreme Signal Diamonds:
When the oscillator retreats from +100 or -100, the script plots diamonds to flag potential exhaustion and reversal zones.
Dynamic Levels from Extremes:
Upper and lower dotted lines extend from recent overextension points, projecting temporary barriers until broken by price.
Gradient Bar Coloring:
Candles and oscillator values adopt a bullish-to-bearish gradient, making shifts in momentum instantly visible on the chart.
Compact Momentum Map:
A table at the chart’s edge plots the oscillator position with a gradient scale and live percentage label for precise momentum tracking.
⯁ USAGE
Watch for diamonds after the oscillator exits ±100 — these mark potential exhaustion zones.
Use extended dotted levels as short-term reference lines; if broken, trend continuation is favored.
Combine gradient bar coloring with oscillator shifts for confirmation of momentum reversals.
Experiment with different MA types to adapt sensitivity for trending vs. ranging markets.
Use the side momentum table as a quick-read gauge of trend strength in percent terms.
⯁ CONCLUSION
The MA Oscillator Map reframes moving average deviations into a visual momentum tracker with extremes, reversal signals, and dynamic levels. By blending oscillator math with intuitive visuals like gradient candles, diamonds, and a live gauge, it helps traders spot overextension, exhaustion, and momentum shifts across any market.

SuperBandsI've been seeing a lot of volatility band indicators pop up recently, and after watching this trend for a while, I figured it was time to throw my two chips in. The original spark for this idea came years ago from RicardoSantos's Vector Flow Channel script, which used decay channels with timed events in an interesting way. That concept stuck with me, and I kept thinking about how to build something that captured the same kind of dynamic envelope behavior but with a different mathematical foundation. What I ended up with is a hybrid that takes the core logic of supertrend trailing stops, smooths them heavily with exponential moving averages, and wraps them in Donchian-style filled bands with momentum-based color gradients.
The basic mechanism here is pretty straightforward. Standard supertrend calculates a trailing stop based on ATR offset from price, then flips direction when price crosses the trail. This implementation does the same thing but adds EMA smoothing to the trail calculation itself, which removes a lot of the choppiness you get from raw supertrend during sideways periods. The smoothing period is adjustable, so you can tune how reactive versus stable you want the bands to be. Lower smoothing values make the bands track price more aggressively, higher values create wider, slower-moving envelopes that only respond to sustained directional moves.
Where this diverges from typical supertrend implementations is in the visual presentation and the separate treatment of bullish and bearish conditions. Instead of a single flipping line, you get persistent upper and lower bands that each track their own trailing stops independently. The bullish band trails below price and stays active as long as price doesn't break below it. The bearish band trails above price and remains active until price breaks above. Both bands can be visible simultaneously, which gives you a dynamic channel that adapts to volatility on both sides of price action. When price is trending strongly, one band will dominate and the other will disappear. During consolidation, both bands tend to compress toward price.
The color gradients are calculated by measuring the rate of change in each band's position and converting that delta into an angle using arctangent scaling. Steeper angles, which correspond to the band moving quickly to catch up with accelerating price, get brighter colors. Flatter angles, where the band is moving slowly or staying relatively stable, fade toward more muted tones. This gives you a visual sense of momentum within the bands themselves, not just from price movement. A rapidly brightening band often precedes expansion or breakout conditions, while fading colors suggest the trend is losing steam or entering consolidation.
The filled regions between price and each band serve a similar function to Donchian channels or Keltner bands, creating clearly defined zones that represent normal price behavior relative to recent volatility. When price hugs one band and the fill area compresses, you're in a strong directional regime. When price bounces between both bands and the fills expand, you're in a ranging environment. The transparency gradients in the fills make it easier to see when price is near the edge of the envelope versus safely inside it.
Configuration is split between bullish and bearish settings, which lets you asymmetrically tune the indicator if you find that your market or timeframe has different characteristics in uptrends versus downtrends. You can adjust ATR period, ATR multiplier, and smoothing independently for each direction. This flexibility is useful for instruments that exhibit different volatility profiles during bull and bear phases, or for strategies that want tighter trailing on longs than shorts, or vice versa.
The ATR period controls the lookback window for volatility measurement. Shorter periods make the bands react quickly to recent volatility spikes, which can be beneficial in fast-moving markets but also leads to more frequent whipsaws. Longer periods smooth out volatility estimates and create more stable bands at the cost of slower adaptation. The multiplier scales the ATR offset, directly controlling how far the bands sit from price. Smaller multipliers keep the bands tight, triggering more frequent direction changes. Larger multipliers create wider envelopes that give price more room to move without breaking the trail.
One thing to note is that this indicator doesn't generate explicit buy or sell signals in the traditional sense. It's a regime filter and envelope tool. You can use band breaks as directional cues if you want, but the primary value comes from understanding the current volatility environment and whether price is respecting or violating its recent behavioral boundaries. Pairing this with momentum oscillators or volume analysis tends to work better than treating band breaks as standalone entries.
From an implementation perspective, the supertrend state machine tracks whether each direction's trail is active, handles resets when price breaks through, and manages the EMA smoothing on the trail points themselves rather than just post-processing the supertrend output. This means the smoothing is baked into the trailing logic, which creates a different response curve than if you just applied an EMA to a standard supertrend line. The angle calculations use RMS estimation for the delta normalization range, which adapts to changing volatility and keeps the color gradients responsive across different market conditions.
What this really demonstrates is that there are endless ways to combine basic technical concepts into something that feels fresh without reinventing mathematics. ATR offsets, trailing stops, EMA smoothing, and Donchian fills are all standard building blocks, but arranging them in a particular way produces behavior that's distinct from each component alone. Whether this particular arrangement works better than other volatility band systems depends entirely on your market, timeframe, and what you're trying to accomplish. For me, it scratched the itch I had from seeing Vector Flow years ago and wanting to build something in that same conceptual space using tools I'm more comfortable with.

Bitgak [Osprey]🟠 INTRODUCTION
Bitgak , translated as "Oblique Angle" in Korean, is a strategy used by multi-hundred-million traders in Korea, sometimes more heavily than Fibonacci retracement.
It is a concept that by connecting two or more pivot points on the chart and creating equidistant parallel lines, we can spot other pivot points. As seen in the example, a line at a different height but with the same angle spots many pivot points.
This indicator spots pivot points on the chart and tests all different possible Bitgak lines with a brute-force method. Then it shows the parallel line configuration with the most pivots hitting it. You may use the lines drawn on the chart as possible reversal points.
It is best to use on Day and Week candles . In the very short range of time, the noise makes it hard to capture meaningful data.
🟠 HOW TO USE
The orange dots are the major pivot points (you can set the period of the long-term pivot) upon which the lines are built.
Change the "Manual Lookback Bars" from 300 to a meaningful period upon your inspection.
"Hit Tolerance %" means how close a pivot needs to be to the line to be considered as having touched the line.
If the line is too narrow, which is not very useful, you may consider increasing the "Long-term Pivot Bars" and experimenting with different settings for Channel Lines and Heuristics.
The result:
"Top Anchors to Test (L)" is how many L highest peaks and L lowest troughs should be weighed heavily when testing the lines. That is, with L = 1, the algorithm will reward the Bitgak lines that touch 1 highest peak and 1 lowest trough. It doesn't make much intuitive sense, so I suggest just testing it out.
🟠 HOW IT WORKS
Step 1: Pivot Detection
The indicator runs two parallel detection systems:
Short-term pivots (default: 7 bars on each side) - Captures minor swing highs/lows for detailed analysis
Long-term pivots (default: 17 bars on each side) - Identifies major structural turning points
These pivots form the foundation for all channel calculations.
Step 2: Anchor Point Selection
From the detected long-term pivots, the algorithm identifies:
The L highest peaks (default L=1, meaning the single highest peak)
The L lowest troughs (default L=1, meaning the single lowest trough)
These become potential "anchor points" for channel construction. Higher L values test more combinations but increase computation time.
Step 3: Channel Candidate Generation
For support channels: Every pair of troughs becomes a potential base line (A-B)
For resistance channels: Every pair of peaks becomes a potential base line (A-B)
The algorithm then tests each peak (for support) or trough (for resistance) as pivot C.
Step 4: Optimal Spacing Calculation
For each A-B-C combination, the algorithm calculates:
Unit Spacing = (Distance from C to A-B line) / Multiplier
It tests multipliers from 0.5 to 4.0 (or your custom range), asking: "If pivot C sits on the 1.0 line, what spacing makes the most pivots hit other lines?"
Step 5: Scoring & Selection
Each configuration is scored by counting how many pivots fall within tolerance (default 1% of price) of any parallel line in the range . The highest-scoring channel is drawn on your chart.

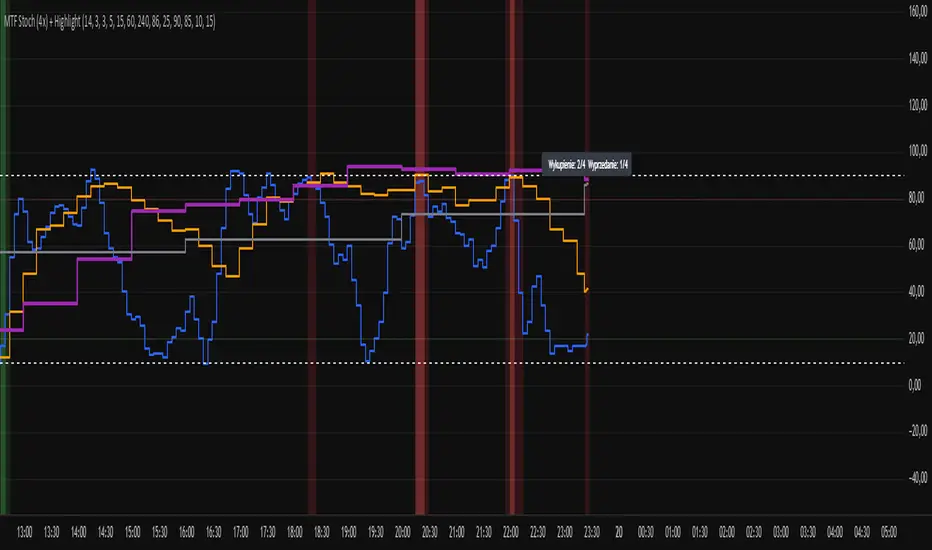
Multi-Timeframe Stochastic (4x) z PodświetlaniemStochastic z możliwością paru tfów gdzie jak są w danej strefie to podświetla
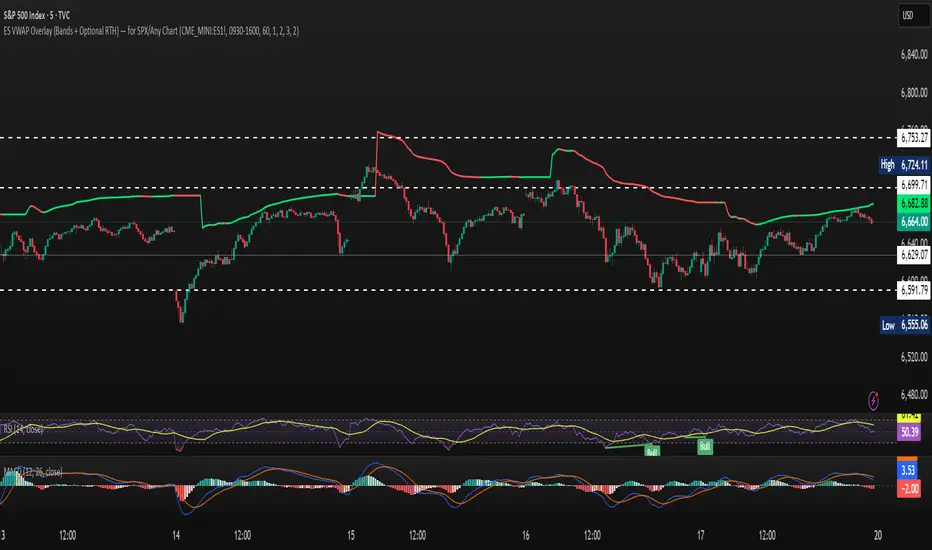
ES VWAP Overlay for SPX VWAP indicator for SPX. Since SPX does not have volume (index) it's using /es to mimic SPX volume. I find it good for day trading
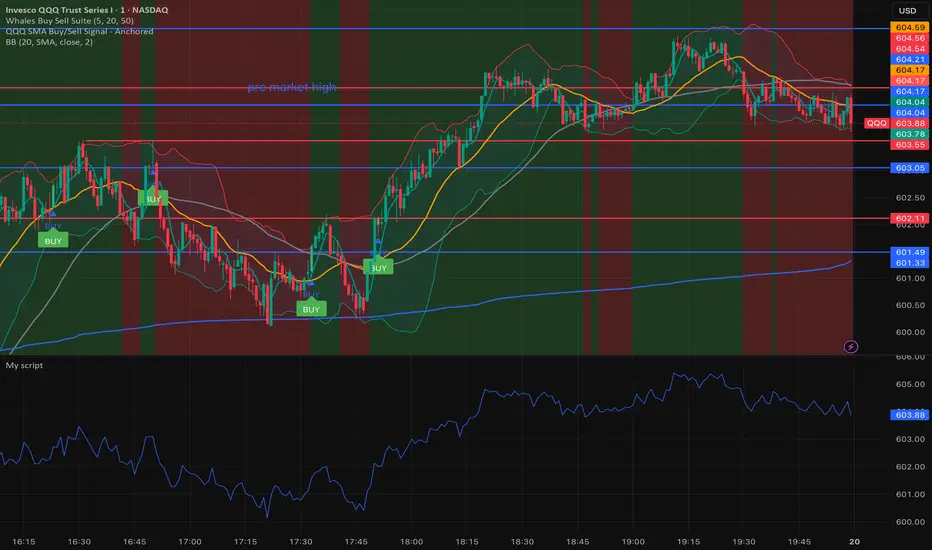
Whales buy & sell🐋 Whales on Wall Street — Buy & Sell Signal Indicator
The Whales on Wall Street Signal Indicator is a precision-built trading tool designed to simplify your decision-making and give you real-time clarity in the market.
It automatically identifies high-probability reversal zones, momentum shifts, and trend confirmations — marking exact Buy (green) and Sell (red) signals based on price action, volume confirmation, and momentum strength.
Built for day traders and scalpers, this indicator eliminates the guesswork by combining multiple technical confluences such as:
EMA & RSI alignment for trend direction
Smart volume spikes for institutional activity
Volatility filters to reduce false signals
Dynamic alerts for entries and exits in real time
Whether you’re trading SPY, QQQ, NVDA, or Tesla, this indicator adapts to any ticker and timeframe — giving you crystal-clear entries, cleaner exits, and the confidence to trade like a whale.
2 Bandas de Bollinguer (10-20) + 4 EMA + 2 SMA 2 BB (10-20) + 4 EMA (35-50-100-200) + 2 SMA (75-100) configurable

多周期趋势动量面板(Multi-Timeframe Trend Momentum Panel - User Guide)多周期趋势动量面板(Multi-Timeframe Trend Momentum Panel - User Guide)(english explanation follows.)
📖 指标功能详解 (精简版):
🎯 核心功能:
1. 多周期趋势分析 同时监控8个时间周期(1m/5m/15m/1H/4H/D/W/M)
2. 4维度投票系统 MA趋势+RSI动量+MACD+布林带综合判断
3. 全球交易时段 可视化亚洲/伦敦/纽约交易时间
4. 趋势强度评分 0100%量化市场力量
5. 智能警报 强势多空信号自动推送
________________________________________
📚 重要名词解释:
🔵 趋势状态 (MA均线分析):
名词 含义 信号强度
强势多头 快MA远高于慢MA(差值≥0.35%) ⭐⭐⭐⭐⭐ 做多
多头倾向 快MA略高于慢MA(差值<0.35%) ⭐⭐⭐ 谨慎做多
震荡 快慢MA缠绕,无明确方向 ⚠️ 观望
空头倾向 快MA略低于慢MA ⭐⭐⭐ 谨慎做空
强势空头 快MA远低于慢MA ⭐⭐⭐⭐⭐ 做空
简单理解: 快MA就像短跑运动员(反应快),慢MA是长跑运动员(稳定)。短跑远超长跑=强势多头,反之=强势空头。
________________________________________
🟠 动量状态 (RSI力度分析):
名词 含义 操作建议
动量上攻↗ RSI>60且快速上升 强烈买入信号
动量高位 RSI>60但上升变慢 警惕回调,可减仓
动量中性 RSI在4060之间,平稳 等待方向明确
动量低位 RSI<40但下跌变慢 警惕反弹,可止盈
动量下压↘ RSI<40且快速下降 强烈卖出信号
简单理解: RSI就像汽车速度表。"动量上攻"=油门踩到底加速,"动量高位"=已经很快但不再加速了。
________________________________________
🟣 辅助信号:
MACD:
• MACD多头 = 柱状图>0 = 买方力量强
• MACD空头 = 柱状图<0 = 卖方力量强
布林带(BB):
• BB超买 = 价格在布林带上轨附近 = 可能回调
• BB超卖 = 价格在布林带下轨附近 = 可能反弹
• BB中轨 = 价格在中间位置 = 平衡状态
________________________________________
💡 快速上手 3步看懂面板:
第1步: 看"综合结论标签" (K线上方)
• 绿色"多头占优" → 可以做多
• 红色"空头占优" → 可以做空
• 橙色"震荡/均衡" → 观望
第2步: 看"票数 多/空" (面板最下方)
• 多头票数远大于空头 (差距>2) → 趋势强
• 票数接近 (差距<1) → 震荡市
第3步: 看"趋势强度" (综合标签中)
• 强度>70% → 强势趋势,可重仓
• 强度5070% → 中等趋势,正常仓位
• 强度<50% → 弱势,轻仓或观望
________________________________________
🎨 时段背景色含义:
• 紫色背景 = 亚洲时段 (东京交易时间) 波动较小
• 橙色背景 = 伦敦时段 (欧洲交易时间) 波动增大
• 蓝色背景 = 纽约凌晨 美盘准备阶段
• 红色背景 = 纽约关键5分钟 (09:3009:35) ⚠️ 最重要! 市场最活跃,趋势易形成
• 绿色背景 = 纽约上午后段 延续早盘趋势
交易建议: 重点关注红色关键时段,这5分钟往往决定全天方向!
________________________________________
⚙️ 三大市场推荐设置
🥇 黄金: Hull MA 12/EMA 34, 阈值0.250.35%
₿ 比特币: EMA 21/EMA 55, 阈值0.801.20%
💎 以太坊: TEMA 21/EMA 55, 阈值0.600.80%
参数优化建议
黄金 (XAUUSD)
快速MA: Hull MA 12 (超灵敏捕捉黄金快速波动)
慢速MA: EMA 34 (斐波那契数列)
RSI周期: 9 (加快反应)
强趋势阈值: 0.25%
周期: 5, 15, 60, 240, 1440
比特币 (BTCUSD)
快速MA: EMA 21
慢速MA: EMA 55
RSI周期: 14
强趋势阈值: 0.8% (波动大,阈值需提高)
周期: 15, 60, 240, D, W
外汇 EUR/USD
快速MA: TEMA 10 (快速响应)
慢速MA: T3 30, 因子0.7 (平滑噪音)
RSI周期: 14
强趋势阈值: 0.08% (外汇波动小)
周期: 5, 15, 60, 240, 1440
📖 Indicator Function Details (Concise Version):
🎯 Core Functions:
1. MultiTimeframe Trend Analysis Monitors 8 timeframes simultaneously (1m/5m/15m/1H/4H/D/W/M)
2. 4Dimensional Voting System Comprehensive judgment based on MA trend + RSI momentum + MACD + Bollinger Bands
3. Global Trading Sessions Visualizes Asia/London/New York trading hours
4. Trend Strength Score Quantifies market strength from 0100%
5. Smart Alerts Automatically pushes strong bullish/bearish signals
📚 Key Term Explanations:
🔵 Trend Status (MA Analysis):
| Term | Meaning | Signal Strength |
| | | |
| Strong Bull | Fast MA significantly > Slow MA (Diff ≥0.35%) | ⭐⭐⭐⭐⭐ Long |
| Bullish Bias | Fast MA slightly > Slow MA (Diff <0.35%) | ⭐⭐⭐ Caution Long |
| Ranging | MAs intertwined, no clear direction | ⚠️ Wait & See |
| Bearish Bias | Fast MA slightly < Slow MA | ⭐⭐⭐ Caution Short |
| Strong Bear | Fast MA significantly < Slow MA | ⭐⭐⭐⭐⭐ Short |
Simple Understanding: Fast MA = sprinter (fast reaction), Slow MA = longdistance runner (stable). Sprinter far ahead = Strong Bull, opposite = Strong Bear.
🟠 Momentum Status (RSI Analysis):
| Term | Meaning | Trading Suggestion |
| | | |
| Momentum Up ↗ | RSI >60 & rising rapidly | Strong Buy Signal |
| Momentum High | RSI >60 but rising slower | Watch for pullback, consider reducing position |
| Momentum Neutral | RSI between 4060, stable | Wait for clearer direction |
| Momentum Low | RSI <40 but falling slower | Watch for rebound, consider taking profit |
| Momentum Down ↘ | RSI <40 & falling rapidly | Strong Sell Signal |
Simple Understanding: RSI = car speedometer. "Momentum Up" = full throttle acceleration, "Momentum High" = already fast but not accelerating further.
🟣 Auxiliary Signals:
MACD:
MACD Bullish = Histogram >0 = Strong buyer power
MACD Bearish = Histogram <0 = Strong seller power
Bollinger Bands (BB):
BB Overbought = Price near upper band = Possible pullback
BB Oversold = Price near lower band = Possible rebound
BB Middle = Price near middle band = Balanced state
💡 Quick Start 3 Steps to Understand the Panel:
Step 1: Check "Composite Conclusion Label" (Above the chart)
Green "Bulls Favored" → Consider Long
Red "Bears Favored" → Consider Short
Orange "Ranging/Balanced" → Wait & See
Step 2: Check "Votes Bull/Bear" (Bottom of the panel)
Bull votes significantly > Bear votes (Difference >2) → Strong Trend
Votes close (Difference <1) → Ranging Market
Step 3: Check "Trend Strength" (In the composite label)
Strength >70% → Strong Trend, consider heavier position
Strength 5070% → Moderate Trend, normal position size
Strength <50% → Weak Trend, light position or wait & see
🎨 Trading Session Background Color Meanings:
Purple = Asian Session (Tokyo hours) Lower volatility
Orange = London Session (European hours) Increased volatility
Blue = NY Early Morning US session preparation phase
Red = NY Critical 5 Minutes (09:3009:35) ⚠️ Most Important! Market most active, trends easily form
Green = NY Late Morning Continuation of early session trend
Trading Tip: Focus on the red critical period; these 5 minutes often determine the day's direction!
⚙️ Recommended Settings for Three Major Markets
🥇 Gold (XAUUSD):
Fast MA: Hull MA 12 (Highly sensitive for gold's fast moves)
Slow MA: EMA 34 (Fibonacci number)
RSI Period: 9 (Faster reaction)
Strong Trend Threshold: 0.25%
Timeframes: 5, 15, 60, 240, 1440
₿ Bitcoin (BTCUSD):
Fast MA: EMA 21
Slow MA: EMA 55
RSI Period: 14
Strong Trend Threshold: 0.8% (High volatility, requires higher threshold)
Timeframes: 15, 60, 240, D, W
💎 Ethereum (ETHUSD):
Fast MA: TEMA 21
Slow MA: EMA 55
RSI Period: 14
Strong Trend Threshold: 0.600.80%
Timeframes: 15, 60, 240, D, W
💱 Forex EUR/USD:
Fast MA: TEMA 10 (Fast response)
Slow MA: T3 30, Factor 0.7 (Smooths noise)
RSI Period: 14
Strong Trend Threshold: 0.08% (Forex has low volatility)
Timeframes: 5, 15, 60, 240, 1440

G_GMMA• Comprehensive GMMA Visualization: It plots six fast EMAs and six slow EMAs, clearly distinguishing short term and long term trends. The indicator fills the space between the fastest and slowest EMAs in each group, turning the moving averages into easily identifiable ribbons rather than a mass of overlapping lines.
• Customizable Appearance: Users can adjust the colors of the fast and slow EMA lines, the fill colors of each ribbon, and the overall line thickness. This makes it easy to tailor the chart to personal preferences or trading templates.
• Dynamic Background Shading: The script can shade the chart’s background depending on whether the fast ribbon is above or below the slow ribbon, giving a quick visual cue for trend direction (uptrend vs. downtrend).
• Touch Alert System: Up to three different EMA lengths can be monitored for “touch” events. When price touches a selected EMA (e.g., 20 , 50 or 200 period EMA), the indicator triggers an alert condition and plots a small circle on the chart at the contact point. This helps traders catch precise entry or exit signals without staring at the screen.
• Flexible Input: Both fast and slow EMA lengths, colors, and alert parameters are user adjustable from the indicator’s settings. This allows the same script to be used on different instruments (e.g., Gold, forex pairs) and time frames by simply changing the period values.
• Trend Sensitive Support/Resistance: By treating the slow EMA ribbon as a dynamic support/resistance zone, the indicator helps traders identify where price is likely to stall or reverse. Combining this with the touch alerts makes it well suited for scalping or intraday trades.

Buy/Sell Signals [WynTrader]My name is WynTrader. I cumulate 24 years of experience.
This Indicator produces Buy/Sell Signals using these features:
- Fast and Slow Moving averages (modifiable) optimized at EMA-8 and SMA-35
- Bollinger Bands (modifiable) optimized at Basis-18 and Multiplier-1
Also, the Buy/Sell Signals are conditioned by three Filters (optionable, modifiable) :
. Bollinger-Bands Lookback
. High-Low vs Candle Range %
. Distance from Fast and Slow Moving averages %
The Results Calculation presented in a Table are based :
- on the Current Chart Visible Range (optionable)
or
- on the specified TIme Frame Start and End Dates (modifiable)
The Table shows Calculation Results of the Buy and Sell Signals that are activated on the chart, with the Number of Trades (Signals), the Winning Points and the Win Rate %. The Buy&Hold starts calculation at the first Buy encountered.
So be surprised by my Buy/Sell Indicator. But always remember that the world is not perfect. The Graal Indicator, even with AI, doesn't already exist, maybe one day (all of us richier...), but not now. , depending on the chart product (stocks...), volatility, probabilities, unpredictable behaviour. , the moves, etc.
Enjoy
WynTrader
P. s. :
My name is WynTrader. I cumulate 24 years of experience. In 2001, I took an intensive technical analysis course taught by an exceptional friend, Cyril, who taught me everything I know. The foundation I gained through his teaching remains solid and relevant to this day, never failing me.
Before i made this Indicator, I have used many Trading View Buy/Sell Indicators using alone or combined RSI, SMI, OBV, MACD ATR, ADX, Neural, Fractal, Geometry, etc., that are already available for the Trading View community. A great thanks to those who give their time that help me build this tool.
Note that I'm not a programmer, so... ;-)