Volatility Monitor [HTF/LTF Maki]The way to set a buying and selling rule base on EMA in Multi Time Frame
النطاقات والقنوات

HUll Dynamic BandEducational Hull Moving Average Wave Analysis Tool
**MARS** is an innovative educational indicator that combines multiple Hull Moving Average timeframes to create a comprehensive wave analysis system, similar in concept to Ichimoku Cloud but with enhanced smoothness and responsiveness.
---
🎯 Key Features
**Triple Wave System**
- **Peak Wave (34-period)**: Fast momentum signals, similar to Ichimoku's Conversion Line
- **Primary Wave (89-period)**: Main trend identification with retest detection
- **Swell Wave (178-period)**: Long-term trend context and major wave analysis
**Visual Wave Analysis**
- **Wave Power Fill**: Dynamic area between primary and swell waves showing trend strength
- **Peak Power Fill**: Short-term momentum visualization
- **Smooth Curves**: Hull MA-based calculations provide cleaner signals than traditional moving averages
**Intelligent Signal System**
- **Trend Shift Signals**: Clear visual markers when trend changes occur
- **Retest Detection**: Identifies potential retest opportunities with specific conditions
- **Correction Alerts**: Early warning signals for market corrections
---
📊 How It Works
The indicator uses **Hull Moving Averages** with **Fibonacci-based periods** (34, 89, 178) and a **Golden Ratio multiplier (1.64)** to create natural market rhythm analysis.
**Key Signal Types:**
- 🔵 **Circles**: Major trend shifts (primary wave crossovers)
- 💎 **Diamonds**: Retest opportunities with multi-wave confirmation
- ❌ **X-marks**: Correction signals and structural breaks
- 🌊 **Wave Fills**: Visual trend strength and direction
---
🎓 Educational Purpose
This indicator demonstrates:
- Advanced moving average techniques using Hull MA
- Multi-timeframe analysis in a single view
- Wave theory application in technical analysis
- Dynamic support/resistance concept visualization
**Similar to Ichimoku but Different:**
- Ichimoku uses price-based calculations → Angular cloud shapes
- MARS uses weighted averages → Smooth, flowing wave patterns
- Both identify trend direction, but MARS offers faster signals with cleaner visualization
---
⚙️ Customizable Settings
- **Wave Periods**: Adjust primary wave length (default: 89)
- **Multipliers**: Fine-tune wave sensitivity (default: 1.64 Golden Ratio)
- **Visual Style**: Customize line widths and signal displays
- **Peak Analysis**: Independent fast signal system (default: 34)
---
🔍 Usage Tips
1. **Trend Identification**: Watch wave fill colors and line positions
2. **Entry Timing**: Look for retest diamonds after trend shift circles
3. **Risk Management**: Use wave boundaries as dynamic support/resistance
4. **Confirmation**: Combine with price action and market structure analysis
---
⚠️ Important Notes
- **Educational Tool**: Designed for learning wave analysis concepts
- **Not Financial Advice**: Always use proper risk management
- **Backtesting Recommended**: Test on historical data before live trading
- **Combine with Analysis**: Works best with additional confirmation methods
---
🚀 Innovation
MARS represents a unique approach to wave analysis by:
- Combining Hull MA smoothness with Ichimoku-style visualization
- Providing multi-timeframe analysis without chart clutter
- Offering retest detection with specific wave conditions
- Creating an educational bridge between different analytical methods
---
*This indicator is shared for educational purposes to help traders understand advanced moving average techniques and wave analysis concepts. Always practice proper risk management and combine with your own analysis.*

Premarket Hi/Lo + Prior Day O/C LevelsPremarket Hi/Lo + Prior Day O/C (today only) shows four clear reference levels for the current regular trading session: the Premarket High and Premarket Low (taken from a user-defined premarket window, 04:00–09:30 by default) and Yesterday’s 09:30 Open and 15:59 Close (sourced from the 1-minute feed for accuracy). The premarket levels “lock” at the opening bell so they don’t move for the rest of the day. All four lines are displayed only during today’s regular hours to keep the chart focused. Small right-edge labels and an optional top-right mini-table show the exact values at a glance.
This indicator is designed to give immediate context without technical jargon. The premarket high/low summarize where price traveled before the bell; the prior-day open/close summarize where the last session began and ended. Checking whether price is above or below these markers helps you quickly judge strength or weakness and anticipate where price may pause, bounce, or break. Typical uses include watching for a clean break and hold above Premarket High (often bullish), a break and hold below Premarket Low (often bearish), drift back toward Prior Day Close after a gap (a common “magnet”), and flips around Prior Day Open that can lead to continuation.
Setup: Turn on Extended Hours in TradingView so premarket bars are visible (Chart Settings → Symbol → Extended Hours). Apply the indicator to any intraday timeframe. In Inputs, you can change the premarket window to match your market, adjust colors and line widths, and toggle the floating labels and the mini-table. Times use the chart’s exchange time (for US stocks, Eastern Time).
Notes and limits: Lines show only for today’s session (default 09:30–16:00). The script looks at the previous calendar day for “prior day,” so values may be empty after weekends or holidays when markets were closed. If your instrument uses different regular hours or you trade futures/crypto, adjust the premarket session in Inputs and—if needed—edit the regular-hours window in code to match. If your data source does not include premarket, the premarket lines will be blank.
Best practice: The first 15–30 minutes after the open are where these levels have the most impact. Reactions are more meaningful when a line aligns with another tool you use (e.g., VWAP or your opening range). If price does not react clearly at a line, avoid forcing a trade.

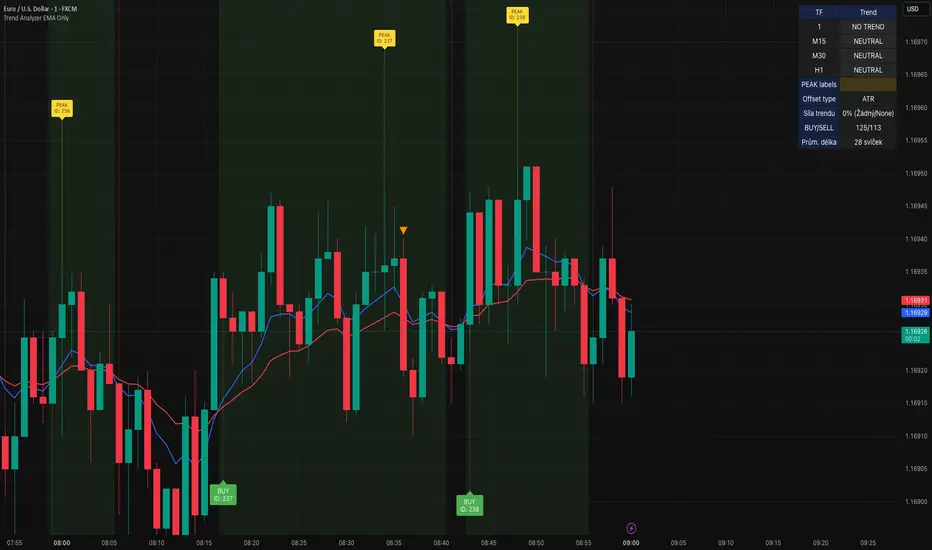
Trend Analyzer v0.6Trend Analyzer EMA Only v0.6
Simple yet powerful EMA trend analysis with multi-timeframe support!
Overview:
This comprehensive indicator focuses on EMA-based trend analysis with clean visual presentation. It provides clear BUY/SELL signals, trend tracking with unique IDs, peak detection, and multi-timeframe analysis across M15, M30, and H1 timeframes.
Key Features:
✅ EMA Trend Analysis - Fast and Slow EMA crossover signals
✅ Trend Tracking - Unique trend IDs with start/end markers
✅ Peak Detection - Automatic peak identification during trends
✅ Multi-Timeframe - Analysis across M15, M30, and H1 timeframes
✅ Visual Clarity - Dotted lines connecting labels to candles
✅ Statistics - BUY/SELL count and average trend length
How It Works:
The indicator calculates signal strength using weighted analysis:
• MACD (50%) - Primary trend momentum
• RSI (30%) - Overbought/oversold conditions
• Volume (20%) - Volume confirmation
Signal Logic:
• BUY - Fast EMA crosses above Slow EMA + both slopes positive
• SELL - Fast EMA crosses below Slow EMA + both slopes negative
• NEUTRAL - EMAs too close (below threshold)
Visual Elements:
• 🟢 BUY - Green label with trend ID
• 🔴 SELL - Red label with trend ID
• ⚪ NEUTRAL - Gray label with trend ID
• 🟡 PEAK - Yellow label marking trend extremes
• ⚫ END - Gray label marking trend end
Information Table:
Real-time display showing:
• Current Timeframe trend state
• Multi-Timeframe analysis (M15, M30, H1)
• PEAK Labels status
• Offset Type configuration
• Trend Strength percentage
• Statistics (BUY/SELL count, average trend length)
Settings:
• Fast EMA Length - 9 (default)
• Slow EMA Length - 21 (default)
• Min Trend Bars - 3 (filters short trends)
• Label Offset Type - ATR, % of price, or Dynamic
• Show PEAK Labels - On/Off toggle
Best Practices:
🎯 Works best in trending markets
📊 Use as overlay on main chart
⚡ Combine with price action analysis
🛡️ Always use proper risk management
Pro Tips:
• Green background = Strong uptrend, Red background = Strong downtrend
• Watch for trend change arrows for early reversal signals
• Use the information table for quick market assessment
• Monitor trend statistics for market behavior insights
Alerts:
• BUY Alert - "BUY signal detected"
• SELL Alert - "SELL signal detected"
Version 0.6 Improvements:
• Optimized performance
• Enhanced visual clarity
• Improved multi-timeframe analysis
• Refined trend detection algorithms
Created with ❤️ for the trading community
This indicator is free to use for both commercial and non-commercial purposes.
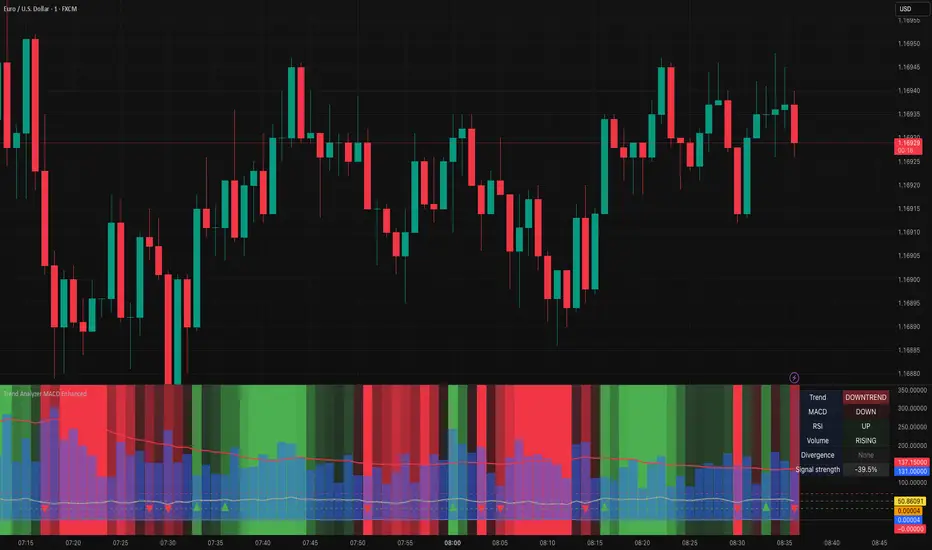
Trend Analyzer MACD EnhancedTrend Analyzer MACD Enhanced
Advanced trend analysis with MACD, RSI, Volume and Divergence detection!
Overview
This comprehensive indicator combines multiple technical analysis tools into one powerful visualization. It features dynamic background coloring, real-time signal strength calculation, and automatic divergence detection for complete market analysis.
Key Features
✅ Multi-Indicator Analysis- MACD, RSI, and Volume in one indicator
✅ Divergence Detection - Automatic bullish and bearish divergence identification
✅ Dynamic Background - Color-coded trend zones with smooth transitions
✅ Signal Strength - Weighted calculation showing overall market sentiment (0-100%)
✅ Trend Change Detection - Visual markers for trend reversals
✅ Information Table - Real-time status of all indicators
How It Works
The indicator calculates signal strength using weighted analysis:
- MACD (50%) - Primary trend momentum
- RSI (30%) - Overbought/oversold conditions
- Volume (20%) - Volume confirmation
Signal Strength Range: -100% to +100%
Visual Elements
Background Colors:
- 🟢 **Green** - Uptrend (intensity based on signal strength)
- 🔴 **Red** - Downtrend (intensity based on signal strength)
- ⚪ **Gray** - Neutral/sideways market
Trend Markers:
- 🔺 **Green Triangle Up** - Start of new uptrend
- 🔻 **Red Triangle Down** - Start of new downtrend
- 📏 **Vertical Lines** - Trend change confirmation
Information Table
Real-time display showing:
- Trend - Current trend state with color coding
- MACD - Direction and crossover status
- RSI - Level and overbought/oversold status
- Volume - Level and trend direction
- Divergence - Current divergence status
- Signal Strength - Overall percentage
Alerts
Built-in alerts for:
- Strong Buy/Sell Signals - High probability setups
- Divergence Signals - Early reversal warnings
Settings
MACD:Fast (12), Slow (26), Signal (9)
RSI:Length (14), Overbought (70), Oversold (30)
Volume:MA Length (20), Threshold (1.5x)
Display:Toggle RSI, Volume, and Table visibility
Best Practices
🎯 Works best in trending markets
📊 Use in separate window below main chart
⚡ Combine with price action analysis
🛡️ Always use proper risk management
Pro Tips
- Green background = Strong uptrend, Red background = Strong downtrend
- Signal strength > 50% = Very bullish, < -50% = Very bearish
- Watch for divergence signals for early reversal warnings
- Use the information table for quick market assessment
---
Created with ❤️ for the trading community
This indicator is free to use for both commercial and non-commercial purposes.
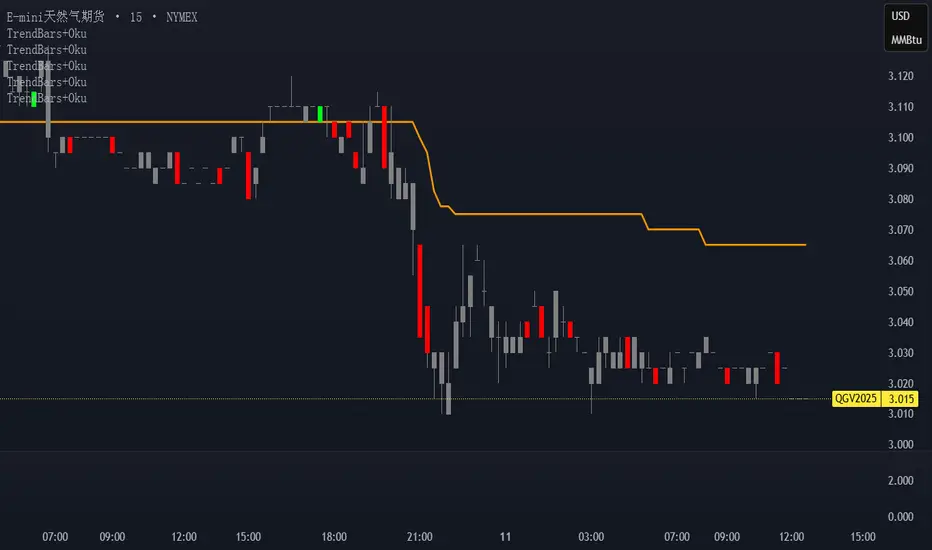
Trend Bars with Okuninushi Line Filter# Trend Bars with Okuninushi Line Filter: A Powerful Trading Indicator
## Introduction
The **Trend Bars with Okuninushi Line Filter** is an innovative technical indicator that combines two powerful concepts: trend bar analysis and the Okuninushi Line filter. This indicator helps traders identify high-quality trending moves by analyzing candle body strength relative to the overall price range while ensuring the price action aligns with the dominant market structure.
## What Are Trend Bars?
Trend bars are candles where the body (distance between open and close) represents a significant portion of the total price range (high to low). These bars indicate strong directional momentum with minimal indecision, making them valuable signals for trend continuation.
### Key Characteristics:
- **Strong directional movement**: Large body relative to total range
- **Minimal upper/lower shadows**: Shows sustained pressure in one direction
- **High conviction**: Represents decisive market action
## The Okuninushi Line Filter
The Okuninushi Line, also known as the Kijun Line in Ichimoku analysis, is calculated as the midpoint of the highest high and lowest low over a specified period (default: 52 periods).
**Formula**: `(Highest High + Lowest Low) / 2`
This line acts as a dynamic support/resistance level and trend filter, helping to:
- Identify the overall market bias
- Filter out counter-trend signals
- Provide confluence for trade entries
## How the Indicator Works
The indicator combines these two concepts with the following logic:
### Bull Trend Bars (Green)
A candle is colored **green** when ALL conditions are met:
1. **Bullish candle**: Close > Open
2. **Strong body**: |Close - Open| ≥ Threshold × (High - Low)
3. **Above trend filter**: Close > Okuninushi Line
### Bear Trend Bars (Red)
A candle is colored **red** when ALL conditions are met:
1. **Bearish candle**: Close < Open
2. **Strong body**: |Close - Open| ≥ Threshold × (High - Low)
3. **Below trend filter**: Close < Okuninushi Line
### Neutral Bars (Gray)
All other candles that don't meet the complete criteria are colored **gray**.
## Customizable Parameters
### Trend Bar Threshold
- **Range**: 10% to 100%
- **Default**: 75%
- **Purpose**: Controls how "strong" a candle must be to qualify as a trend bar
**Threshold Effects:**
- **Low (10-30%)**: More sensitive, catches smaller trending moves
- **Medium (50-75%)**: Balanced approach, filters out most noise
- **High (80-100%)**: Very selective, only captures the strongest moves
### Okuninushi Line Length
- **Default**: 52 periods
- **Purpose**: Determines the lookback period for calculating the midpoint
- **Common Settings**:
- 26 periods: More responsive to recent price action
- 52 periods: Standard setting, good balance
- 104 periods: Longer-term trend perspective
## Trading Applications
### 1. Trend Continuation Signals
- **Green bars**: Look for bullish continuation opportunities
- **Red bars**: Consider bearish continuation setups
- **Gray bars**: Exercise caution, mixed signals
### 2. Market Structure Analysis
- Clusters of same-colored bars indicate strong trends
- Alternating colors suggest choppy, indecisive markets
- Transition from red to green (or vice versa) may signal trend changes
### 3. Entry Timing
- Use colored bars as confirmation for existing trade setups
- Wait for color alignment with your market bias
- Avoid trading during predominantly gray periods
### 4. Risk Management
- Gray bars can serve as early warning signs of weakening trends
- Color changes might indicate appropriate exit points
- Use in conjunction with other risk management tools
## Advantages
1. **Dual Filtering**: Combines momentum (trend bars) with trend direction (Okuninushi Line)
2. **Visual Clarity**: Immediate visual feedback through candle coloring
3. **Customizable**: Adjustable parameters for different trading styles
4. **Versatile**: Works across multiple timeframes and instruments
5. **Objective**: Rule-based system reduces subjective interpretation
## Limitations
1. **Lagging Nature**: Based on historical price data
2. **False Signals**: Can produce whipsaws in choppy markets
3. **Parameter Sensitivity**: Requires optimization for different instruments
4. **Market Conditions**: May be less effective in ranging markets
## Best Practices
### Optimization Tips:
- **Volatile Markets**: Use higher thresholds (80-90%)
- **Steady Trends**: Use moderate thresholds (60-75%)
- **Short-term Trading**: Shorter Okuninushi Line periods (26)
- **Long-term Analysis**: Longer Okuninushi Line periods (104+)
### Combination Strategies:
- Pair with volume indicators for confirmation
- Use alongside support/resistance levels
- Combine with other trend-following indicators
- Consider market context and overall trend direction
## Conclusion
The Trend Bars with Okuninushi Line Filter offers traders a sophisticated yet intuitive way to identify high-quality trending moves. By combining the momentum characteristics of trend bars with the directional filter of the Okuninushi Line, this indicator helps traders focus on the most promising opportunities while avoiding low-probability setups.
Remember that no single indicator should be used in isolation. Always consider market context, risk management, and other technical factors when making trading decisions. The true power of this indicator lies in its ability to quickly highlight periods of strong, aligned price action – exactly what trend traders are looking for.
---
*Disclaimer: This article is for educational purposes only and should not be considered as financial advice. Always conduct your own research and consider your risk tolerance before making any trading decisions.*
Multiplied and Divided Moving Average ### Multiplied and Divided Moving Average Indicator
**Description**:
The "Multiplied and Divided Moving Average" indicator is a customizable tool for TradingView users, designed to create dynamic bands around a user-selected moving average (MA). It calculates a moving average (SMA, EMA, WMA, VWMA, or RMA) and generates a user-defined number of lines above and below it by multiplying and dividing the MA by linearly spaced factors. These bands serve as potential support and resistance levels, aiding in trend identification, mean reversion strategies, or breakout detection. Optional Buy/Sell labels appear when the price crosses below the divided MAs (Buy) or above the multiplied MAs (Sell), providing clear visual cues for trading opportunities.
**Key Features**:
- **Flexible MA Types**: Choose from Simple (SMA), Exponential (EMA), Weighted (WMA), Volume-Weighted (VWMA), or Running (RMA) moving averages.
- **Customizable Bands**: Set the number of lines (0–10) above and below the MA, allowing tailored analysis for any market or timeframe.
- **Dynamic Factors**: Bands are created using factors that scale linearly from 1 to a user-defined maximum (default: 5.0), creating intuitive overbought/oversold zones.
- **Buy/Sell Signals**: Optional labels highlight potential entry (Buy) and exit (Sell) points when the price crosses the bands.
- **Clear Visuals**: The main MA is plotted in blue, with green (multiplied) and red (divided) lines using graduated transparency for easy differentiation.
**Inputs**:
- **MA Type**: Select the moving average type (default: SMA).
- **MA Length**: Set the MA period (default: 14).
- **Number of Lines Above/Below**: Choose how many bands to plot above and below the MA (default: 4, range: 0–10).
- **Max Factor**: Define the largest multiplier/divisor for the outermost bands (default: 5.0).
- **Source**: Select the price data for the MA (default: close).
- **Show Buy/Sell Labels**: Enable or disable Buy/Sell labels (default: true).
**How It Works**:
1. Calculates the chosen moving average based on user inputs.
2. Creates up to 10 lines above the MA (e.g., MA × 2, ×3, ×4, ×5 for `numLines=4`, `maxFactor=5`) and 10 below (e.g., MA ÷ 2, ÷3, ÷4, ÷5).
3. Plots the main MA in blue, multiplied lines in green, and divided lines in red, with transparency increasing for outer bands.
4. If enabled, displays "Buy" labels when the price crosses below any divided MA and "Sell" labels when it crosses above any multiplied MA, positioned at the outermost band.
**Use Cases**:
- **Trend Analysis**: Use the bands as dynamic support/resistance to confirm trend direction or reversals.
- **Mean Reversion**: Identify overbought (near multiplied MAs) or oversold (near divided MAs) conditions.
- **Breakout Trading**: Monitor price crossovers of the outermost bands for potential breakout signals.
- **Signal Confirmation**: Use Buy/Sell labels for swing trading or to complement other indicators.
**How to Use**:
1. Copy the script into TradingView’s Pine Editor.
2. Compile and apply it to your chart (e.g., stocks, forex, crypto).
3. Adjust inputs like `numLines`, `maxFactor`, or `maType` to fit your strategy.
4. Enable `Show Buy/Sell Labels` to visualize trading signals.
5. Test on various timeframes (e.g., 1H, 4H, 1D) and assets to optimize settings.
**Example Settings**:
- **Swing Trading**: Use `numLines=3`, `maxFactor=4`, `maType=EMA`, `maLength=20` on a 4-hour chart.
- **Intraday**: Try `numLines=2`, `maxFactor=3`, `maType=SMA`, `maLength=10` on a 15-minute chart.
**Notes**:
- **Performance**: Supports up to 20 bands (10 above, 10 below), staying within TradingView’s 64-plot limit.
- **False Signals**: In choppy markets, frequent crossovers may occur. Combine with trend filters (e.g., ADX, higher-timeframe MA) to reduce noise.
- **Enhancements**: Add alerts via TradingView’s alert system for Buy/Sell signals, or experiment with different `maxFactor` values for volatility.
**Limitations**:
- Bands are reactive, as they’re based on a moving average, so confirm signals with other indicators.
- High `numLines` values may clutter the chart; use 2–4 for clarity.
- Signals may lag in fast-moving markets due to the MA’s smoothing effect.
This indicator is perfect for traders seeking a customizable, visually clear tool to enhance technical analysis on TradingView. For support, feature requests (e.g., alerts, custom colors), or community discussion, visit TradingView’s forums or contact the script author.

Quantile Regression Bands [BackQuant]Quantile Regression Bands
Tail-aware trend channeling built from quantiles of real errors, not just standard deviations.
What it does
This indicator fits a simple linear trend over a rolling lookback and then measures how price has actually deviated from that trend during the window. It then places two pairs of bands at user-chosen quantiles of those deviations (inner and outer). Because bands are based on empirical quantiles rather than a symmetric standard deviation, they adapt to skewed and fat-tailed behaviour and often hug price better in trending or asymmetric markets.
Why “quantile” bands instead of Bollinger-style bands?
Bollinger Bands assume a (roughly) symmetric spread around the mean; quantiles don’t—upper and lower bands can sit at different distances if the error distribution is skewed.
Quantiles are robust to outliers; a single shock won’t inflate the bands for many bars.
You can choose tails precisely (e.g., 1%/99% or 5%/95%) to match your risk appetite.
How it works (intuitive)
Center line — a rolling linear regression approximates the local trend.
Residuals — for each bar in the lookback, the indicator looks at the gap between actual price and where the line “expected” price to be.
Quantiles — those gaps are sorted; you select which percentiles become your inner/outer offsets.
Bands — the chosen quantile offsets are added to the current end of the regression line to draw parallel support/resistance rails.
Smoothing — a light EMA can be applied to reduce jitter in the line and bands.
What you see
Center (linear regression) line (optional).
Inner quantile bands (e.g., 25th/75th) with optional translucent fill.
Outer quantile bands (e.g., 1st/99th) with a multi-step gradient to visualise “tail zones.”
Optional bar coloring: bars trend-colored by whether price is rising above or falling below the center line.
Alerts when price crosses the outer bands (upper or lower).
How to read it
Trend & drift — the slope of the center line is your local trend. Persistent closes on the same side of the center line indicate directional drift.
Pullbacks — tags of the inner band often mark routine pullbacks within trend. Reaction back to the center line can be used for continuation entries/partials.
Tails & squeezes — outer-band touches highlight statistically rare excursions for the chosen window. Frequent outer-band activity can signal regime change or volatility expansion.
Asymmetry — if the upper band sits much further from the center than the lower (or vice versa), recent behaviour has been skewed. Trade management can be adjusted accordingly (e.g., wider take-profit upslope than downslope).
A simple trend interpretation can be derived from the bar colouring
Good use-cases
Volatility-aware mean reversion — fade moves into outer bands back toward the center when trend is flat.
Trend participation — buy pullbacks to the inner band above a rising center; flip logic for shorts below a falling center.
Risk framing — set dynamic stops/targets at quantile rails so position sizing respects recent tail behaviour rather than fixed ticks.
Inputs (quick guide)
Source — price input used for the fit (default: close).
Lookback Length — bars in the regression window and residual sample. Longer = smoother, slower bands; shorter = tighter, more reactive.
Inner/Outer Quantiles (τ) — choose your “typical” vs “tail” levels (e.g., 0.25/0.75 inner, 0.01/0.99 outer).
Show toggles — independently toggle center line, inner bands, outer bands, and their fills.
Colors & transparency — customize band and fill appearance; gradient shading highlights the tail zone.
Band Smoothing Length — small EMA on lines to reduce stair-step artefacts without meaningfully changing levels.
Bar Coloring — optional trend tint from the center line’s momentum.
Practical settings
Swing trading — Length 75–150; inner τ = 0.25/0.75, outer τ = 0.05/0.95.
Intraday — Length 50–100 for liquid futures/FX; consider 0.20/0.80 inner and 0.02/0.98 outer in high-vol assets.
Crypto — Because of fat tails, try slightly wider outers (0.01/0.99) and keep smoothing at 2–4 to tame weekend jumps.
Signal ideas
Continuation — in an uptrend, look for pullback into the lower inner band with a close back above the center as a timing cue.
Exhaustion probe — in ranges, first touch of an outer band followed by a rejection candle back inside the inner band often precedes mean-reversion swings.
Regime shift — repeated closes beyond an outer band or a sharp re-tilt in the center line can mark a new trend phase; adjust tactics (stop-following along the opposite inner band).
Alerts included
“Price Crosses Upper Outer Band” — potential overextension or breakout risk.
“Price Crosses Lower Outer Band” — potential capitulation or breakdown risk.
Notes
The fit and quantiles are computed on a fixed rolling window and do not repaint; bands update as the window moves forward.
Quantiles are based on the recent distribution; if conditions change abruptly, expect band widths and skew to adapt over the next few bars.
Parameter choices directly shape behaviour: longer windows favour stability, tighter inner quantiles increase touch frequency, and extreme outer quantiles highlight only the rarest moves.
Final thought
Quantile bands answer a simple question: “How unusual is this move given the current trend and the way price has been missing it lately?” By scoring that question with real, distribution-aware limits rather than one-size-fits-all volatility you get cleaner pullback zones in trends, more honest “extreme” tags in ranges, and a framework for risk that matches the market’s recent personality.

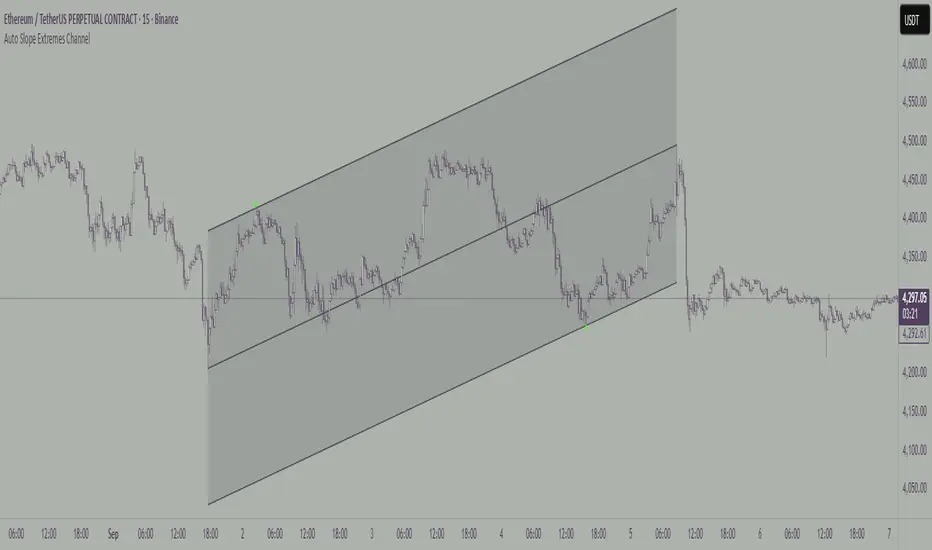
Auto Slope Extremes ChannelAuto Slope Extremes Channel
Expanding channel that locks onto the highest high and lowest low of the slope between A and B.
This indicator builds a dynamic channel between two anchors, A and B.
Unlike fixed-width channels, it adapts to the slope of the leg between A and B and expands until:
• The upper channel line touches the highest candle in that slope.
• The lower channel line touches the lowest candle in that slope.
This method ensures that the channel edges are defined only by the single most extreme high and the single most extreme low within the selected leg. No other candles in the range touch the edges.
A centerline is drawn midway between the two extremes, and small triangle markers highlight the exact candles that determine the upper and lower boundaries.
Features
• Anchored channel defined by two user-selected points (A and B).
• Expands to fit the highest high and lowest low of the slope between A and B.
• Optional centerline and channel fill.
• Extend lines left, right, or both.
• Customizable line widths and colours.
Weekly/Monthly Golden ATR LevelsWeekly/Monthly Golden ATR Levels
This indicator is designed to give traders a clear, rule-based framework for identifying support and resistance zones anchored to prior period ranges and the market’s own volatility. It uses the Average True Range (ATR) as a measure of how far price can realistically stretch, then projects fixed levels from the midpoint of the prior week and prior month.
Rather than “moving targets” that repaint, these levels are frozen at the start of each new week and month and stay fixed until the next period begins. This makes them reliable rails for both intraday and swing trading.
What It Plots
Weekly Midpoint (last week’s High + Low ÷ 2)
From this mid, the script projects:
Weekly +1 / −1 ATR
Weekly +2 / −2 ATR
Monthly Midpoint (last month’s High + Low ÷ 2)
From this mid, the script projects:
Monthly +1 / −1 ATR
Monthly +2 / −2 ATR
Customization
Set ATR length & timeframe (default: 14 ATR on Daily bars).
Adjust multipliers for Level 1 (±1 ATR) and Level 2 (±2 ATR).
Choose line color, style, and width separately for weekly and monthly bands.
Toggle labels on/off.
How to Use
Context at the Open
If price opens above last week’s midpoint, bias favors upside toward +1 / +2.
If price opens below the midpoint, bias favors downside toward −1 / −2.
Weekly Bands = Short-Term Rails
+1 / −1 ATR: Rotation pivots. Expect intraday reaction.
+2 / −2 ATR: Extreme stretch zones. Reversals or breakouts often occur here.
Monthly Bands = Big Picture Rails
Use these for swing positioning, or as “outer guardrails” on intraday charts.
When weekly and monthly bands cluster → high-confluence zone.
Trade Playbook
Trend Day: Hold above +1 → target +2. Break below −1 → target −2.
Range Day: Fade first test of ±2, scalp toward ±1 or midpoint.
Catalyst/News Day: Use with caution—levels provide context, not barriers.
Risk Management
Place stops just outside the band you’re trading against.
Scale profits at the next inner level (e.g., short from +2, cover partial at +1).
Runners can trail to the midpoint or opposite side.
Why It Works
ATR measures volatility—how far price tends to travel in a given period.
Anchoring to prior highs and lows captures where real supply/demand last clashed.
Combining the two gives levels that are statistically relevant, widely observed, and psychologically sticky.
Trading books from Mark Douglas (Trading in the Zone), Jared Tendler (The Mental Game of Trading), and Oliver Kell (Victory in Stock Trading) all stress the importance of having objective, repeatable reference points. These levels deliver that discipline—removing guesswork and reducing emotional trading

Supertrend Channel Histogram OscillatorThis histogram is based on the script "Supertrend Channels "
The idea of the indicator is to visually represent the interaction of price with several different supertrend channels of various lengths in an oscillator in order to make it much more clear to the trader how the longer trends are interacting with shorter trends of the price movement of an asset. I got this idea from the "Kurutoga Cloud" and "Kurutoga Histogram" by D7R which is based on the centerlines of 3 Donchian Channels, however after I started using the Supertrend Channel by LuxAlgo I found that it was a more reliable price range channel than a standard Donchian Channel and I made this indicator to accompany it.
This indicator plots a positive value above 0 when the price is above the centerline of the supertrend channel and a negative value below 0 when the price is below the centerline.
The first supertrend's length and multiple can be adjusted in the settings.
The given supertrend input is then doubled and quadrupled in both length and multiplication so that a supertrend histogram with the values of 3, 3 will be accompanied by 2 additional supertrend histograms with the values of 6, 6 and 12, 12.
The larger price trend histograms are clearly visible behind the short term supertrend channel's histogram, giving traders a balanced view of short and long term trends interacting. The less visible columns of the larger trend remain above or below the 0 line behind the more visible short term channel trend, helping to spot pullbacks within a larger trend.
Additionally, when the 3 separate histograms are all positive or all negative but the histogram columns are separating from each other this can indicate a potential trend exhaustion leading to reversal or pullback about to happen.
The overbought and oversold lines at 50 and -50 are representative primarily of the short term trend with above 50 or below -50 indicating that the price is pushing the boundary and potentially beginning a new short term supertrend in the opposite direction. If values do not noticably exceed these levels, then the current short term trend movement can be viewed as a pullback within a larger trend, with continuation potentially to follow.
I have had troubles converting the original code to v6 so this will be published here in v5 of pinescript to be used in conjunction with the original. I was intending to create a companion indicator for this oscillator that represents 3 supertrends with corresponding 2x and 4x calculations based on LuxAlgo's script, but I can't seem to get it to work correctly in v5.
For best visualization of the trends 3 LuxAlgo Supertrend channels with 2x and 4x values should be used in conjunction with each other to fully visualize the histogram.
Used in conjunction with other indicators this can be a very effective strategy to capture larger trend moves and pullbacks within trends, as well as warn of potential price trend exhaustion.
TURT Donchian Ladder v3.13How to trade TURT+ with the v3.13 script
1) Pick the system & arm the entry
• In the script, choose System = S1 (20D) or S2 (55D).
The HUD always shows both rails for reference, but the ladder (Entry/+Adds) uses the system you pick.
• Your Entry is shown as Pivot + 0.1×N (rounded).
• Place a stop-limit “parent” order at that Entry price. (Classic Turtle uses an entry stop; I suggest a tight limit offset so you don’t chase a blow-through.)
• Initial stop = N2 = Entry − 2×N (rounded). Put that in immediately.
If you like only confirming on a bar close, leave confirmClose = true and place the parent after the close that breaks out. If you want intrabar fills, set confirmClose = false and keep the stop-limit active intraday.
2) Size it the way you planned
• Set acctEquity / riskCapPct / posCapUSD / entryFrac / entryRiskFrac / sizingMode.
• HUD gives Rec Entry Qty (when flat) and, once in, it shows:
• Next Rung (price)
• Suggested AddShares (honors RiskCap & PosCap)
• Proj Stop if Add (ratcheted N2)
• A limiter note (RiskCap or PosCap) if you’re constrained.
3) After entry fills, stage the ADDs (only at fixed +N steps)
• Adds are NOT “every Donchian break.” You add only at:
• Add-1 = Entry + 0.5×N
• Add-2 = Entry + 1.0×N
• Add-3 = Entry + 1.5×N (optional)
• Use the HUD’s Suggested AddShares for each rung (it respects your RiskCap/PosCap).
• Place stop-limit orders for each add (either immediately as a contingent OTO chain that arms only after Entry fills, or you arm each add when price approaches—your choice).
• On each add fill, ratchet the catastrophic stop for the entire position to Last-Add − 2×N (the script and HUD show Proj Stop if Add so you know where it will land). Never move it lower.
Pro tip: If your broker supports OTO/OTOCO:
• OTO parent = Entry stop-limit.
• On fill, fire an OCO with the N2 stop (no target), and also stage child stop-limits for Add-1 / Add-2 / Add-3 with the correct sizes. If your broker can’t chain that deep, just use the script’s alerts (Entry/Add-1/Add-2/Add-3/Exits) to place/adjust orders quickly.
4) Exits (two layers)
• Catastrophic (always on): the N2 stop you’re ratcheting (Last-Add − 2×N).
• Trend exits (runner):
• S1: 10-low close (HUD shows it).
• S2: 20-low close (HUD shows it).
• Profit-taking (optional): sell ~50% at +2.5R to +3R vs current N2; let the runner trail with 10-low/20-low. You can keep N2 as a hard backstop.
5) Should you pre-set everything or buy live?
Both work; pick the style that fits you:
Preset (Turtle-pure, rules-based)
• ✅ You won’t miss the breakout; minimal discretion.
• ✅ Broker handles fills even if you’re away.
• ⚠️ You may get the occasional intraday “poke” (use confirmClose + place after close if you want fewer).
Buy on break manually
• ✅ Lets you check tape/volume or any extra gates before clicking.
• ⚠️ Higher chance of slippage or of simply missing the trigger.
A nice hybrid: place the Entry order, then arm Add-1/2/3 when price is nearing each rung and the HUD shows Suggested AddShares > 0 (green risk read).
⸻
6) Quick checklist per trade
1. System: S1 or S2?
2. Levels: Entry / Add-1 / Add-2 / Add-3 / 10-low / 20-low / N2 (rounded).
3. Sizing: confirm RiskCap/PosCap; HUD shows Suggested AddShares and limiter.
4. Orders:
• Parent Entry stop-limit.
• N2 stop (rounded).
• Stage adds (stop-limits) with sizes from HUD.
5. On fill: ratchet stop to Last-Add − 2×N; adjust remaining adds and sizes.
⸻
7) Example with your MU position (pattern)
• You’re already in: set entryQty and entryPman in the inputs to match your fill.
• HUD now focuses on Next Rung, Suggested AddShares, and Proj Stop if Add.
• If Suggested AddShares = 0 and limiter says RiskCap or PosCap, you’ll still see the next rung price and Proj Stop if Add so you can decide whether to override.
⸻
Bottom line
• Entry: buy the Donchian breakout + 0.1N with a stop-limit (Turtle style).
• Adds: only at +0.5N steps, sized by HUD; not on every future Donchian break.
• Stops: keep (and ratchet) the N2 catastrophic; trail runner on 10-low / 20-low.
If you want, tell me your broker/platform and I’ll map this to exact order ticket types (stop-limit/OTO/OCO) and a tiny checklist you can keep next to your screen.

Rolling Range Bands by tvigRolling Range Bands
Plots two dynamic price envelopes that track the highest and lowest prices over a Short and Long lookback. Use them to see near-term vs. broader market structure, evolving support/resistance, and volatility changes at a glance.
What it shows
• Short Bands: recent trading range (fast, more reactive).
• Long Bands: broader range (slow, structural).
• Optional step-line style and shaded zones for clarity.
• Option to use completed bar values to avoid intrabar jitter (no repaint).
How to read
• Price pressing the short high while the long band rises → short-term momentum in a larger uptrend.
• Price riding the short low inside a falling long band → weakness with trend alignment.
• Band squeeze (narrowing) → compression; watch for breakout.
• Band expansion (widening) → rising volatility; expect larger swings.
• Repeated touches/rejections of long bands → potential areas of support/resistance.
Inputs
• Short Window, Long Window (bars)
• Use Close only (vs. High/Low)
• Use completed bar values (stability)
• Step-line style and Band shading
Tips
• Works on any symbol/timeframe; tune windows to your market.
• For consistent scaling, pin the indicator to the same right price scale as the chart.
Not financial advice; combine with trend/volume/RSI or your system for entries/exits.

Volume > 20-day Avg (xMult)It’s an indicator that changes color and triggers an alert when volume exceeds the 20-day average. By default, the threshold is set to 1.2× the 20-day average (i.e., 120%), and the value is user-configurable.
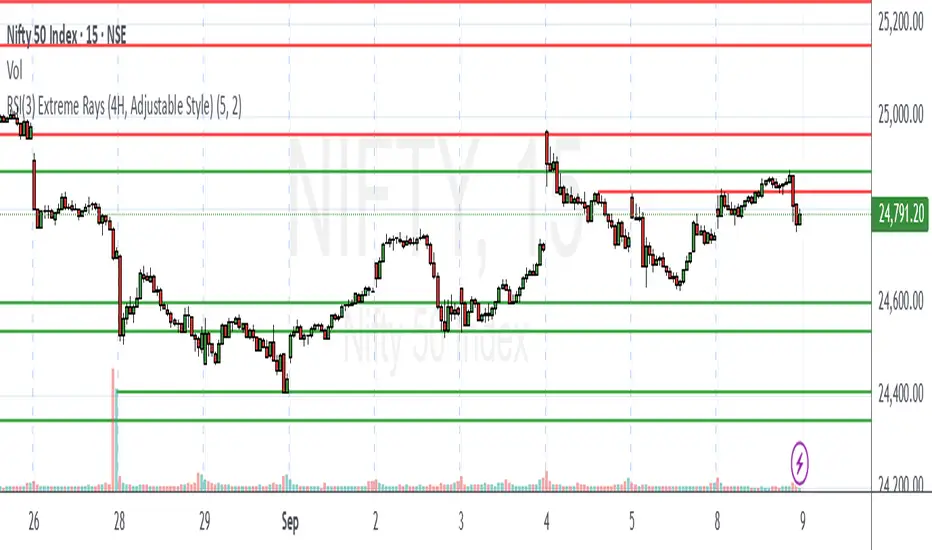
Chanpreet RSI(3) Extreme Rays (4H, Adjustable Style)Chanpreet RSI(3) Extreme Rays (4H)
This indicator applies a short-length RSI (3) on the 4-hour timeframe and highlights momentum extremes directly on the chart.
🔎 What it does
Detects when RSI(3) moves into overbought (>80) or oversold (<20) territory.
Groups consecutive candles inside these zones into one “event” instead of marking each bar individually.
For each event:
• In overbought → records the highest high of the stretch and marks it with a horizontal ray.
• In oversold → records the lowest low of the stretch and marks it with a horizontal ray.
Keeps only the most recent N rays (default 5, adjustable).
⚙️ Inputs
Max Rays to Keep → how many unique events are kept visible.
Ray Thickness → adjust line thickness.
Overbought Ray Color → default red.
Oversold Ray Color → default green.
📈 How to use
Apply on any chart; RSI(3) values are always calculated from 4H data (via request.security).
Use rays as reference levels that highlight recent momentum extremes or exhaustion zones.
This is not a buy/sell signal by itself — combine with your own analysis, confirmation tools, and risk management.
Best Recommended time frame is 5 mins, 10 mins & 15 mins for intraday trading.
🧩 Unique features
Groups multiple bars into a single clean ray, reducing clutter.
Uses 4H RSI(3) regardless of the chart’s active timeframe.
Fully customizable appearance (colors, thickness, max events).
⚠️ Disclaimer
This script is provided for educational and informational purposes only.
It does not constitute financial advice or guarantee performance.
Always test thoroughly and use proper risk management before trading live.
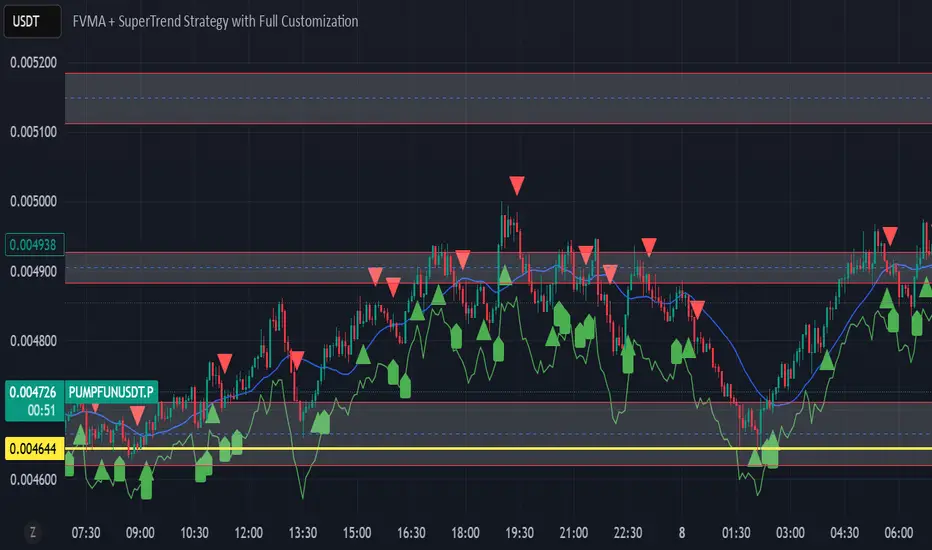
FVMA + SuperTrend + top and bottom Strategy Full CustomizationFVMA + SuperTrend + top and bottom Strategy Full Customization
RSI Pivots with Divergence Overlay█ OVERVIEW
The RSI Pivots with Divergence Overlay indicator is an advanced tool based on RSI, displaying dynamic bands on the price chart to simplify the identification of overbought and oversold conditions. Pivot points and divergences between them are derived from these bands, providing a comprehensive view of the market and enabling the creation of various trading strategies based on this single indicator.
█ CONCEPTS
Areas where RSI exits the bands are often reversal points in the market. The concept of this indicator is to highlight places where the probability of a trend reversal increases. Therefore, pivots and divergences have been added to better identify these key moments. Additionally, the bands allow viewing the market context in relation to the RSI indicator, facilitating analysis of momentum and volatility.
█ KEY FEATURES
Dynamic Bands and RSI Signals: The bands are calculated based on the closing price and RSI value, with dynamic scaling adjusted to market volatility. The upper band corresponds to overbought levels, the lower to oversold, and the midline is their average. The price level relative to the bands serves as a visual RSI signal, indicating potential overbought or oversold conditions.
Pivot Points: The indicator identifies local price highs and lows in relation to RSI levels. The pivot level is taken from the high/low of the candle. A high pivot is detected when the high of the candle reaches a local maximum after crossing the upper RSI level (overbought), signaling a potential reversal. A low pivot appears after a local price minimum following a drop below the lower RSI level (oversold), indicating a possible uptrend reversal. The pivot length (default 2 bars) defines the search range for these extremes, meaning that with a length of 2, a potential divergence signal will appear with a 2-candle delay, as this is the minimum time required to confirm a local pivot. Pivot lines are drawn on the chart, and labels display the RSI value (from the close of the candle) and price at the detection moment. Pivot lines disappear after the detection of the next low pivot for lower lines and high pivot for upper lines, but unbreached lines or those with high volume may still serve as support or resistance levels.
Divergence Detection: The indicator automatically detects divergences to predict trend changes. Bearish divergence occurs when the price forms a higher high pivot, but the RSI (from the close of the candle) is lower than in the previous pivot, indicating weakening upward momentum and a potential bearish reversal. Bullish divergence appears when the price forms a lower low pivot, but the RSI is higher, suggesting building momentum and a possible bullish reversal. Divergences are marked in pivot labels (e.g., "Bear Div" or "Bull Div") and supported by alerts upon detection.
Return Signals: The indicator generates buy and sell signals based on RSI (price) returning to the bands after extreme conditions, independently of pivots and divergences. A buy signal is triggered when RSI (price) crosses above the lower level (exiting oversold), suggesting a potential price rise toward the midline or upper band. A sell signal occurs when RSI (price) falls below the upper level (exiting overbought), indicating a possible price drop toward the lower band. Signals are visualized as arrows (up/down triangles) on the chart, with customizable colors.
█ CONFIGURATION
The indicator offers extensive customization options:
RSI Length (rsiLength): Sets the number of periods used to calculate RSI (default 14).
RSI Upper Level (rsiUpper): Defines the overbought threshold (default 70).
RSI Lower Level (rsiLower): Defines the oversold threshold (default 30).
Band Scaling (scale): Determines the scaling multiplier for bands based on market volatility (default 15.0).
SMA Length for Candle Midpoint (length): Number of periods for calculating the moving average of candle midpoints (default 200). This parameter is used to smooth price data, enabling more accurate volatility assessment and band width adjustment to market dynamics.
Pivot Length (pivotLength): Sets the range (in bars) for detecting local price extremes (default 2).
Pivot Label Offset (pivotLabelOffset): Multiplier for the candle range to position pivot labels (default 0.3).
Show Bands (showBands): Enables/disables the display of bands on the chart.
Show Fill (showFill): Enables/disables the fill between bands and the midline.
Show Pivot Lines (showPivotLines): Enables/disables pivot lines on the chart.
Show Pivot Labels (showPivotLabels): Enables/disables labels with RSI and price values at pivots.
Show Return Signals (showReturnSignals): Enables/disables the display of buy and sell signals.
Colors and Style: Customizable colors for bands, fills, pivot lines, labels, and line widths (default 1).
█ USAGE
The indicator performs best when combined with other technical analysis tools, such as Fibonacci levels, moving averages, or trendlines, to confirm pivot, divergence, and return signals. It enables traders to identify key reversal points, detect hidden trend weaknesses through divergences, and confirm trade entries with return signals.
Usage Examples:
Price bounces off a previous pivot with high volume – this increases the probability of a trend change or correction.
A similar situation when RSI is outside the bands strengthens the signal.
If divergence occurs in addition, we have further confirmation.
This can be combined with Fibonacci levels to check if Fibo zones overlap with pivot lines – this may increase the chance of a strong price reaction.
█ ALERTS
The indicator supports alerts for:
Buy and sell signals (RSI returning to bands).
Detection of bearish and bullish divergences.

FVMA + SuperTrend Strategythis code is using a combination of 2 indicators, whcih are FVMA and the SuperTrend .