S.T. TREND INDICATORIt is TREND indicator. it has 8 supertrends which can be used for different higher time frame & with different atr & multiplier.which will give better idea of varius trend like long ,medium,short & immediate trend.it also has daily & weekly vwap. and two sma with adjustable length & timeframe. source used for calculation of supertrends is 1min HA candles.yyou can use it onnormal japnees candle also.
النطاقات والقنوات
Trend Trader//@version=6
indicator("Trend Trader", shorttitle="Trend Trader", overlay=true)
// User-defined input for moving averages
shortMA = input.int(10, minval=1, title="Short MA Period")
longMA = input.int(100, minval=1, title="Long MA Period")
// User-defined input for the instrument selection
instrument = input.string("US30", title="Select Instrument", options= )
// Set target values based on selected instrument
target_1 = instrument == "US30" ? 50 :
instrument == "NDX100" ? 25 :
instrument == "GER40" ? 25 :
instrument == "GOLD" ? 5 : 5 // default value
target_2 = instrument == "US30" ? 100 :
instrument == "NDX100" ? 50 :
instrument == "GER40" ? 50 :
instrument == "GOLD" ? 10 : 10 // default value
// User-defined input for the start and end times with default values
startTimeInput = input.int(12, title="Start Time for Session (UTC, in hours)", minval=0, maxval=23)
endTimeInput = input.int(17, title="End Time Session (UTC, in hours)", minval=0, maxval=23)
// Convert the input hours to minutes from midnight
startTime = startTimeInput * 60
endTime = endTimeInput * 60
// Function to convert the current exchange time to UTC time in minutes
toUTCTime(exchangeTime) =>
exchangeTimeInMinutes = exchangeTime / 60000
// Adjust for UTC time
utcTime = exchangeTimeInMinutes % 1440
utcTime
// Get the current time in UTC in minutes from midnight
utcTime = toUTCTime(time)
// Check if the current UTC time is within the allowed timeframe
isAllowedTime = (utcTime >= startTime and utcTime < endTime)
// Calculating moving averages
shortMAValue = ta.sma(close, shortMA)
longMAValue = ta.sma(close, longMA)
// Plotting the MAs
plot(shortMAValue, title="Short MA", color=color.blue)
plot(longMAValue, title="Long MA", color=color.red)
// MACD calculation for 15-minute chart
= request.security(syminfo.tickerid, "15", ta.macd(close, 12, 26, 9))
macdColor = macdLine > signalLine ? color.new(color.green, 70) : color.new(color.red, 70)
// Apply MACD color only during the allowed time range
bgcolor(isAllowedTime ? macdColor : na)
// Flags to track if a buy or sell signal has been triggered
var bool buyOnce = false
var bool sellOnce = false
// Tracking buy and sell entry prices
var float buyEntryPrice_1 = na
var float buyEntryPrice_2 = na
var float sellEntryPrice_1 = na
var float sellEntryPrice_2 = na
if not isAllowedTime
buyOnce :=false
sellOnce :=false
// Logic for Buy and Sell signals
buySignal = ta.crossover(shortMAValue, longMAValue) and isAllowedTime and macdLine > signalLine and not buyOnce
sellSignal = ta.crossunder(shortMAValue, longMAValue) and isAllowedTime and macdLine <= signalLine and not sellOnce
// Update last buy and sell signal values
if (buySignal)
buyEntryPrice_1 := close
buyEntryPrice_2 := close
buyOnce := true
if (sellSignal)
sellEntryPrice_1 := close
sellEntryPrice_2 := close
sellOnce := true
// Apply background color for entry candles
barcolor(buySignal or sellSignal ? color.yellow : na)
/// Creating buy and sell labels
if (buySignal)
label.new(bar_index, low, text="BUY", style=label.style_label_up, color=color.green, textcolor=color.white, yloc=yloc.belowbar)
if (sellSignal)
label.new(bar_index, high, text="SELL", style=label.style_label_down, color=color.red, textcolor=color.white, yloc=yloc.abovebar)
// Creating labels for 100-point movement
if (not na(buyEntryPrice_1) and close >= buyEntryPrice_1 + target_1)
label.new(bar_index, high, text=str.tostring(target_1), style=label.style_label_down, color=color.green, textcolor=color.white, yloc=yloc.abovebar)
buyEntryPrice_1 := na // Reset after label is created
if (not na(buyEntryPrice_2) and close >= buyEntryPrice_2 + target_2)
label.new(bar_index, high, text=str.tostring(target_2), style=label.style_label_down, color=color.green, textcolor=color.white, yloc=yloc.abovebar)
buyEntryPrice_2 := na // Reset after label is created
if (not na(sellEntryPrice_1) and close <= sellEntryPrice_1 - target_1)
label.new(bar_index, low, text=str.tostring(target_1), style=label.style_label_up, color=color.red, textcolor=color.white, yloc=yloc.belowbar)
sellEntryPrice_1 := na // Reset after label is created
if (not na(sellEntryPrice_2) and close <= sellEntryPrice_2 - target_2)
label.new(bar_index, low, text=str.tostring(target_2), style=label.style_label_up, color=color.red, textcolor=color.white, yloc=yloc.belowbar)
sellEntryPrice_2 := na // Reset after label is created

3:55 PM Candle High/Low Levels (ARADO VERSION)a lil better in smaller tfs. Its a veryyyyy cool indicator guys (thanks ivan)

Fib Golden RatioDynamic Fib High → Low (0.5 & 0.618)
This indicator automatically tracks the current day’s High and Low and plots the key Fibonacci retracement levels 0.5 (50%) and 0.618 (Golden Ratio) based on the live intraday price range.
The tool is designed for traders who want simple, clean, and dynamic intraday Fibonacci levels without clutter on the chart.
How It Works
Detects the start of a new trading day
Tracks the highest high and lowest low of the current day
Continuously recalculates:
Fibonacci 0.5 (Midpoint)
Fibonacci 0.618 (Golden Ratio)
Plots clean continuous lines across the chart
Fib is calculated from High → Low, matching how typical intraday fib tools are visually applied
Why This Indicator
No drawings to manually adjust
No user configuration required
Extremely lightweight and fast
Automatically adjusts as the day progresses
Perfect for identifying intraday mean reversion zones, pullback zones, and reaction levels
Ideal Use Cases
Intraday directional trading
Scalping pullbacks
Mean reversion setups
Identifying dynamic support/resistance zones
Option scalping (CE/PE)

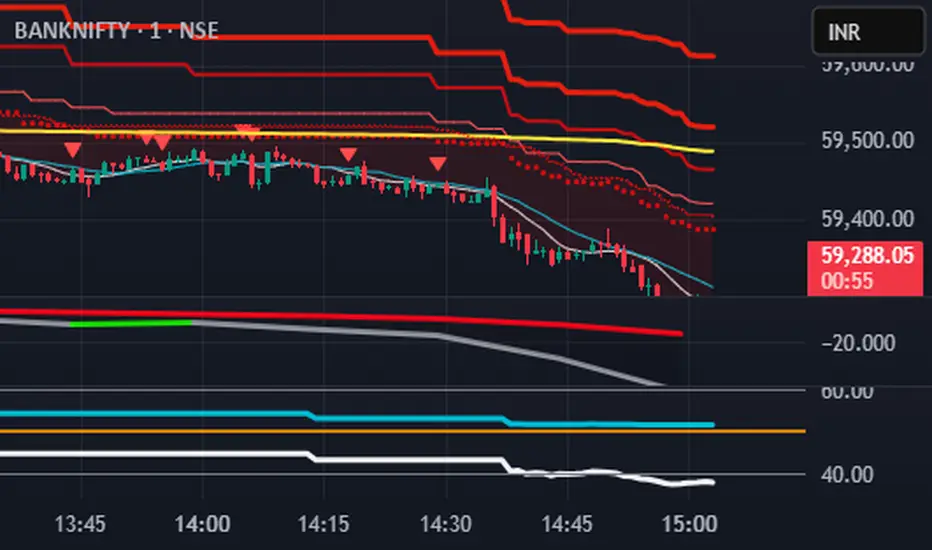
Anchored VWAP + Bands + Signals//@version=5
indicator("Anchored VWAP + Bands + Signals", overlay=true)
// ===== INPUTS =====
anchorTime = input.time(timestamp("2025-12-02 00:00"), "Anchor Date/Time")
std1 = input.float(1.0, "±1σ Band")
std2 = input.float(2.0, "±2σ Band")
// ===== VWAP CALCULATION =====
var float cumPV = 0.0
var float cumVol = 0.0
if time >= anchorTime
cumPV += close * volume
cumVol += volume
vwap = cumVol != 0 ? cumPV / cumVol : na
// ===== STANDARD DEVIATION =====
barsSinceAnchor = bar_index - ta.valuewhen(time >= anchorTime, bar_index, 0)
sd = barsSinceAnchor > 1 ? ta.stdev(close, barsSinceAnchor) : 0
// ===== BANDS =====
upper1 = vwap + std1 * sd
lower1 = vwap - std1 * sd
upper2 = vwap + std2 * sd
lower2 = vwap - std2 * sd
plot(vwap, color=color.orange, title="VWAP")
plot(upper1, color=color.green, title="+1σ Band")
plot(lower1, color=color.green, title="-1σ Band")
plot(upper2, color=color.red, title="+2σ Band")
plot(lower2, color=color.red, title="-2σ Band")
// ===== SIGNALS =====
buySignal = ta.crossover(close, lower1)
sellSignal = ta.crossunder(close, upper1)
plotshape(buySignal, style=shape.triangleup, location=location.belowbar, color=color.green, size=size.small, title="Buy Signal")
plotshape(sellSignal, style=shape.triangledown, location=location.abovebar, color=color.red, size=size.small, title="Sell Signal")
alertcondition(buySignal, title="Buy Alert", message="Price touched lower 1σ band – Buy Opportunity")
alertcondition(sellSignal, title="Sell Alert", message="Price touched upper 1σ band – Sell Opportunity")

Daily Anchored VWAPAnchors VWAP to whatever time you want instead of the usual start of session. I use it for BTC so that I can anchor around NY open instead of the night before.

Donchian ForecastDonchian Forecast – multi-timeframe Donchian/ATR bias with ADX regime blending
Donchian Forecast is a multi-timeframe bias tool that turns classic Donchian channels into a normalized trend/mean-reversion “forecast” and a single bias value in .
It projects a short polyline path from the current price and shows how that path adapts when the market shifts from ranging to trending (via ADX).
---
Concept
1. Donchian position → direction
For each timeframe, the script measures where price sits inside its Donchian channel:
-1 = near channel low
0 = middle
+1 = near channel high
This Donchian position is multiplied by ATR to create a **price delta** (how far the forecast moves from current price).
2. Local behavior: trend vs mean-reversion around Donchian
The indicator treats the edges vs middle of the Donchian channel differently:
* By default, edges behave more “trend-like”, middle more “mean-reverting”.
* If you enable the reversed option, this logic flips (edges = mean-reverting, middle = trend-
like).
* This “local” behavior is controlled smoothly by the absolute Donchian position |pos| (not by hard zone switches).
3. Global ADX modulation (regime aware)
ADX is mapped from your chosen low → high thresholds into a signed factor in :
* ADX ≤ low → -1 (fully reversed behavior, more range/mean-reversion oriented)
* ADX ≥ high → +1 (fully normal behavior, more trend oriented)
* Values in between create a **smooth transition**.
* This global factor can:
* Keep the local behavior as is (trending regime),
* Flip it (range regime), or
* Neutralize it (indecisive regime).
4. Multi-timeframe aggregation (1x–12x chart timeframe)
* The script repeats the same logic across 12 horizons:
* 1x = chart timeframe
* 2x..12x = multiples of the chart timeframe (e.g., 5m → 10m, 15m, …; 1h → 2h, 3h, …).
* For each horizon it builds:
* Donchian position
* ATR-scaled delta (in price units)
* Locally + globally blended delta (after Donchian + ADX logic).
* These blended deltas are ATR-weighted and summed into a single bias in , which is then shown as Bias % in the on-chart table.
---
### What you see on the chart
* Forecast polyline
* Starting at the current close, the indicator draws a short chain of **up to 12 segments**:
* Segment 1: from current price → 1x projection
* Segment 2: 1x → 2x projection
* … up to 12x.
* Each segment is:
* Green when its blended delta is ≥ 0 (upward bias)
* Red when its blended delta is < 0 (downward bias)
* This is not future price, but a synthetic path showing how the Donchian/ATR/ADX model “expects” price to drift across multiple horizons.
* Bias table (top-center)
* `Bias: X.Y%`
* > 0% (green) → net upward bias across horizons
* < 0% (red) → net downward bias
* Magnitude (e.g., ±70–100%) ≈ strength of the directional skew.
* `ADX:` current ADX value (from your DMI settings).
* `ADXBlend:` the signed ADX factor in :
* +1 ≈ fully “trend-interpretation” of Donchian behavior
* 0 ≈ neutral / mixed regime
* -1 ≈ fully “reversed/mean-reversion interpretation”
---
Inputs & settings
Core Donchian / ATR
* Donchian Length – lookback for Donchian high/low on each horizon.
* Price Source – input series used for position inside the Donchian channel (default: close).
* ATR Length – ATR lookback for all horizons.
* ATR Multiplier – scales the size of each forecast step in price units (higher = longer segments / more aggressive forecast).
*Local behavior at high ADX
* Reversed local blend at high ADX?
* Off (default) – edges behave more trend-like, middle more mean-reverting.
* On – flips that logic (edges more mean-reverting, middle more trend-like).
* The actual effect is always modulated by the global ADX factor, so you can experiment with how the regime logic feels in different markets.
Global ADX blending
* DMI DI Length – period for the DI+ and DI- components.
* ADX Smoothing – smoothing length for ADX.
* ADX low (mean-rev zone) – below this level, the global factor pushes behavior toward reversal/range logic .
* ADX high (trend zone) – above this level, the global factor pushes behavior toward **trend logic**.
* Values between low and high create a smooth blend rather than a hard on/off switch.
---
How to use it (examples)
* Directional bias dashboard
* Use the Bias % as a compact summary of multi-horizon Donchian/ATR/ADX conditions:
* Consider only trades aligned with the sign of Bias (e.g., longs only when Bias > 0).
* Use the magnitude to filter for **strong vs weak** directional contexts.
* Regime-aware context
* Watch ADX and ADXBlend:
* High ADX & ADXBlend ≈ +1 → favor trend-continuation ideas.
* Low ADX & ADXBlend ≈ -1 → favor range/mean-reversion ideas.
* Around 0 → mixed/transition regimes; forecasts will be more muted.
* Visual sanity check for systems
* Overlay Donchian Forecast on your usual entries/exits to see:
* When your system trades **with** the multi-TF Donchian bias.
* When it trades **against** it (possible fade setups or no-trade zones).
This script does not generate entry or exit signals by itself. It is a contextual/forecast tool meant to sit on top of your own trading logic.
---
Notes
* Works on most symbols and timeframes; higher-timeframe multiples are built from the chart timeframe.
* The forecast line is a model-based projection, not a prediction or guarantee of future price.
* Always combine this with your own risk management, testing, and judgement. This is for educational and analytical purposes only and is not financial advice.

Bollinger Bands Delta Matrix Analytics [BDMA] Bollinger Bands Delta Matrix Analytics (BDMA) v7.0
Deep Kinetic Engine – 5x8 Volatility & Delta Decision Matrix
1. Introduction & Concept
Bollinger Bands Delta Matrix Analytics (BDMA) v7.0 is an analytical framework that merges:
- Spatial analysis via Bollinger Bands (%B location),
- with a 4-factor Deep Kinetic Engine based on:
• Total Volume
• Buy Volume
• Sell Volume
• Delta (Buy – Sell) Z-Scores
and converts them into an expanded 5×8 decision matrix that continuously tracks where price is trading and how the underlying orderflow is behaving.
BDMA is not a trading system or strategy. It does not generate entry/exit signals.
Instead, it provides a structured contextual map of volatility, volume, and delta so traders can:
- identify climactic extensions vs. fakeouts,
- distinguish strong initiative moves vs. passive absorption,
- and detect squeezes, traps, and liquidity voids with a unified visual dashboard.
2. Spatial Engine – Bollinger S-States (S1–S5)
The spatial dimension of BDMA comes from classic Bollinger Bands.
Price location is expressed as Percent B (%B) and mapped into 5 spatial states (S-States):
S1 – Hyper Extension (Above Upper Band)
Price has pushed beyond the upper Bollinger Band.
Often associated with parabolic or blow-off behavior, late-stage momentum, and elevated reversal risk.
S2 – Resistance Test (Upper Zone)
Price trades in the upper Bollinger region but remains inside the bands.
Represents a sustained test of resistance, typically within an established or emerging uptrend.
S3 – Neutral Zone (Middle)
Price hovers around the mid-band.
This is the mean reversion gravity field where the market often consolidates or transitions between regimes.
S4 – Support Test (Lower Zone)
Price trades in the lower Bollinger region but inside the bands.
Represents a sustained test of support within range or downtrend structures.
S5 – Hyper Drop (Below Lower Band)
Price extends below the lower Bollinger Band.
Often aligned with panic, forced liquidations, or capitulation-type behavior, with increased snap-back risk.
These 5 S-States define the vertical axis (rows) of the BDMA matrix.
3. Deep Kinetic Engine – 4-Factor Z-Score & D-States (D1–D8)
The Deep Kinetic Engine transforms raw volume and delta into standardized Z-Scores to measure how abnormal current activity is relative to its recent history.
For each bar:
- Raw Buy Volume is estimated from the candle’s position within its range
- Raw Sell Volume is complementary to buy volume
- Raw Delta = Buy Volume – Sell Volume
- Total Volume = Buy Volume + Sell Volume
These 4 series are then normalized using a unified Z-Score lookback to produce:
1. Z_Vol_Total – overall activity and liquidity intensity
2. Z_Vol_Buy – aggression from buyers (attack)
3. Z_Vol_Sell – aggression from sellers (defense or attack)
4. Z_Delta – net victory of one side over the other
Thresholds for Extreme, Significant, and Neutral Z-Score levels are fully configurable, allowing you to tune the sensitivity of the kinetic states.
Using Z_Vol_Total and Z_Delta (plus threshold logic), BDMA assigns one of 8 Deep Kinetic states (D-States):
D1 – Climax Buy
Extreme Total Volume + Extreme Positive Delta → Buying climax or blow-off behavior.
D2 – Strong Buy
High Volume + High Positive Delta → Confirmed bullish initiative activity.
D3 – Weak Buy / Fakeout
Low Volume + High Positive Delta → Bullish delta without commitment, low-liquidity breakout risk.
D4 – Absorption / Conflict
High Volume + Neutral Delta → Aggressive two-way trade, strong absorption, war zone behavior.
D5 – Neutral
Low Volume + Neutral Delta → Low-energy environment with low conviction.
D6 – Weak Sell / Fakeout
Low Volume + High Negative Delta → Bearish delta without commitment, low-liquidity breakdown risk.
D7 – Strong Sell
High Volume + High Negative Delta → Confirmed bearish initiative activity.
D8 – Capitulation
Extreme Volume + Extreme Negative Delta → Panic selling or capitulation regime.
These 8 D-States define the horizontal axis (columns) of the BDMA matrix.
4. The 5×8 BDMA Decision Matrix
The core of BDMA is a 5×8 matrix where:
- Rows (1–5) = Spatial S-States (S1…S5)
- Columns (1–8) = Kinetic D-States (D1…D8)
Each of the 40 possible combinations (SxDy) is pre-computed and mapped to:
- a Status or Regime Title (for example: Climax Breakout, Bear Trap Spring, Capitulation Breakdown),
- a Bias (Climactic Bull, Neutral, Strong Bear, Conflict or Reversal Risk, and similar labels),
- and a Strategic Signal or Consideration (for example: High reversal risk, Wait for confirmation, Low probability zone – avoid).
Internally, BDMA resolves all 40 regimes so the current state can be displayed on the dashboard without performance overhead.
5. Key Regime Families (How to Read the Matrix)
5.1. Breakouts and Breakdowns
Climax Breakout (Top-side)
Spatial S1 with Kinetic D1 or D2
Bias: Explosive or Extreme Bull
Signal:
- Strong or climactic upside extension with abnormal bullish orderflow.
- Trend continuation is possible, but reversal risk is extremely high after blow-off phases.
Low-Conviction Breakout (Fakeout Risk)
S1 with D3 (Weak Buy, low liquidity)
Bias: Weak Bull – Caution
Signal:
- Breakout not supported by volume.
- Elevated risk of failed auction or bull trap.
Capitulation Breakdown (Bottom-side)
Spatial S5 with Kinetic D8
Bias: Climactic Bear (panic)
Signal:
- Capitulation-type selling or forced liquidations.
- Trend can still proceed, but snap-back or violent short-covering risk is high.
Initiative Breakdown vs. Weak Breakdown
- Strong, high-volume breakdown typically corresponds to D7 (Strong Sell).
- Low-volume breakdown often corresponds to D6 (Weak Sell or Fakeout) with potential for failure.
5.2. Absorption, Traps and Springs
Absorption at Resistance (Top-side conflict)
S1 or S2 with D4 (Absorption or Conflict)
Bias: Conflict – Extreme Tension
Signal:
- Heavy two-way trade near resistance.
- Potential distribution or reversal if sellers begin to dominate.
Bull Trap or Failed Auction
Typically S1 with D6 (Weak Sell breakdown behavior after a top-side attempt)
Indicates a breakout attempt that fails and reverses, often after poor liquidity structure.
Absorption at Support and Bear Trap (Spring)
S4 or S5 with D4 or D3
Bias: Conflict or Weak Bear – Reversal Risk
Signal:
- Aggressive buying into lows (spring or shakeout behavior).
- Potential bear trap if price reclaims lost territory.
5.3. Trend Phases
Strong Uptrend Phases
Typically seen when S2–S3 combine with strong bullish kinetic behavior.
Bias: Strong or Extreme Bull
Signal:
- Pullbacks into S3 or S4 with supportive kinetic states often act as trend continuation zones.
Strong Downtrend Phases
Typically seen when S3–S4 combine with strong bearish kinetic behavior.
Bias: Strong or Extreme Bear
Signal:
- Rallies into resistance with strong bearish kinetic backing may act as continuation sell zones.
5.4. Neutral, Exhaustion and Squeeze
Exhaustion or Liquidity Void
S1 or S5 with D5 (Neutral kinetics)
Bias: Neutral or Exhaustion
Signal:
- Spatial extremes without kinetic confirmation.
- Often marks the end of a move, with poor follow-through.
Choppy, Low-Activity Range
S3 with D5
Bias: Neutral
Signal:
- Low volume, low conviction market.
- Typically a low-probability environment where standing aside can be logical.
Squeeze or High-Tension Zone
S3 with D4 or tightly clustered kinetic values
Bias: Conflict or High Tension
Signal:
- Hidden battle inside a volatility contraction.
- Often precedes large directionally-biased moves.
6. Dashboard Layout & Reading Guide
When Show Dashboard is enabled, BDMA displays:
1. Title and Status Line
Name of the current regime (for example: Climax Breakout, Bear Trap Spring, Mean Reversion).
2. Bias Line
Plain-language summary of directional context such as Climactic Bull, Strong Bear, Neutral, or Conflict and Reversal Risk.
3. Signal or Strategic Notes
Concise guidance focused on risk and context, not entries. For example:
- High reversal risk – aggressive traders only
- Wait for confirmation (break or rejection)
- Low probability zone – avoid taking new positions
4. Kinetic Profile (4-Factor Z-Score)
Shows the current Z-Scores for Total Volume (Activity), Buy Volume (Attack), Sell Volume (Defense), and Delta (Net Result).
5. Matrix Heatmap (5×8)
Visual representation of S-State vs. D-State with color coding:
- Bullish clusters in a green spectrum
- Bearish clusters in a red spectrum
- Conflict or exhaustion zones in yellow, amber, or neutral tones
The dashboard can be repositioned (top right, middle right, or bottom right) and its size can be adjusted (Tiny, Small, Normal, or Large) to fit different layouts.
7. Inputs & Customization
7.1. Core Parameters (Bollinger and Z-Score)
- Bollinger Length and Standard Deviation define the spatial engine.
- Z-Score Lookback (All Factors) defines how many bars are used to normalize volume and delta.
7.2. Deep Kinetic Thresholds
- Extreme Threshold defines what is considered climactic (D1 or D8).
- Significant Threshold distinguishes strong initiative vs. weak or fakeout behavior.
- Neutral Threshold is the band within which delta is treated as neutral.
These thresholds allow you to tune the sensitivity of the kinetic classification to fit different timeframes or instruments.
7.3. Calculation Method (Volume Delta)
Geometry (Approx)
- Fast, non-repainting approach based on candle geometry.
- Suitable for most users and real-time decision-making.
Intrabar (Precise)
- Uses lower-timeframe data for more precise volume delta estimation.
- Intrabar mode can repaint and requires compatible data and plan support on the platform.
- Best used for post-analysis or research, not blind automation.
7.4. Visuals and Interface
- Toggle Bollinger Bands visibility on or off.
- Switch between Dark and Light color themes.
- Configure dashboard visibility, matrix heatmap display, position, and size.
8. Multi-Language Semantic Engine (Asia and Middle East Focus)
BDMA v7.0 includes a fully integrated multi-language layer, targeting a wide geographic user base.
Supported Languages:
English, Türkçe, Русский, 简体中文, हिन्दी, العربية, فارسی, עברית
All dashboard labels, regime titles, bias descriptions, and signal texts are dynamically translated via an internal dictionary, while semantic meaning is kept consistent across languages.
This makes BDMA suitable for multi-language communities, study groups, and educational content across different regions.
However, due to the heavy computational load of the Deep Kinetic Engine and TradingView’s strict Pine Script execution limits, it was not possible to expand support to additional languages. Adding more translation layers would significantly increase memory usage and exceed runtime constraints. For this reason, the current language set represents the maximum optimized configuration achievable without compromising performance or stability.
9. Practical Usage Notes
BDMA is most powerful when used as a contextual overlay on top of market structure (HH, HL, LH, LL), higher-timeframe trend, key levels, and your own execution framework.
Recommended usage:
- Identify the current regime (Status and Bias).
- Check whether price location (S-State) and kinetic behavior (D-State) agree with your trade idea.
- Be especially cautious in climactic and absorption or conflict zones, where volatility and risk can be elevated.
Avoid treating BDMA as an automatic green equals buy, red equals sell tool.
The real edge comes from understanding where you are in the volatility or kinetic spectrum, not from forcing signals out of the matrix.
10. Limitations & Important Warnings
BDMA does not predict the future.
It organizes current and recent data into a structured context.
Volume data quality depends on the underlying symbol, exchange, and broker feed.
Forex, crypto, indices, and stocks may all behave differently.
Intrabar mode can repaint and is sensitive to lower-timeframe data availability and your plan type.
Use it with extra caution and primarily for research.
No indicator can remove the need for clear trading rules, disciplined risk management, and psychological control.
11. Disclaimer
This script is provided strictly for educational and analytical purposes.
It is not a trading system, signal service, financial product, or investment advice.
Nothing in this indicator or its description should be interpreted as a recommendation to buy or sell any asset.
Past behavior of any indicator or market pattern does not guarantee future results.
Trading and investing involve significant risk, including the risk of losing more than your initial capital in leveraged products.
You are solely responsible for your own decisions, risk management, and results.
By using this script, you acknowledge that you understand these risks and agree that the author or authors and publisher or publishers are not liable for any loss or damage arising from its use.

channel no warnings - Indicators w/EMA CloudEMA cloud showing up and down trend for any stock and any time interval


Trend Follow Line Point📌 Trend Follow Line Point
The Trend Follow Line Point indicator removes the confusing, repainting-based swing connections commonly found in traditional swing tools.
It maintains consistent swing-point calculation, keeps structural swing lines intact even when trend lines are broken, and integrates market structure + trend + volatility + volume into one intuitive, visual indicator.
This tool is designed for:
Trend Following
Swing Structure Analysis
Volatility-Based Entry & Exit
Market Strength Evaluation
📊 Component Explanation
🔹 1. Swing High / Swing Low Detection
Based on the user-defined sensitivity (swgLen):
A Swing High forms when the current high exceeds the previous swgLen highs.
A Swing Low forms when the current low falls below the previous swgLen lows.
🔹 2. Swing-Based Structure Lines
Connect Swing Highs → Structural visualization
Connect Swing Lows → Structural visualization
These lines reveal the underlying market structure without repainting or disappearing unexpectedly.
🔹 3. Dynamic ATR + Volume Weighting
ATR values combined with the volume ratio (vol / volMA) create a dynamic volatility channel that reflects real-time market pressure.
🔹 4. Enhanced SuperTrend Calculation
Uses ATR-based stability to produce more realistic and smoother trend lines, reducing noise and improving signal clarity.
🔹 5. Trend Color Mapping
Up Trend → User-selected color
Down Trend → User-selected color
Visual trend direction and strength can be identified immediately.
🧭 How to Use
When Swing Highs/Lows are detected, structure lines are automatically drawn between previous swings.
Use these lines to evaluate support/resistance breaks and overall structural direction.
Manage risk with volatility guidance:
Higher ATR (volume-weighted) → wider trend spacing → increased risk
Lower ATR → tighter spacing → reduced risk
This helps with position sizing, entry timing, and exit decisions.
+

Price Band LevelsThis indicator allows you to specify a base price. Once set, it automatically draws three price bands above the base and three bands below it, giving you a structured visual range around the selected level.

Traders edge indicator1Trend Confirmation: The primary trend is determined by the alignment of the long-term EMAs (e.g., 100 and 200). The trade direction should align with this overall trend.
Entry/Exit Signals: Shorter EMAs (e.g., 9 or 20) are used for high-probability entry points. Pullbacks to these faster EMAs within the context of a strong trend are common entry signals.
Dynamic Support and Resistance: The various EMAs and the VWAP line often act as magnetic levels where price tends to pause, reverse, or consolidate.
VWAP as Mean Reversion Target: In a volatile market, if the price moves significantly away from the VWAP, it may be considered "overextended," and a mean-reversion move back towards the VWAP is often anticipated.

Humontre - One signal - One direction - No noiseClean trend-following band
Delivers one high-conviction entry per trend change
Zero repaint · Minimal lag
Best performance observed on 4H and higher timeframes
Works on all markets (crypto · forex · indices)
Use at own risk.

Focus On Work time (Tehran)If you only want to analyze the market during specific working hours and ignore the rest, this indicator is for you. It lets you hide or highlight non-working times on your chart, so you can focus only on the sessions that matter to you.
Just set your start time and end time for the work session.
By default, the time is set to UTC+3:30 (Tehran time), but you can change it to any timezone you like.

Harami Reversal Alerts BB Touch (Strict First Candle)Harami Reversal Alerts BB Touch (Strict First Candle)
Harami Reversal Alerts BB Touch (Strict First Candle)Harami Reversal Alerts BB Touch (Strict First Candle)Harami Reversal Alerts BB Touch (Strict First Candle)Harami Reversal Alerts BB Touch (Strict First Candle)Harami Reversal Alerts BB Touch (Strict First Candle)

Physics of PricePhysics of Price is a non-repainting kinematic reversal and volatility overlay. It models price as a physical object with position, velocity, and acceleration, then builds adaptive bands and a short-term predictive “ghost cone” to highlight where reversals are statistically more likely.
CONCEPT
Instead of using only moving averages, the core engine tracks a smoothed price (position), trend speed (velocity), and change in trend speed (acceleration). Standard deviation of the model error defines probabilistic bands around this kinematic centerline. When price stretches too far away and snaps back, the move is treated as a potential exhaustion event.
CORE COMPONENTS
– Kinematic centerline (Alpha–Beta–Gamma style filter) that bends with trend instead of lagging like a simple MA.
– Inner and outer bands based on the standard deviation of residuals between price and the kinematic model.
– Regime filter using R² and band width to avoid signals in chaotic or ultra-wide regimes.
– Optional RSI “hook” filter that waits for momentum to actually turn instead of buying into a falling RSI.
– Optional divergence add-on using kinematic velocity, so a marginal new price extreme with weaker velocity is recognized as a possible exhaustion pattern.
REVERSAL EVENTS AND SCORING
Raw events are detected when price wicks through the outer band and closes back inside (band hit with snap). These are plotted as diamonds and treated as candidates, not automatic trades.
Each event is then scored from 0 to 100 using several factors:
– How far price overshot the outer band.
– How strongly it snapped back inside.
– Whether an RSI hook is present (if enabled).
– Regime quality from the kinematic model.
– Basic kinematic safety to avoid the most aggressive “knife-catch” situations.
– Optional divergence bonus when price makes a new extreme but velocity does not.
Only events with a score above the chosen threshold become confirmed signals (triangles labeled PHYSICS REV).
GHOST CONE (PREDICTIVE BAND)
On the latest bar, the script projects a short-horizon “ghost cone” into the future using position, velocity, and a damped acceleration term. This creates a curved predictive band that visualizes a plausible short-term path and range, rather than a simple straight line. The cone is meant as context for trade management and risk, not as a hard target.
FILTERS AND OPTIONS
– Regime filter (R² and band width) can be tightened or relaxed depending on how selective you want the engine to be.
– RSI and volume filters can be toggled on for extra confirmation or off to see the raw kinematic behavior.
– An optional trend baseline (EMA) can be enabled to bias or restrict reversals relative to a higher-timeframe trend.
– Dynamic cooldown scales with volatility so the script does not spam signals in fast environments.
HOW TO USE
Physics of Price is primarily a mean-reversion and exhaustion tool. It works best in markets that respect ranges, swings, and two-sided order flow. Confirmed PHYSICS REV signals near the outer bands, with decent model health and a clean RSI hook, are the core use case. The bands and ghost cone can also be used as a context overlay alongside your own entries, exits, and risk framework.
This is an indicator, not a complete trading system. It does not use lookahead or higher-timeframe security calls and is designed for “once per bar close” alerts. Always combine it with your own risk management and confluence.

Keltner Hull Suite [QuantAlgo]🟢 Overview
The Keltner Hull Suite combines Hull Moving Average positioning with double-smoothed True Range banding to identify trend regimes and filter market noise. The indicator establishes upper and lower volatility bounds around the Hull MA, with the trend line conditionally updating only when price violates these boundaries. This mechanism distinguishes between genuine directional shifts and temporary price fluctuations, providing traders and investors with a systematic framework for trend identification that adapts to changing volatility conditions across multiple timeframes and asset classes.
🟢 How It Works
The calculation foundation begins with the Hull Moving Average, a weighted moving average designed to minimize lag while maintaining smoothness:
hullMA = ta.hma(priceSource, hullPeriod)
The indicator then calculates true range and applies dual exponential smoothing to create a volatility measure that responds more quickly to volatility changes than traditional ATR implementations while maintaining stability through the double-smoothing process:
tr = ta.tr(true)
smoothTR = ta.ema(tr, keltnerPeriod)
doubleSmooth = ta.ema(smoothTR, keltnerPeriod)
deviation = doubleSmooth * keltnerMultiplier
Dynamic support and resistance boundaries are constructed by applying the multiplier-scaled volatility deviation to the Hull MA, creating upper and lower bounds that expand during volatile periods and contract during consolidation:
upperBound = hullMA + deviation
lowerBound = hullMA - deviation
The trend line employs a conditional update mechanism that prevents premature trend reversals. The system maintains the current trend line until price action violates the respective boundary, at which point the trend line snaps to the violated bound:
if upperBound < trendLine
trendLine := upperBound
if lowerBound > trendLine
trendLine := lowerBound
Directional bias determination compares the current trend line value against its previous value, establishing bullish conditions when rising and bearish conditions when falling. Signal generation occurs on state transitions, triggering alerts when the trend state shifts from neutral or opposite direction:
trendUp = trendLine > trendLine
trendDown = trendLine < trendLine
longSignal = trendState == 1 and trendState != 1
shortSignal = trendState == -1 and trendState != -1
The visualization layer creates a trend band by plotting both the current trend line and a two-bar shifted version, with the area between them filled to create a visual channel that reinforces directional conviction.
🟢 How to Use This Indicator
▶ Long and Short Signals: The indicator generates long/buy signals when the trend state transitions to bullish (trend line begins rising) and short/sell signals when transitioning to bearish (trend line begins falling). These state changes represent structural shifts in momentum where price has broken through the adaptive volatility bands, confirming directional commitment.
▶ Trend Band Dynamics: The spacing between the main trend line and its shifted counterpart creates a visual band whose width reflects trend strength and momentum consistency. Expanding bands indicate accelerating directional movement and strong trend persistence, while contracting or flattening bands suggest decelerating momentum, potential trend exhaustion, or impending consolidation. Monitoring band width provides early warning of regime transitions from trending to range-bound conditions.
▶ Preconfigured Presets: Three optimized parameter sets accommodate different trading styles and timeframes. Default (14, 20, 2.0) provides balanced trend identification suitable for daily charts and swing trading, Fast Response (10, 14, 1.5) delivers aggressive signal generation optimized for intraday scalping and momentum trading on 1-15 minute timeframes, while Smooth Trend (18, 30, 2.5) offers conservative trend confirmation ideal for position trading on 4-hour to daily charts with enhanced noise filtration.
▶ Built-in Alerts: Three alert conditions enable automated monitoring - Bullish Trend Signal triggers on long setup confirmation, Bearish Trend Signal activates on short setup confirmation, and Trend Change alerts on any directional transition. These notifications allow you to respond to regime shifts without continuous chart monitoring.
▶ Color Customization: Five visual themes (Classic, Aqua, Cosmic, Ember, Neon, plus Custom) accommodate different chart backgrounds and display preferences, ensuring optimal contrast and visual clarity across trading environments.

NIFTY Weekly Option Seller DirectionalHere’s a straight description you can paste into the TradingView “Description” box and tweak if needed:
---
### NIFTY Weekly Option Seller – Regime + Score + Management (Single TF)
This indicator is built for **weekly option sellers** (primarily NIFTY) who want a **structured regime + scoring framework** to decide:
* Whether to trade **Iron Condor (IC)**, **Put Credit Spread (PCS)** or **Call Credit Spread (CCS)**
* How strong that regime is on the current timeframe (score 0–5)
* When to **DEFEND** existing positions and when to **HARVEST** profits
> **Note:** This is a **single timeframe** tool. The original system uses it on **4H and 1D separately**, then combines scores manually (e.g., using `min(4H, 1D)` for conviction and lot sizing).
---
## Core logic
The script classifies the market into 3 regimes:
* **IC (Iron Condor)** – range/mean-reversion conditions
* **PCS (Put Credit Spread)** – bullish/trend-up conditions
* **CCS (Call Credit Spread)** – bearish/trend-down conditions
For each regime, it builds a **0–5 score** using:
* **EMA stack (8/13/34)** – trend structure
* **ADX (custom DMI-based)** – trend strength vs range
* **Previous-day CPR** – in CPR vs break above/below
* **VWAP (session)** – near/far value
* **Camarilla H3/L3** – for IC context
* **RSI (14)** – used as a **brake**, not a primary signal
* **Daily trend / Daily ADX** – used as **hard gates**, not double-counted as extra points
Then:
* Scores for PCS / CCS / IC are **cross-penalised** (they pull each other down if conflicting)
* Final scores are **smoothed** (current + previous bar) to avoid jumpy signals
The **background colour** shows the current regime and conviction:
* Blue = IC
* Green = PCS
* Red = CCS
* Stronger tint = higher regime score
---
## Scoring details (per timeframe)
**PCS (uptrend, bullish credit spreads)**
* +2 if EMA(8) > EMA(13) > EMA(34)
* +1 if ADX > ADX_TREND
* +1 if close > CPR High
* +1 if close > VWAP
* RSI brake:
* If RSI < 50 → PCS capped at 2
* If RSI > 75 → PCS capped at 3
* Daily gating:
* If daily EMA stack is **not** uptrend → PCS capped at 2
**CCS (downtrend, bearish credit spreads)**
* +2 if EMA(8) < EMA(13) < EMA(34)
* +1 if ADX > ADX_TREND
* +1 if close < CPR Low
* +1 if close < VWAP
* RSI brake:
* If RSI > 50 → CCS capped at 2
* If RSI < 25 → CCS capped at 3
* Daily gating:
* If daily EMA stack is **not** downtrend → CCS capped at 2
**IC (range / mean-reversion)**
* +2 if ADX < ADX_RANGE (low trend)
* +1 if close inside CPR
* +1 if near VWAP
* +0.5 if inside Camarilla H3–L3
* +1 if daily ADX < ADX_RANGE (daily also range-like)
* +0.5 if RSI between 45 and 55 (classic balance zone)
* Daily gating:
* If daily ADX ≥ ADX_TREND → IC capped at 2 (no “strong IC” in strong trends)
**Cross-penalty & smoothing**
* Each regime’s raw score is reduced by **0.5 × max(other two scores)**
* Final IC / PCS / CCS scores are then **smoothed** with previous bar
* Scores are always clipped to ** **
---
## Regime selection
* If one regime has the highest score → that regime is selected.
* If there is a tie or close scores:
* When ADX is high, trend regimes (PCS/CCS) are preferred in the direction of the EMA stack.
* When ADX is low, IC is preferred.
The selected regime’s score is used for:
* Background colour intensity
* Minimum score gate for alerts
* Display in the info panel
---
## DEFEND / HARVEST / REGIME alerts
The script also defines **management signals** using ATR-based buffers and Camarilla breaks:
* **DEFEND**
* Price moving too close to short strikes (PCS/CCS/IC) relative to ATR, or
* Trend breaks through Camarilla with ADX strong
→ Suggests rolling away / widening / converting to reduce risk.
* **HARVEST**
* Price has moved far enough from your short strikes (in ATR multiples) and market is still range-compatible
→ Suggests booking profits / rolling closer / reducing risk.
* **REGIME CHANGED**
* Regime flips (IC ↔ PCS/CCS) with cooldown and minimum score gate
→ Suggests switching playbook (range vs trend) for new entries.
Each of these has a plotshape label plus an `alertcondition()` for TradingView alerts.
---
## UI / Panel
The **top-right panel** (optional) shows:
* Strategy + final regime score (IC / PCS / CCS, x/5)
* ADX / RSI values
* CPR status (Narrow / Normal / Wide + %)
* EMA Stack (Up / Down / Mixed) and EMA tightness
* VWAP proximity (Near / Away)
* Final **IC / PCS / CCS** scores (for this timeframe)
* H3/L3, H4/L4, CPR Low/High and VWAP levels (rounded)
These values are meant to be **read quickly at the decision time** (e.g. near the close of the 4H bar or daily bar).
---
## Intended workflow
1. Run the script on **4H** and **1D** charts separately.
2. For each timeframe, read the panel’s **IC / PCS / CCS scores** and regime.
3. Decide:
* Final regime (IC vs PCS vs CCS)
* Combined score (e.g. `AlignScore = min(Score_4H, Score_1D)`)
4. Map that combined score to **your own lot-size buckets** and trade rules.
5. During the life of the position, use **DEFEND / HARVEST / REGIME** alerts to adjust.
The script does **not** auto-calculate lot size or P&L. It focuses on giving a structured, consistent **market regime + strength + levels + management** layer for weekly option selling.
---
## Disclaimer
This is a discretionary **decision-support tool**, not a guarantee of profit or a replacement for risk management.
No performance is implied or promised. Always size positions and manage risk according to your own capital, rules, and regulations.

Higher Timeframe MA High Low BandsHigher Timeframe Customer MA High Low Bands. There are 3 different Moving Average Parameters Available. Indicator will plot 3 lines of MA Length With Source of High, Close and Low. User can change relevant MA parameters / Show or Hide MA.
Happy Trading

DH EMA 28/72/200 Unified Ribbon (Scaled HTF)Unified EMA Ribbon (28/72/200)
This indicator merges two popular EMA systems — 21/55/200 and 34/89/200 — into a single, smoother trend-tracking ribbon.
Each pair of EMAs is averaged to create:
EMA 28 (average of 21 & 34)
EMA 72 (average of 55 & 89)
EMA 200 retained as long-term trend filter
The unified ribbon reduces noise, improves trend clarity, and provides clean pullback zones for high-probability entries, especially on the H1 timeframe.

My script//@version=6
indicator("ISIN demo")
// Define inputs for two symbols to compare.
string symbol1Input = input.symbol("NASDAQ:AAPL", "Symbol 1")
string symbol2Input = input.symbol("GETTEX:APC", "Symbol 2")
if barstate.islastconfirmedhistory
// Retrieve ISIN strings for `symbol1Input` and `symbol2Input`.
var string isin1 = request.security(symbol1Input, "", syminfo.isin)
var string isin2 = request.security(symbol2Input, "", syminfo.isin)
// Log the retrieved ISIN codes.
log.info("Symbol 1 ISIN: " + isin1)
log.info("Symbol 2 ISIN: " + isin2)
// Log an error message if one of the symbols does not have ISIN information.
if isin1 == "" or isin2 == ""
log.error("ISIN information is not available for both symbols.")
// If both symbols do have ISIN information, log a message to confirm whether both refer to the same security.
else if isin1 == isin2
log.info("Both symbols refer to the same security.")
else
log.info("The two symbols refer to different securities.")
