CCI Low/High DivergencesThis CCI Divergences indicator uses the candle low values to find bullish divergences and candle high values to find bearish divergences.
انفراج سعري

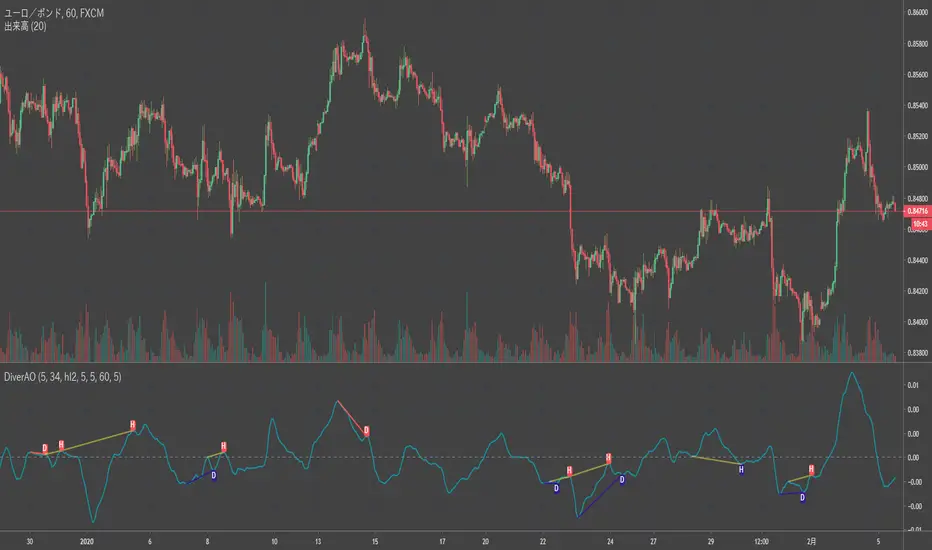
Divergence Stoch RSI[mado]Divergence screener for Stoch RSI
Regular Bullish: "D" navy label
Hidden Bullish: "H" navy label
Regular Bearish: "D" red label
Hidden Bearish: "H" red label

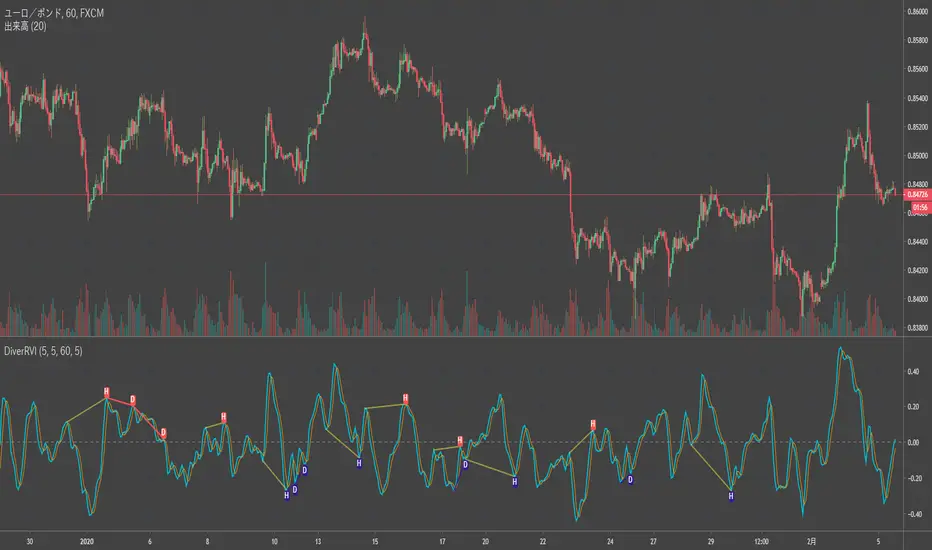
Divergence RVI[mado]Divergence screener for RVI
Regular Bullish: "D" navy label
Hidden Bullish: "H" navy label
Regular Bearish: "D" red label
Hidden Bearish: "H" red label
Divergence OBV RSI[mado]Divergence screener for OBV RSI
Regular Bullish: "D" navy label
Hidden Bullish: "H" navy label
Regular Bearish: "D" red label
Hidden Bearish: "H" red label

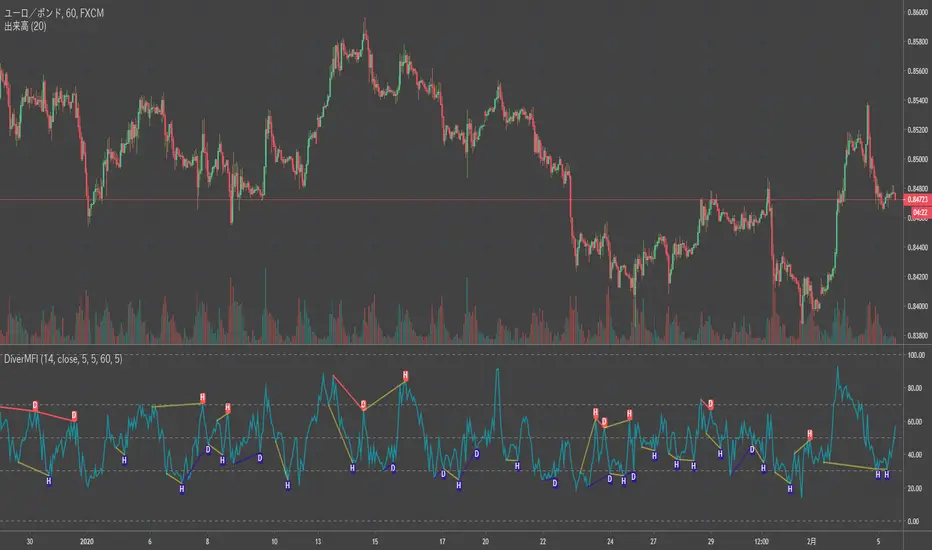
Divergence MFI[mado]Divergence screener for MFI
Regular Bullish: "D" navy label
Hidden Bullish: "H" navy label
Regular Bearish: "D" red label
Hidden Bearish: "H" red label
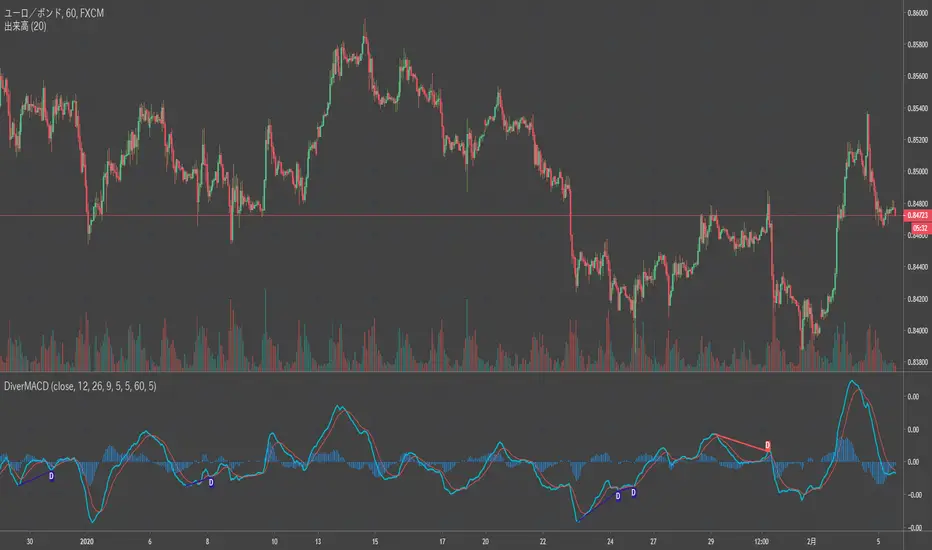
Divergence MACD [mado]Divergence screener for MACD
Regular Bullish: "D" navy label
Hidden Bullish: "H" navy label
Regular Bearish: "D" red label
Hidden Bearish: "H" red label
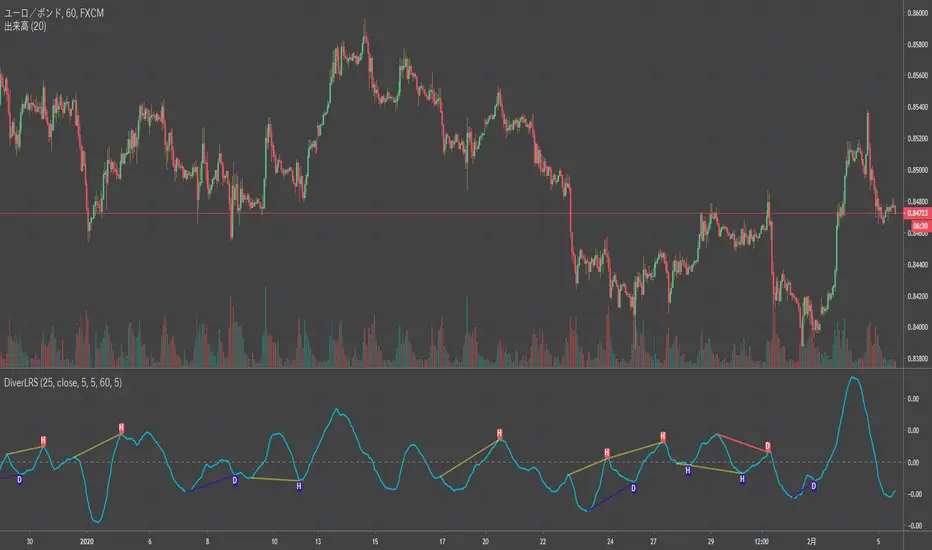
Divergence LinerRegressionSlope[mado]Divergence screener for LinerRegressionSlope
Regular Bullish: "D" navy label
Hidden Bullish: "H" navy label
Regular Bearish: "D" red label
Hidden Bearish: "H" red label
Divergence KlingerVolumeOscillator [mado]Divergence screener for KVO
Regular Bullish: "D" navy label
Hidden Bullish: "H" navy label
Regular Bearish: "D" red label
Hidden Bearish: "H" red label

Divergence CCI [mado]Divergence screener for CCI
Regular Bullish: "D" navy label
Hidden Bullish: "H" navy label
Regular Bearish: "D" red label
Hidden Bearish: "H" red label

Divergence Awesome Oscillator [mado]Divergence screener for Awesome Oscillator
Regular Bullish: "D" navy label
Hidden Bullish: "H" navy label
Regular Bearish: "D" red label
Hidden Bearish: "H" red label
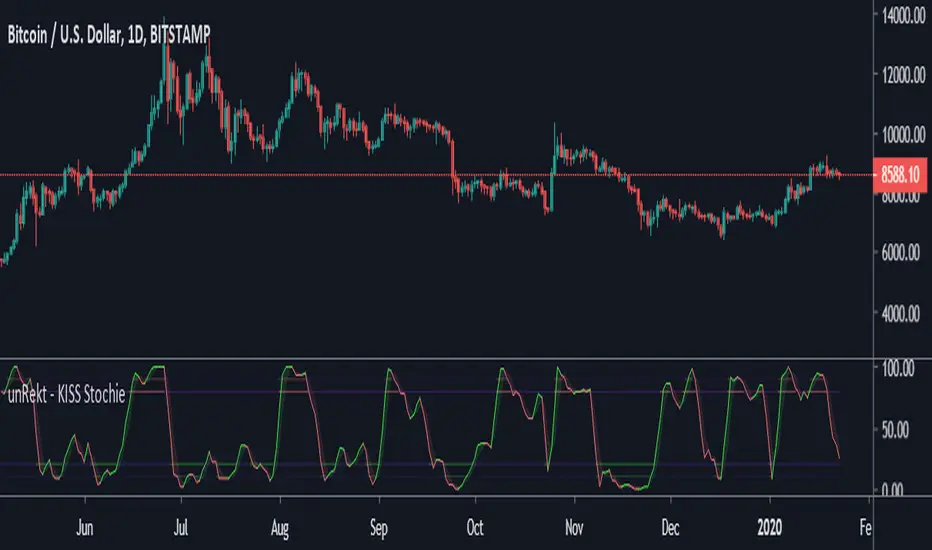
Stochastic RSI DivergencesAdapted from TradingView's RSI Divergences to instead use Stochastic RSI as the oscillator.

inwCoin Sto RSI Bullish/Bearish Divergence StrategyinwCoin Stochastic RSI Bullish / Bearish Divergence Strategy
This strategy is an alternated version of inwCoin RSI Bull/Bear div Strategy.
Because I want to know if the popular "STO RSI Divergence" Strategy really work in real trade?
The good thing about Sto RSI that it can provide us with more entry data for both long and short.
Because sometime RSI will never go to OB or OS zone again..
But sto will keep swinging between OB and OS zone.
Entry Condition
=============
BUY = Smooth K is higher low + price is lower low
SELL = Smooth K is lower high + price is higher high
Other Parameters
===============
- Use stop loss + stop loss %
- Data source for high/low price check
- Lookback period for divergence
Conclusion
==========
This strategy is working great for short entry when market is in sideway down.
Like in 1/7/2019 - 1/1/2020
or 1/1/2018-1/1/2019
But your portfolio will go kaboom if you short in the uptrend....
Also, this is not the good strategy for trend following + long position
But it's great addition if you want to pyramid your position in uptrend.
or looking for good spot to entry long if you miss the uptrend bus.

[KICK] Smart OBVCD DivergencesThis indicator is part of a pair of indicators that make it easier to spot divergences in On Balance Volume , but make the calculations using a unique method. THIS ONE IS IN THE UPPER (PRICE ACTION) PANE OF THE SAMPLE CHART.
Volume is segmented into buy or sell volume by analyzing smaller timeframes (down to 1 minute)
The sell vs. buy volume is calculated as a running total (as per normal OBV calculations)
The Convergence/Divergence of the OBV Buy and Sell volumes are calculated and smoothed with 3rd generation averaging methods
The Smart OBVCD indicator (THE RELATED INDICATOR) visualizes the above calculation on a histogram to make it easier to see the values and how they relate to the price action.
The Smart OBVCD Divergence indicator (THIS ONE) plots Regular and Hidden Bullish and Bearish divergence on higher timeframes based on the calculations and also provides early “warnings” for unconfirmed divergences forming (note: these are unconfirmed because the higher high or lower low have now yet been confirmed on the higher timeframe).
Use the link below to watch a tutorial video, request a trial, or purchase for access.

Better Stochastic RSI to find DivergencesThis indicator is a modified version of a stochastic RSI oscillator. I want to share this because it is really good for analysis of divergence between price action and the oscillator. You can also use it to trade overbought and oversold conditions.
To find out more what a divergences is when we talk about trading. Take a look at this: medium.com

Icahns RSI DivergenceThis is an optimized version of a popular RSI Divergence Detector with a bar color scheme based on the RSI's direction
RSI Divergence is a potent tool in identifying shifts in market momentum or trend reversals. A RSI momentum divergence occurs when there's a disagreement between the direction of the price and the RSI . For example, in an uptrend, a divergence occurs when price makes a higher high, but the indicator makes a lower low (i.e. Standard Bearish Divergence).
This indicator confirms the divergence on the 2nd candle close after the divergence is printed.
I've found that RSI div signals a shift in momentum the best on the 1H and 4H time interval.
______________________________________________________
How to read the Indicator:
R = Regular
H = Hidden
Green divergences are bullish
Red Divergences are bearish
The candle colors are based on the current RSI value.
Light Blue: If RSI is above 70
Pink: If the RSI is below 30
Green: If the RSI is above 50 and below 70
Red: If the RSI is below 50 and above 30

Double MA CCI"What is the Commodity Channel Index (CCI)?
Developed by Donald Lambert, the Commodity Channel Index (CCI) is a momentum-based oscillator used to help determine when an investment vehicle is reaching a condition of being overbought or oversold. It is also used to assess price trend direction and strength. This information allows traders to determine if they want to enter or exit a trade, refrain from taking a trade, or add to an existing position. In this way, the indicator can be used to provide trade signals when it acts in a certain way.
KEY TAKEAWAYS
• The CCI measures the difference between the current price and the historical average price.
• When the CCI is above zero it indicates the price is above the historic average. When CCI is below zero, the price is below the hsitoric average.
• High readings of 100 or above, for example, indicate the price is well above the historic average and the trend has been strong to the upside.
• Low readings below -100, for example, indicate the price is well below the historic average and the trend has been strong to the downside.
• Going from negative or near-zero readings to +100 can be used as a signal to watch for an emerging uptrend.
• Going from positive or near-zero readings to -100 may indicate an emerging downtrend.
• CCI is an unbounded indicator meaning it can go higher or lower indefinitely. For this reason, overbought and oversold levels are typically determined for each individual asset by looking at historical extreme CCI levels where the price reversed from." ----> 1
SOURCE
1: (SINCE IM NOT A "PRO" MEMBER I C'ANT POST THE SOUCRE URL..., webpage consulted at : 8:50 GMT -5 ; the 2020-01-18)
I- Added a 2nd MA length and changed the default values of the source type and switched the SMA to a MA.
II- In process to add analytic MACD histogram correlation and if possible, ploting a relative histogram between the CCI upper and lower band.
P.S.:
Don't set your moving averages lengths to far from each other... This could result in fewer convergence and divergence, also in fewer crossing MA's.
Have a good year 2020 !!
//----CODER----//
R.V.

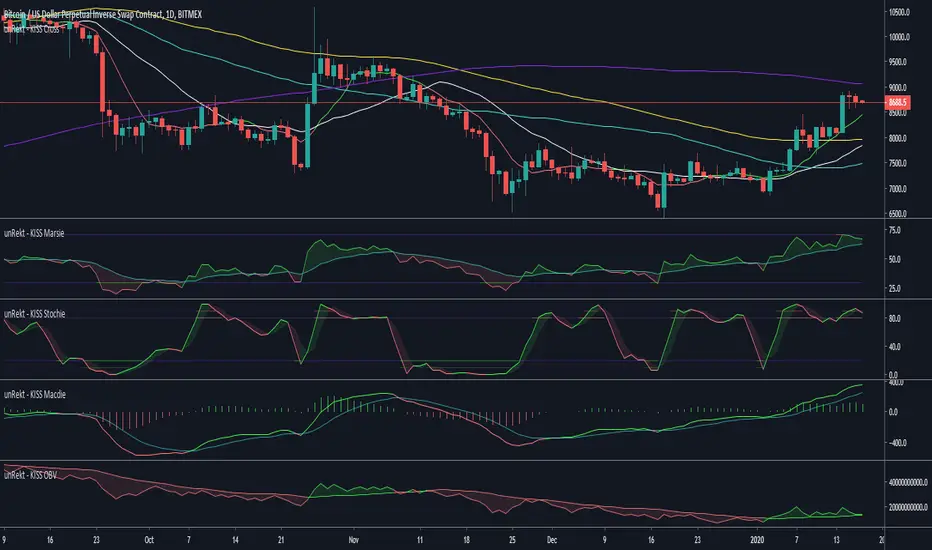
unRekt - KISS OBVOBV is the 'On Balance Volume' indicator and is part of the 'keeping it simple' series that have a similar color scheme. the OBV measures buying and selling pressure as a cumulative indicator, adding volume on up days and subtracting it on down days. The OBV can show divergences or confirm trend.
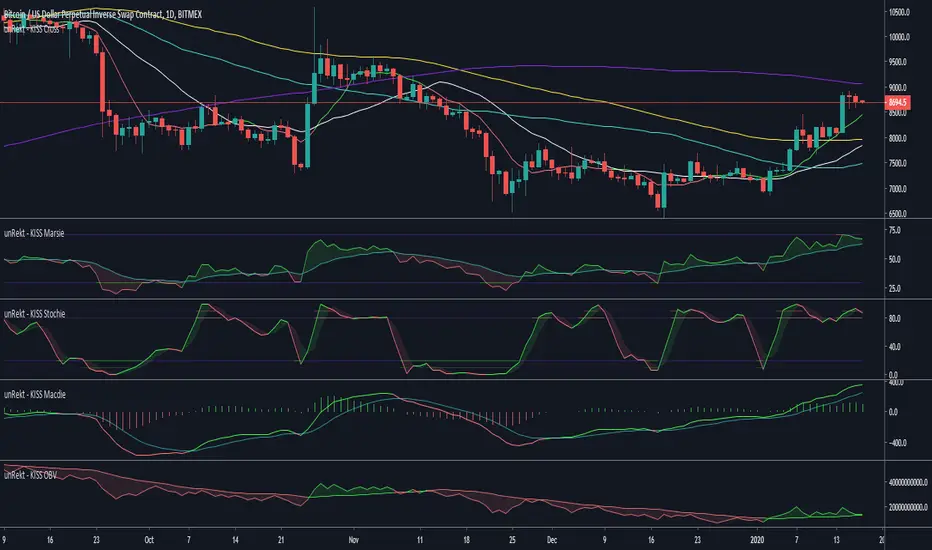
unRekt - KISS MacdieMacdie is the MACD 'Moving Average Convergence Divergence' indicator and is part of the 'keeping it simple' series that have a similar color scheme. MACD is based on the difference between two moving averages calculated for different periods, typically 12 and 26. The MACD can show trend and strength of an asset while also showing Divergences.

unRekt - KISS StochieStochie is the StochRSI indicator and is part of the ''keeping it simple' series that have a similar color scheme. The Stochastic RSI technical indicator applies the Stochastic Oscillator to values of the Relative Strength Index (RSI). The indicator thus produces two main plots FullK and FullD oscillating between oversold and overbought levels. The StochRSI can also be used to detect divergence and trend.
unRekt - KISS MarsieMarsie is an EMA-RSI indicator and part of the 'keeping it simple' series that have a similar color scheme. The RSI 'Relative Strength Index' is a momentum oscillator, measuring the velocity and magnitude of directional price movements. it is measured from 0 - 100 with 30 and 70 being low "oversold" and high "overbought" conditions. It is also commonly used to determine bullish or bearish divergences.
The EMA aspect is the 'Exponential Moving Average' which has had the RSI calculation added to it and acts a signal line when the RSI crosses it for buy and sell opportunities.
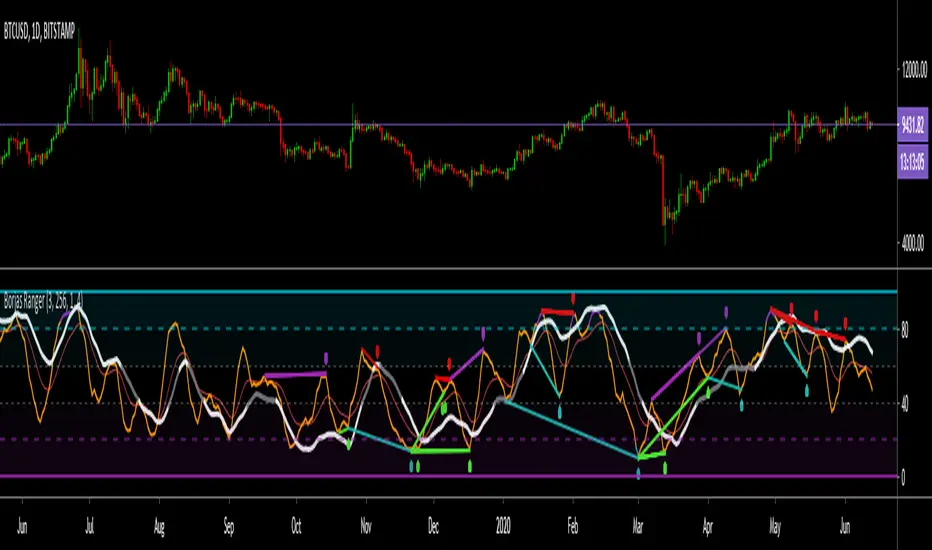
Borjas Tarh RangerBorjas Tarh Ranger
This indicator has a Light ( Low TF ) and a Heavy ( High TF ) lines which are based on Stochastic Calculations.
Best used for Ranging price action .
Light > 80 => Purple Color
Light < 20 => Aqua Color
The Heavy can be Support or Resistance for the Light. Also, you could spot Divergences on both of them.
Besides, the EMA can be used for Support and Resistance as well but the Heavy has more weight than the EMA .
© mrhashem
© Borjas Tarh Company
Borjas Tarh TrenderBorjas Tarh Trender
This indicator has a Light ( Low TF ) and a Heavy ( High TF ) lines which are based on RSI Calculations.
Best used for Trending Moves .
Light > 80 => Purple Color
Light < 20 => Aqua Color
The Heavy can be Support or Resistance for the Light. Also, you could spot Divergences on both of them.
Besides, the EMA can be used for Support and Resistance as well but the Heavy has more weight than the EMA .
© mrhashem
© Borjas Tarh Company

[fikira] Divergences (RSI)This script can be used with candlesticks, accompanied with " RSI + Divergences"
The calculation is different than my "Divergences (Pivots)"
Thank you!
