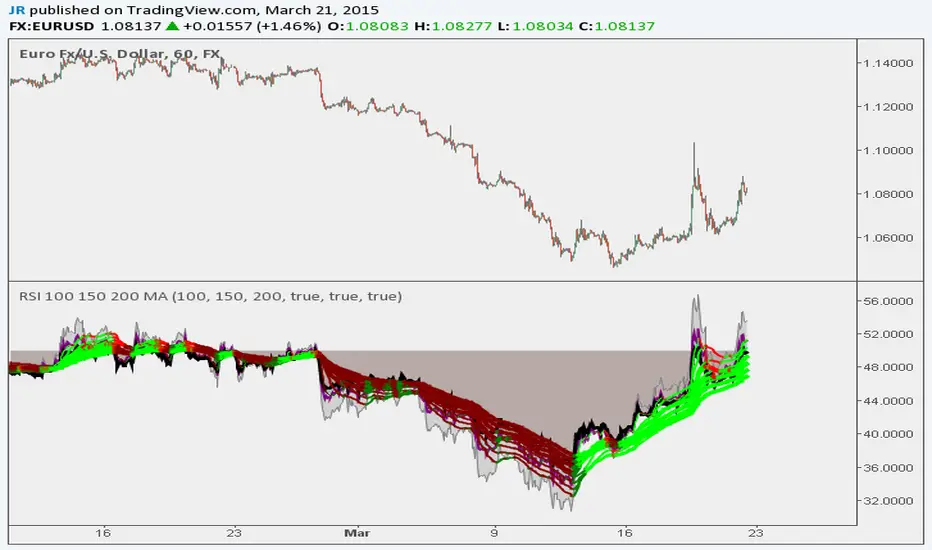
RSI 100 150 200 MA Ribbon
Following Trends and Finding Divergences
Here is a script example that uses a long length (100, 150, 200) RSI MA Ribbon to detect trend reversals using lower time frames. You can also use traditional RSI to find divergences.
Built Best for 1H to 10 Min Charting
BTCUSD
انفراج سعري
LX Rsi Divergence BarsThis script colours the bars when they are below or boyond a specified RSI threshold

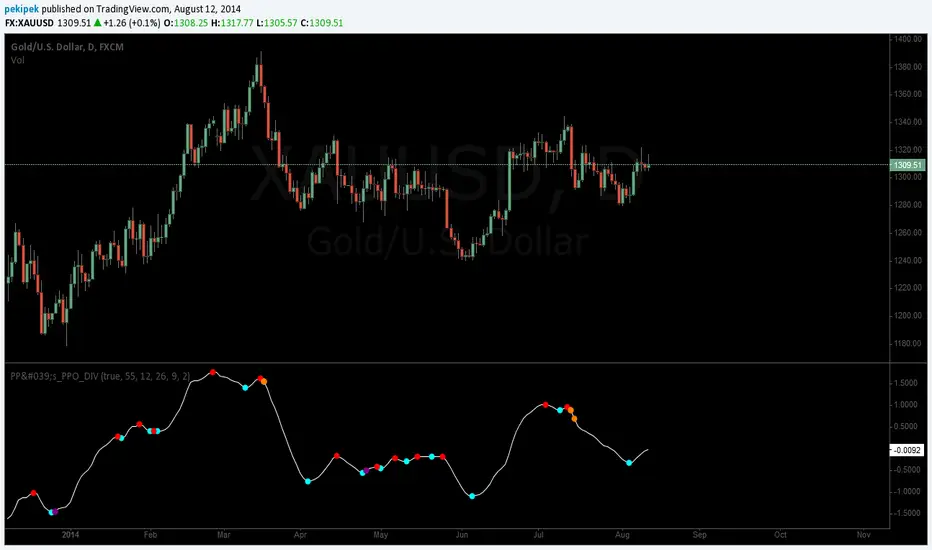
Pekipek's PPO Divergence BETABeta divergence indicator, you can exchange the Price Percentage Oscillator (PPO) for any oscillator. You can play around with the look-back period if you want to use long term divergences.
WARNING:
Because its impossible to make the look-back period of the lowest/highest functions dynamic, the indicator can plot divergences sometimes at places where there are none, however in my experience this does not occur so much. Also it is impossible to plot isolated lines, so its hard to visually see which divergence(s) exactly is(are) being signaled. Once these features become possible I can really refine the indicator.