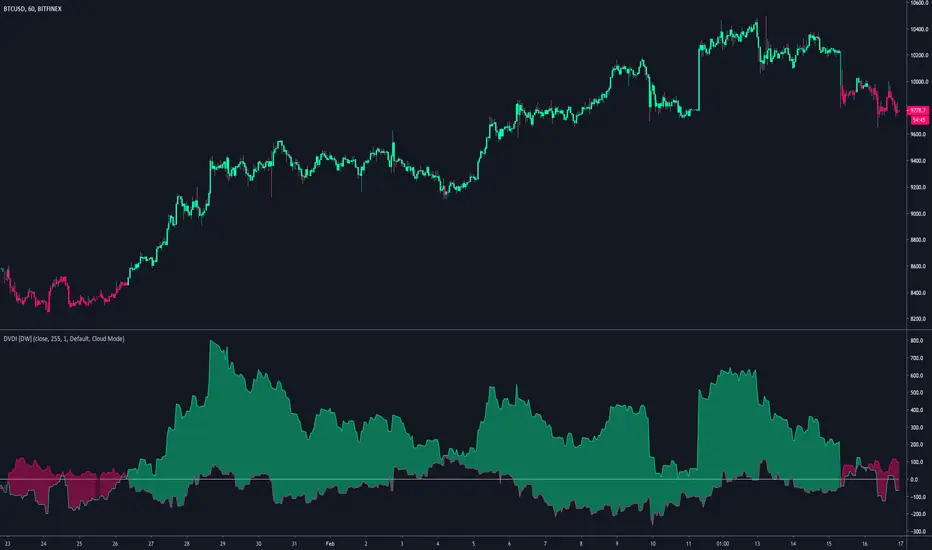
Dual Volume Divergence Index [DW]This is an experimental variation of Paul L. Dysart's Positive Volume Index and Negative Volume Index that tracks the divergences between the PVI and its EMA, and the NVI and its EMA, then plots both together for comparison.
This tool can be used to identify trending price activity.
انفراج سعري
MgGinley Dynamic Divergence [DW]This is an experimental study designed to visualize momentum and average range by expressing divergences between price and a McGinley Dynamic as a percentage.

CCI Cloud [DW]This is a simple experimental study utilizing multiple CCIs and their divergences to visualize price activity.

Flow of Fund Divergence with alertThe Flow of fund(FOF) divergence signal indicator consists of the following parts: The Flow of fund histogram, FOF trend line and divergence signal. The signal is instantly drawn on current bar and will not repaint.
HISTOGRAM shows an approximate amount of money get in or out of the market within 1 bar. If selling pressure is stronger than buying pressure, it will be a red histogram, otherwise, it will be a green histogram.
Flow of fund trend line indicates the short or long term movement of the flow, determined by the "Length of FOF" input you set.
Divergence
The divergence signal has two types, bearish and bullish.
A bullish divergence occurs when the price hit a lower low and the FOF line is in uptrend. A down arrow will be drawn above the current FOF line when there is a bearish divergence between FOF and price trend.
A bearish divergence occurs when the price hit a higher high and the FOF line is in downtrend. A up arrow will be drawn below price candle bar when there is a bullish divergence between FOF and price trend.

BUBD+ - Bats Ultimate Bullish Divergence DetectorBUBD checks for price divergence from oscillators across 6 different oscillators - MACD, CCI (Vol. weighted), RSI, Stochastic RSI, Money Flow and Relative Vigor index. Use it to find good entry spots for longs and also to find downtrend reversals. If this gets popular I will release a Bearish divergence indicator as well.
Please check your stock/crypto across all time frames to get a hint of any developing "Bullish" divergences.
In case you get mixed signals -
Blue - RSI
Purple - RVI
Yellow - CCI
Green - MACD
Lime light green - MFI
Orange - Stoch RSI
Dont get confused by signals appearing on top and bottom all are bullish indicators. If you see a signal go to the respective oscillator to check the developing trend.

CryptoArbitrageDivergenceStudy that is related to my CryptoArbitrageDivergenceStrategy.
Buy-/ Sell signals are generated, when the price is rising on one exchange, while it is falling on the other exchange.
You can configure for how many candles the condition must be true, before a signal is generated.
The first exchange can be chosen by selecting the financial instrument of choice, the other exchange can be set in the properties dialog of my study/ indicator.
There are also alertconditions implemented, so you can receive buy-/ sell signals via pop-up, SMS or Email.

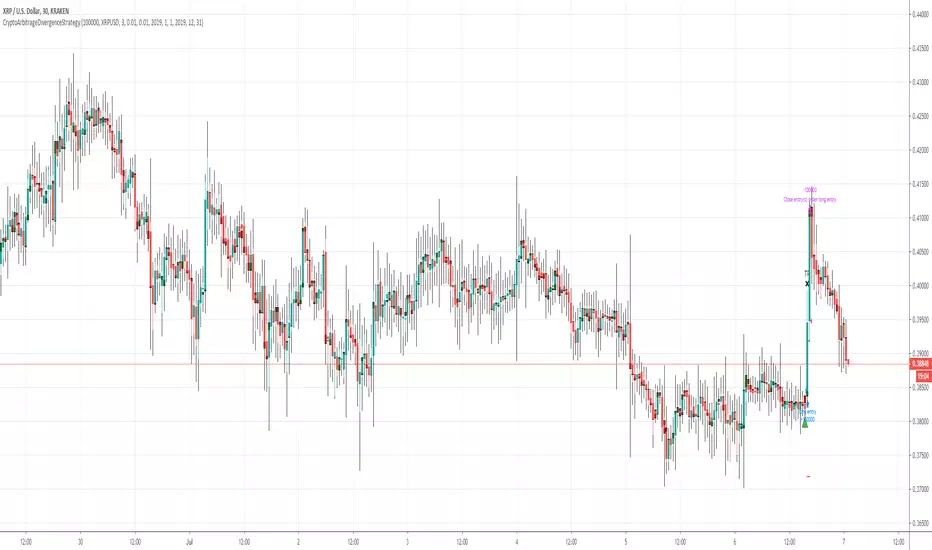
CryptoArbitrageDivergenceStrategyThis Strategy is based on arbitrage opportunities on Crypto-Exchanges.
If the price goes up on one exchange while it goes down on the other exchange, there is a probability that a correction on one of those exchanges will occur.
Use this strategy script to backtest and proof your arbitrage idea.
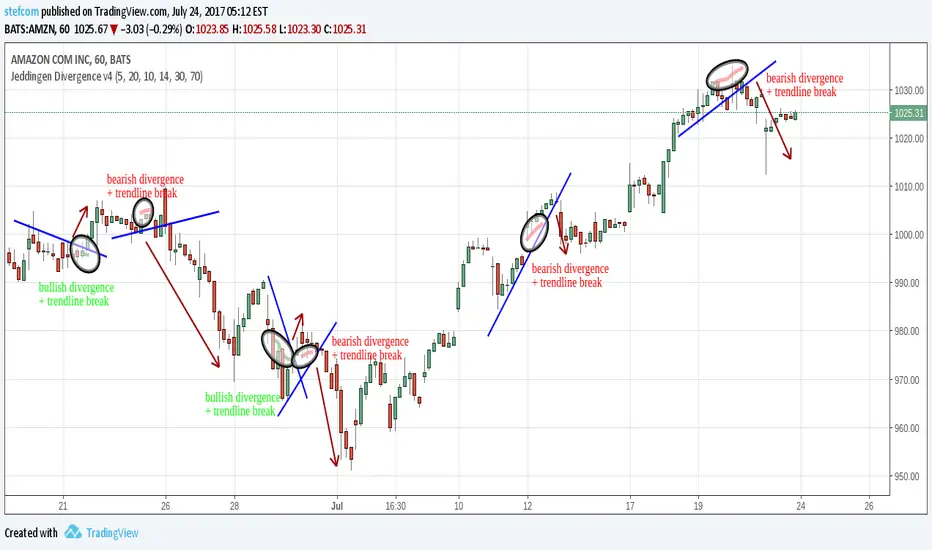
Jeddingen Divergence v4Momentum vs. price divergence. Sell signals on bearish divergence, buy signals on bullish divergence .
Indicator includes an RSI filter, alert-conditions and lots of other configuration options.
There is also a TradingView strategy available to backtest everything!
Jeddingen Divergence Strategy v4Momentum vs. price divergence. Sell signals on bearish divergence, buy signals on bullish divergence .
Strategy includes an RSI filter, limit the time-range for back-testing and lots of other configuration options.
The below example uses stop-losses.
There is also a matching TradingView study with alert-conditions available!


PRO MomentumINVITE ONLY SCRIPT:
FEATURES:
As its name suggests, PRO Momentum provides non-subjective momentum analysis to traders through automatic pattern detections, covering a wide range of statistically relevant structures in both ranging and trending contexts. Our goal was to provide a professional grade risk management tool capable of providing various signals, which guide the trader in its decision to engage or not in a certain price area filtered by Framework. Nevertheless, both indicators are complex tools requiring extensive learning. To support students in their journey, there is a wide open online community of users in our Discord channel, providing peer-to-peer assistance to progress with the strategy as well as tutored courses.
OUTPUTS:
To share a brief description of the PRO Momentum functioning, we will scroll through the major set of outputs that are presented to the user. Please note that the indicator is meant to assist from Junior to Senior expertise, to achieve this we have set different base templates right into the indicators. To keep this description simple, we will present the outputs you’ll see with the beginner setup:
Momentum Signals: As shown on the chart, there are multiple types of output signals, each corresponding to different momentum patterns. Detailed documentation is available on our website for those seeking in-depth information. Here's a high-level overview: The patterns are divided into three categories, each represented by different colors. Blue and Red signals are used in trending contexts, Gray signals are for ranging contexts, and dark-colored signals are exclusive to reversal contexts, suitable for more experienced traders. Momentum signals are binary outputs, making it easy for users to set alerts. The indicator includes built-in alerts for these groups to streamline the process. However, it’s crucial to remember that momentum signals are not standalone trading signals. The Framework indicator must first filter interesting prices and identify the context. Only then should traders use momentum signals to adjust risk.
Sinewave Oscillators: Cyclical analysis is a critical aspect of professional risk management. Markets naturally oscillate, and significant statistical probabilities can be derived from cycle studies. We use a custom-modified version of Ehlers’ sinewave methodology. Cyclical analysis, while somewhat predictive, scans past prices to predict probable future states. Since markets are inherently unpredictable, cycle analysis is used as a confirmation signal in our strategy. Essentially, we filter out all momentum signals that occur outside favorable cyclical conditions. Bearish signals are only exploited if the sinewave is in the top area of the oscillator, and vice-versa for bullish signals.
GENERAL STRATEGY:
Overall, the PRO Strategy combines two “core” indicators, Framework and Momentum. Framework is plotted on the main chart section as an overlay, it is definitely the most important as it guides the user through the hard process of filtering prices and timeframes that are suitable for technical analysis. On the other hand, PRO Momentum is on a separate oscillator tab under the chart section, it will study the momentum and cyclical structure, also offering automated pattern detection. Ultimately, our strategy is based on collecting and processing non-subjective rules, emanating from the indicators outputs. Essentially, this means that the indicator actually takes care of producing all the necessary binary outputs, leaving you with the remaining task of combining them correctly following the strategy’s patterns.
RISK LIMITATION:
Even if we provide automated momentum signal detection, there is no “one-click” or "easy-win” solution, the user still needs to carefully review the elements. When applicable pattern rules are confirmed, the user will gather risk-limitation information from both indicators (breakout targets, price confirmations, momentum and cyclical coordination) and decide whether or not to trade according to its own risk profile. If so, the position sizing, stop-loss positioning, risk management and profit targets will all be defined according to the same indicator’s outputs. This effectively suppresses most behavioral and personal biases the trader could introduce, creating a stable and statistical risk management structure aiming for a durable profitability.

[RS]Volume Price ChangeEXPERIMENTAL
calculates, price change * volume over a specific time window.
It reflects trend, momentum and volume participation.
It can be used to find divergences.

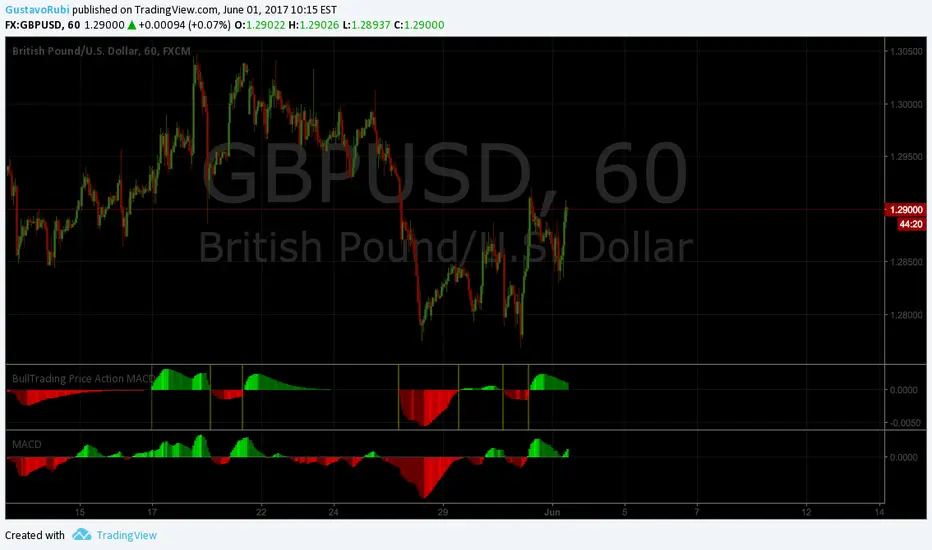
BullTrading PA-MACDBullTrading PA-MACD contains different algorithms based on price action to calculate and display the popular MACD indicator. It will display more relevant crosses without sacrificing much sensibility (use fractal entries).
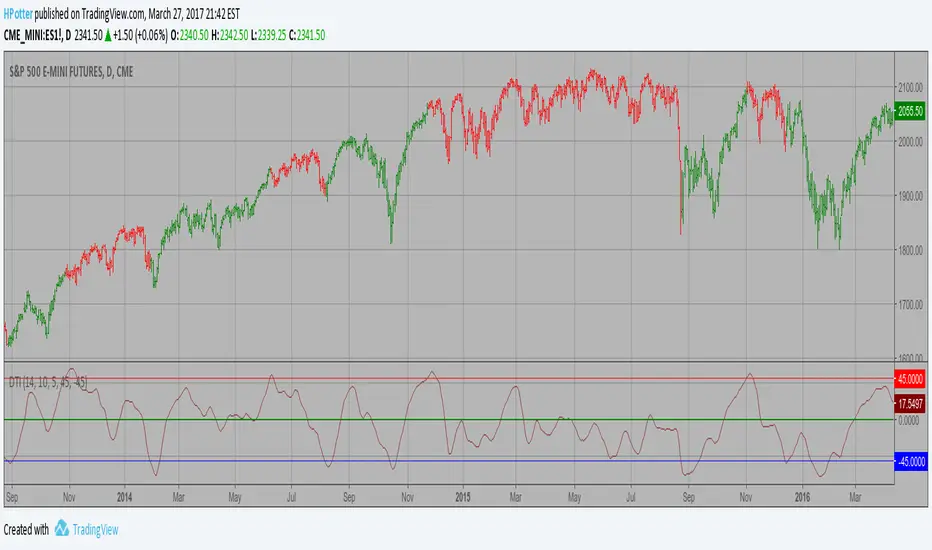
Directional Trend Index (DTI) Strategy This technique was described by William Blau in his book "Momentum,
Direction and Divergence" (1995). His book focuses on three key aspects
of trading: momentum, direction and divergence. Blau, who was an electrical
engineer before becoming a trader, thoroughly examines the relationship between
price and momentum in step-by-step examples. From this grounding, he then looks
at the deficiencies in other oscillators and introduces some innovative techniques,
including a fresh twist on Stochastics. On directional issues, he analyzes the
intricacies of ADX and offers a unique approach to help define trending and
non-trending periods.
Directional Trend Index is an indicator similar to DM+ developed by Welles Wilder.
The DM+ (a part of Directional Movement System which includes both DM+ and
DM- indicators) indicator helps determine if a security is "trending." William
Blau added to it a zeroline, relative to which the indicator is deemed positive or
negative. A stable uptrend is a period when the DTI value is positive and rising, a
downtrend when it is negative and falling.
MagnetSimple Indicator designed by me to check tops and bottoms, also helps to ride the trend, Indicator Tries to Get back at zero.

VDUB BB %B REVERSAL_v4.2 revised by JustUncleLThis is an revised Open Public version of Vdub Bollinger Band %B reversal indicator. This version includes optional Divergence Finder with selectable channel width, optional Market Session time highlighting and optional Binary Option expiry markers.

Open Close Cross Alert R6 by JustUncleLThis revision of this indicator is an Open Public release. The indicator alert based on JayRogers "Open Close Cross Strategy R2" and is used in conjunction with the revised "Open Close Cross Strategy R5".
Description:
This indicator alert created for TradingView alarm sub-system (via the alertcondition() function, which currently does not work in a "Strategy" script). Also this indicator plots the Difference Factor between the Close and Open Moving Averages, this gives a good indication of strength of move. Also included in this release is optional Divergence finder with variable width channel.

Price Divergence Detector V3 revised by JustUncleLThis is a revised version of the original "Price Divergence Detector by RicardoSantos".
Description:
Price Divergence detection for various methods : RSI, MACD, STOCH, VOLUME, ACC-DIST, FISHER, CCI, BB %B and Ehlers IdealRSI. Both Hidden and Regular Divergences are detected.
Mofidifications:
Revision 3.0 by JustUncleL
Added option to disable/enable Hidden and Regular Divergence
Added new divergence method BB %B (close only)
Added new divergence mothos Ehlers IdealRSI (close only)
Revision 2.0 - by RicardoSantos
References:
Information on Divergence Trading:
www.babypips.com
www.incrediblecharts.com (BB %B)

Chaos 2.0This is pure chaos!
I just wanted 1 thing I can put on a chart to try to get a clearer picture of what is going on (and not take up all the indicator spaces a free user is allowed haha)
Many things going on from so many different users
honestly I'm sorry I cant shout out everyone whose code I have ever read and used in another project just for the sake of learning more about pinescript!
As a way of shouting everyone out! (and giving out my most useful and configurable system)
I give you... CHAOS
I originally got an Alligator, AO, and Fractal script from a user ChaosTrader, then realized I love using averages!
I added the MESA (lazybear?) and the McGinley Dynamic Range (sry idk) and a simple 233 SMA.
I also found about something called the www.prorealcode.com another user had created for Pinescript.
I really liked that script so I adapted it to do the same kind of signal printing for circles and squares (crosses and series)
Check it out tell me what you think and how I can make it better for everyone!
thanks all!
Snoop

B3 ECOBlau's Ergodic Candlestick Oscillator = a decent trend finder, however slightly lagged. It can help you to see a reversal entry if you are looking for one. I find the one line ECO hard to use, so I have created this histogram version with a signal line. The colors help to show you whats going on with the ECO and its bias. This indicator shows up in a couple books by people other than Blau, and namely by Krausz. You can also see divergences, for example in pic above the lower or second of the two green humps showing that the general uptrend might be weakened as this run contained less momentum. Tighten up the signal line to see a faster change in its color. These settings are the B3 input settings for default, meaning the ones I use in trading. They are not however the default values you might read about other places.

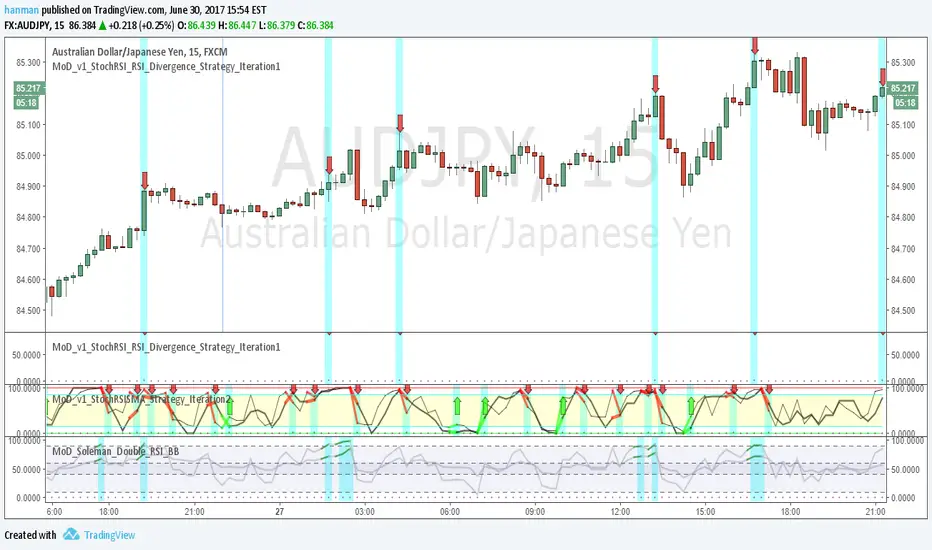
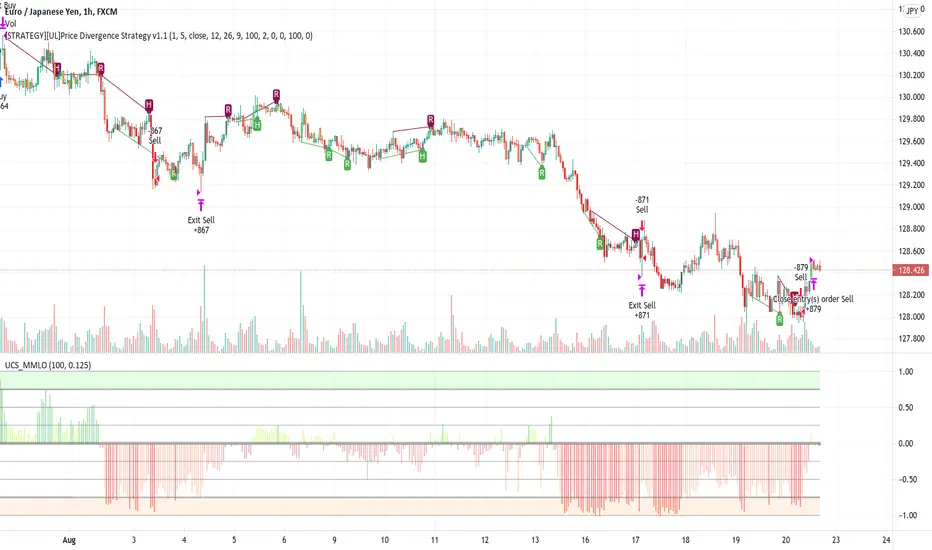
[STRATEGY][UL]Price Divergence Strategy v1.0Created by Request: This is a trend trading strategy that uses Price Divergence detection signals that are confirmed by the "Murrey's Math Oscillator" (Donchanin Channel based).
Strategy Code Based on:
Price Divergence Detector V2 by RicardoSantos
UCS_Murrey's Math Oscillator by Ucsgears
Strategy Risk Management Based on:
Strategy Code Example by JayRogers
Information on Divergence Trading:
- www.babypips.com
*** USE AT YOUR OWN RISK ***
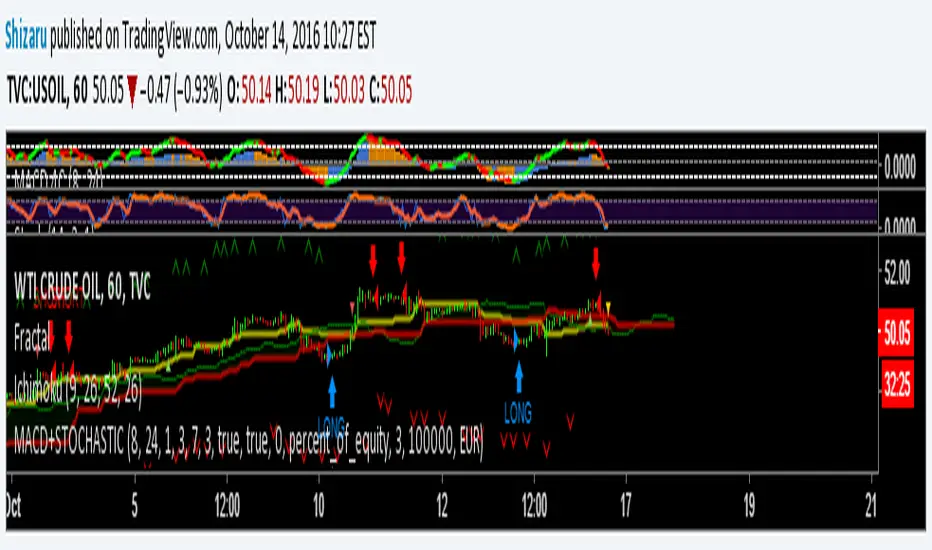
MACD+STOCHASTICA simple strategy that use MACD and STOCHASTIC to give buy/sell signal. Use fractals to put stop loss