RTH Previous Day's Range + SMTs [bilal x shpat]Overview
This advanced indicator is designed specifically for futures and equity traders who focus on Regular Trading Hours (RTH) sessions. It automatically plots the previous RTH session's high and low levels and detects Smart Money Theory (SMT) divergences across multiple correlated or inversely correlated instruments.
Key Features
📊 RTH Range Detection
Automatically identifies and tracks Regular Trading Hours (9:30 AM - 4:14 PM New York time)
Plots horizontal lines at the previous RTH session's high and low
Works seamlessly on all timeframes, including ETH (Extended Trading Hours) charts
Lines dynamically extend and update as new bars form
🔄 Smart Money Theory (SMT) Divergence Detection
Compares up to 3 correlated or inversely correlated assets simultaneously
Detects bullish and bearish SMT divergences automatically
Visual divergence lines connect previous session levels to current intraday highs/lows
Customizable SMT labels showing which instruments are diverging
Option to mark assets as "Correlated" or "Inversely Correlated" for accurate divergence detection
SMT detection occurs only during RTH sessions for cleaner signals
🎨 Fully Customizable Styling
3 Label Styles: Choose between "Full" (RTH Previous Day High), "Short" (RTH PDH), or "Lowercase" (rth previous day high)
Adjustable Label Sizes: Tiny, Small, Normal, or Large
Custom Colors: Separate color controls for lines, labels, bullish SMT, and bearish SMT
Line Extension: Control how many bars ahead lines extend
Line Width: Customize line thickness
📈 SMT Visual Indicators
Arrow Symbols: ▲ = Higher / ▼ = Lower (for correlated assets)
Alternate Symbols: 🔺 = Higher / 🔻 = Lower (for inversely correlated assets)
Color-coded divergence lines (white by default, fully customizable)
Optional SMT labels showing ticker symbols with directional indicators
Optional comparison table displaying current divergence status
⚙️ Comparison Settings
Add up to 2 comparison symbols (e.g., ES1!, YM1!, NQ1!)
Toggle each comparison asset on/off independently
Set correlation type (Correlated or Inversely Correlated) for each asset
Popular comparisons: ES vs NQ, YM vs ES, Equity vs Futures
🧹 Clean Chart Management
Option to delete previous RTH SMTs when new session starts
Automatic cleanup of outdated lines and labels
Transparent label backgrounds for minimal chart clutter
Lines track exact bar where high/low occurred
How It Works
Session Detection: The indicator identifies when RTH begins (9:30 AM ET) and tracks all price action during the session until close (4:14 PM ET)
Level Capture: At the start of each new RTH session, it captures the previous session's high and low and plots them as reference levels
SMT Analysis: During the current RTH session, it continuously compares the current session's high/low with the previous session's high/low across all selected instruments
Divergence Identification: When one instrument makes a higher high while another makes a lower high (or vice versa), an SMT divergence is detected and visualized
Use Cases
Liquidity Analysis: Identify when markets are taking liquidity at different rates
Reversal Signals: SMT divergences often precede significant reversals
Correlation Trading: Monitor when traditionally correlated markets begin to diverge
Key Level Trading: Use previous RTH high/low as support/resistance levels
Multi-Market Analysis: Compare ES, NQ, and YM simultaneously for institutional flow
Best Practices
Most effective on intraday timeframes (1m - 15m charts)
Works on both RTH and ETH chart sessions - meant to be used on a RTH chart
Compare highly correlated instruments (e.g., ES1! vs NQ1!)
Use in combination with volume analysis and market structure
SMT divergences are most powerful near key levels
Settings Overview
Comparison Symbols
Asset 2 & 3: Select tickers to compare (e.g., ES1!, YM1!)
Correlation toggles for each asset
Enable/disable each comparison independently
Styling
Line color, width, and extension length
Label color, size, and style (3 options)
Separate colors for bullish and bearish SMT lines
SMT Controls
Toggle SMT detection on/off
Show/hide SMT text labels
Optional SMT comparison table
Delete previous session SMTs option
Note: This indicator is best used by traders familiar with Smart Money Concepts (SMC) and inter-market analysis. Understanding market correlations is essential for accurate interpretation of SMT divergences.
thank you shpat for the SMT option in the last indicator, i tweaked it for this one
Ict

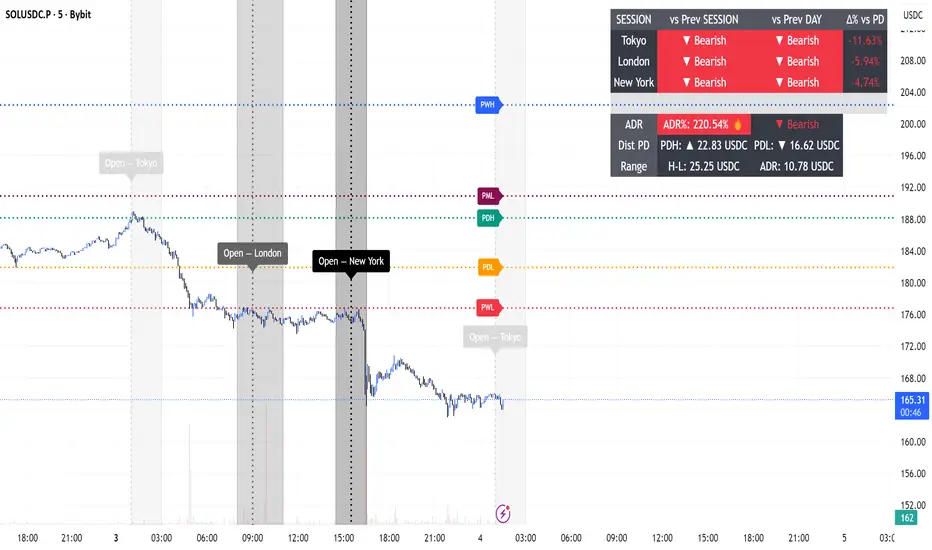
Session Engine — Market Opens, Killzones & Levels — SMC/ICTSession Engine — Market Opens, Killzones & Institutional Levels (Tokyo • London • New York) — SMC/ICT — TradingATH (PueblaATH)
Precision. Sessions. Structure.
Session Engine maps the institutional heartbeat of the day across Tokyo , London , and New York . It draws timezone-accurate Market Open Lines , clean Killzones (incl. London–NY overlap), and a rock-solid, timeframe-safe suite of Previous High/Low Levels (PDH/PDL/PWH/PWL/PMH/PML). On top, a compact Session Comparison Table with an integrated ADR panel shows extension, momentum context, and distance to key levels — at a glance.
Designed for SMC/ICT Traders who demand clarity and reliability, this tool stays stable when you change timeframe, reload, or zoom.
Map the day like a Pro : timezone-true Opens, configurable Killzones, TF-safe PDH/PDL/PWH/PWL/PMH/PML , and a sleek ADR panel beneath a Session Comparison Table . Built for precision SMC/ICT Execution . Zero flicker, full control.
Why Traders Love It
Timezone-Accurate Session Engine — Tokyo, London, New York opens and the London–NY overlap, all resolved to bar-time for precise plotting on any symbol.
Killzones you can trust — choose full-column height or price-bounded height with custom top/bottom tick offsets and label placement.
Bulletproof Previous Levels — PDH, PDL, PWH, PWL, PMH, PML are cached and only refresh on true D/W/M boundaries, eliminating the classic “levels disappear on TF change” problem.
Actionable Context — a compact Session Comparison Table (vs previous session & vs previous day) plus an ADR panel with extension thresholds, distance to PDH/PDL, and current H-L range.
Serious Customization — dotted/solid lines, widths, label size & alignment, auto label backgrounds, block transparency, weekend & timeframe filters, and more.
Performance-Minded — persistent objects are updated in place (not spam-created) to keep your chart crisp and responsive.
What You’ll See
Market Opens — Vertical opens for TOK/LDN/NY with dotted/solid styling, width control, infinite or bounded height, and optional labels.
Killzones + Overlap — Transparent time boxes for session windows (and London–NY overlap). Optional labels, adjustable transparency, and height mode.
Institutional Levels — PDH / PDL / PWH / PWL / PMH / PML with length modes: Infinite, N bars, or End of day. Optional labels with typographic control.
Session Comparison Table — For each session: bias vs previous session and previous day, with optional Δ% column.
ADR Panel — 24h rolling ADR% consumption with two attention thresholds, distance to PDH/PDL (price units), and current H-L range.
How It Works
Session Timing uses explicit IANA timezones (Asia/Tokyo, Europe/London, America/New_York) then anchors to bar_time for pixel-perfect placement.
Killzones are persistent boxes that reset only on daily change, preventing redundant object creation.
Previous Levels are requested once per true period roll (D/W/M) and stored locally; this cache keeps lines stable when switching TFs or reloading charts.
Level Line Length is enforced per-object (Infinite, N bars, End of day) with dynamic x2 handling — no redraw flicker.
ADR uses a timeframe-agnostic 24h rolling window for H/L/range; ADR length is defined in “days” and mapped to bars for any timeframe.
How to Use
Set Session Times (defaults are standard). Adjust the London–NY overlap if your venue differs.
Style your Opens & Killzones — line width, dotted/solid, infinite or bounded height, label font size/align/background.
Choose Level Behavior — Infinite, N bars, or End of day for PD/ PW / PM lines; toggle labels as needed.
Read the Table and ADR — quick bias vs previous session/day, Δ% if you enable it; ADR panel highlights extension with blink thresholds and shows live distance to PDH/PDL.
Inputs
Schedules — Open times + killzone windows for TOK/LDN/NY, and London–NY overlap.
Style — Line width, dotted/solid, label sizes & alignment, auto backgrounds.
Heights — Infinite or tick-bounded line height; full-column or tick-bounded killzones.
Levels — Show/hide PDH/PDL/PWH/PWL/PMH/PML; length mode; label options.
Table & ADR — Font size, arrows, Δ% column, ADR length (days), blink thresholds, show/hide rows.
Filters — Hide visuals on specified timeframe ranges; optional weekend suppression.
Best Practices
Use “End of day” for tidy level lines that still convey right-hand context.
Set ADR thresholds to your instrument’s personality (e.g., 80/120 for FX, 100/150 for crypto).
On exotic trading sessions, verify the IANA timezone alignment and tweak inputs accordingly.
If you stack many tools, consider disabling unused sessions/rows to stay within object limits.
What Makes It Original
A cohesive Session Engine architecture that unifies timezone-true Opens, configurable Killzones/Overlap, and TF-safe previous levels — tailored for SMC/ICT execution.
Robust caching that eliminates TF-switch flicker and preserves dependent calculations (distance to PDH/PDL, ADR%) without gaps.
A unified ADR panel directly under the session table with real-time extension signaling and distance-to-PDH/PDL — pragmatic, trade-ready context you won’t find in generic session scripts.
Deep length & typography controls so visuals are informative and elegant.
Notes & Disclaimer (Originality & Rights)
Original Work Notice — Please read — This script/indicator is an original work created exclusively by TradingATH ( PueblaATH ). It is not derived from, copied from, or authored by any other person or entity. Any resemblance to other scripts is coincidental and limited to the use of public and widely known trading concepts.
Usage & Publication — Redistribution, cloning, or republishing this script (in whole or in part) without the explicit written permission of TradingATH ( PueblaATH ) is prohibited. By using this tool, you acknowledge the author’s exclusive authorship and associated rights.
No Financial Advice — This tool is for educational/informational purposes only and does not constitute financial advice. Markets carry risk; manage your risk and make your own decisions.
HTF Ranges - AWR/AMR/AYR [bilal]📊 Overview
Professional higher timeframe range indicator for swing and position traders. Calculate Average Weekly Range (AWR), Average Monthly Range (AMR), and Average Yearly Range (AYR) with precision projection levels.
✨ Key Features
📅 Three Timeframe Modes
AWR (Average Weekly Range): Weekly swing targets - Default 4 weeks
AMR (Average Monthly Range): Monthly position targets - Default 6 months
AYR (Average Yearly Range): Yearly extremes - Default 9 years
🎯 Dual Anchor Options
Period Open: Week/Month/Year opening price
RTH Open: First RTH session (09:30 NY) of the period
📐 Projection Levels
100% Range Levels: Upper and lower targets from anchor
Fractional Levels: 33% and 66% zones for partial targets
Custom Mirrored Levels: Set any percentage (0-200%) with automatic mirroring
Example: 25% shows both 25% and 75%
Example: 150% shows both 150% and -50%
📊 Information Table
Active range type (AWR/AMR/AYR)
Average range value for selected period
Current period range and percentage used
Distance remaining to targets (up/down)
Color-coded progress (green/orange/red)
🎨 Fully Customizable
Orange theme by default (differentiates from daily indicators)
Line colors, styles (solid/dashed/dotted), and widths
Toggle labels on/off
Adjustable lookback periods for each timeframe
Independent settings for each range type
⚡ Smart Features
Lines start at actual period open (not fixed lookback)
Automatically tracks current period high/low
Works on any chart timeframe
Real-time range tracking
Alert conditions when targets reached or exceeded
🎯 Use Cases
AWR (Weekly Ranges):
Swing trade targets (3-7 day holds)
Weekly support/resistance zones
Identify weekly trend vs rotation
Compare daily moves to weekly context
AMR (Monthly Ranges):
Position trade targets (2-4 week holds)
Monthly breakout levels
Institutional-level zones
Earnings play targets
AYR (Yearly Ranges):
Major reversal zones
Long-term support/resistance
Identify macro trend strength
Annual high/low projections
💡 Trading Strategies
AWR Strategy (Swing Trading):
Week opens near AWR lower level = potential long setup
Target AWR 66% and 100% levels
Week hits AWR upper in first 2 days = watch for reversal
Use fractional levels as scale-in/scale-out points
AMR Strategy (Position Trading):
Month opens near AMR extremes = fade setup
Month breaks AMR in week 1 = expansion (trend) month
Target opposite AMR extreme for swing positions
Use 33%/66% for partial profit taking
AYR Strategy (Long-term Context):
Price near AYR extremes = major reversal zones
Breaking AYR levels = historic moves (rare)
Use for macro trend confirmation
Great for yearly forecasting and planning
📊 Range Interpretation
<33% Range Used: Early in period, room for expansion
33-66% Range Used: Normal progression
66-100% Range Used: Extended, approaching extremes
>100% Range Used: Expansion period - trending or high volatility
⚙️ Settings Guide
Lookback Periods:
AWR: 4 weeks (standard) - adjust to 8-12 for smoother average
AMR: 6 months (standard) - seasonal patterns
AYR: 9 years (standard) - captures full cycles
Anchor Type:
Period Open: Use for clean week/month/year open reference
RTH Open: Use if you only trade day session, ignores overnight gaps
Custom Levels:
25% = quartile targets
75% = three-quarter targets
80% = "danger zone" for reversals
111% = extended breakout target
🔄 Combine with ADR Indicator
Run both indicators together for complete multi-timeframe analysis:
ADR for intraday precision
AWR/AMR/AYR for swing/position context
See if today's ADR move is significant in weekly/monthly context
Multi-timeframe confluence = highest probability setups
💼 Ideal For
Swing Traders: Use AWR for 3-10 day holds
Position Traders: Use AMR for 2-8 week holds
Long-term Investors: Use AYR for macro context
Index Futures Traders: ES, NQ, YM, RTY
Multi-timeframe Analysis: Combine with daily ADR

Advanced ICT ADR Projections [bilal]📊 Overview
Professional ADR indicator designed specifically for index futures traders. Calculate and visualize Average Daily Range with multiple session options, fractional levels, and higher timeframe context.
✨ Key Features
🎯 Multiple Session Types
Full Day: Standard calendar day calculation
Midnight: Anchored to 00:00 NY time open
RTH (Regular Trading Hours): 09:30-16:00 NY session
Custom: Define your own session hours and anchor point
📐 Projection Levels
100% ADR Levels: Upper and lower range targets from anchor
Fractional Levels: 33% and 66% zones for partial targets
Custom Mirrored Levels: Set any percentage (0-200%) with automatic mirroring
Example: 25% shows both 25% and 75%
Example: 111% shows both 111% and -11%
📅 Higher Timeframe Context (Optional)
AWR: Average Weekly Range overlay
AMR: Average Monthly Range overlay
AYR: Average Yearly Range overlay
All HTF ranges use same anchor as daily session
📊 Information Table
Current session type and anchor time
ADR value for selected period
Current range and percentage used
Distance remaining to ADR targets (up/down)
Color-coded range percentage (green/orange/red)
🎨 Fully Customizable
Line colors, styles (solid/dashed/dotted), and widths
Toggle labels on/off
Adjustable ADR lookback period (1-100 days)
All HTF periods customizable
⚡ Smart Features
Lines start at actual session open (not fixed lookback)
Works on any timeframe
Real-time range tracking
Alert conditions when ADR reached or exceeded
🎯 Use Cases
For Day Traders:
Set profit targets at ADR extremes
Identify range expansion vs rotation days
Know when you've used 75%+ of daily range (possible reversal)
Compare RTH vs full day ranges
For Swing Traders:
Use AWR/AMR for weekly/monthly targets
Understand if today's move is significant in weekly context
Multi-timeframe confluence
Risk Management:
Size positions based on % of ADR remaining
Avoid trading when ADR exhausted (>100%)
Better stop placement using fractional levels
💡 Trading Tips
<50% ADR used = Room to run (continuation trades)
50-75% ADR used = Getting extended (scale out)
75-100% ADR used = Near extremes (reversal setups)
>100% ADR = Expansion day (trend day or volatility spike)
Use fractional levels (33%, 66%) as:
Partial profit targets
Re-entry zones on pullbacks
Confluence with other support/resistance
Compare RTH vs Full Day ADR to see if overnight or day session drives volatility.
⚙️ Settings Guide
ADR Period: 5 days is standard, adjust for different market regimes
Session Types:
Use Midnight for crypto or 24hr markets
Use RTH for pure day session analysis
Use Custom for specific session times (London, Asia, etc.)
Custom Levels:
Set 25% for quartile levels
Set 111% for extended targets beyond ADR
Experiment with 50%, 75%, 80% for your strategy
Perfect for ES, NQ, YM, RTY futures traders who need precise intraday range analysis with higher timeframe context!

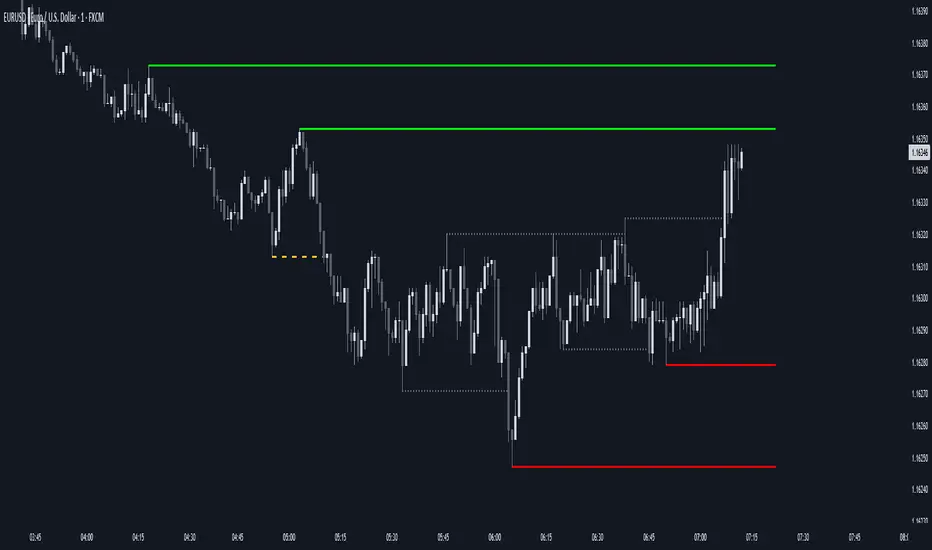
Session Liquidity Levels – Indicator for Smart Day Traders🧭 Session Liquidity Levels – Indicator for Smart Day Traders
Identify Key Market Liquidity Zones with Precision
The Session Liquidity Levels indicator automatically plots the most important market levels every day — giving you a clear view of where liquidity is building and where potential reversals or breakouts can occur.
This tool is designed for traders who rely on session structure and clean market levels rather than noise or lagging indicators.
⚙️ Features
✅ Asia Session High & Low – See the overnight range where liquidity starts building.
✅ London Session High & Low – Track the major volatility window and identify sweeps or fakeouts.
✅ Previous Day High & Low – Key reference points for continuation or reversal plays.
✅ Custom Colors & Styling – Personalize line colors and styles to fit your chart theme.
✅ Lightweight & Fast – Built in Pine Script v5 for smooth performance on all assets.
📊 How It Helps
Quickly visualize session highs/lows to plan liquidity grabs or breakout entries.
Mark daily structure without manually drawing lines.
Combine with your existing strategy to refine entry and exit timing.
Works on Forex, Indices, and Metals across all intraday timeframes.
⚡ Best For
Day traders who use session-based strategies (like Asia → London → New York transitions).
Traders studying liquidity sweeps, breakouts, or market structure shifts.
Anyone who wants a clean, automatic way to see session boundaries and key highs/lows.
🕌 Ethical Note
This indicator is 100% original, independently coded, and inspired by common trading concepts such as session ranges and daily structure.
It is not affiliated with or copied from any other paid indicators.
💰 Access
Available as an Invite-Only Script on TradingView.
Once purchased, you’ll receive access within 24 hours.
📩 Support
If you have any issues or want custom modifications (extra sessions, alerts, etc.), contact me directly — I’ll help you set it up.
Trade smarter. Stay disciplined. Let your levels guide you.

Custom Horizontal Lines | Trade Symmetry📊 Custom Horizontal Lines
🔍 Overview
The Custom Horizontal Lines is a precision utility designed for traders who perform manual higher-timeframe analysis and want to preserve their marked price levels directly on the chart.
It doesn’t calculate or detect anything automatically — instead, it acts as your personal level memory, preserving your analyzed zones and reference prices throughout the session.
Ideal for traders who manually mark the High, Low, Open, Close, Mean Thresholds, and Quarter Levels of Order Blocks, Fair Value Gaps, Inversion Fair Value Gaps and Wicks before the trading day begins.
⚙️ Key Features
✅ Manual Level Entry — Input your analyzed price levels (OB, FVG, WICK,etc) directly into the indicator settings.
✅ Preserved Levels — Once entered, your lines stay visible and consistent — even after switching symbols, timeframes, or reloading the chart.
✅ Supports All Level Types — Store any kind of manually defined level: OB highs/lows, FVG boundaries, Wicks, Mean Thresholds, Quarter levels, or custom reference prices.
✅ Clean Visualization — Customize line color, style, and labels for easy visual organization.
✅ Session-Ready Workflow — Built for pre-market preparation — enter your HTF levels once, and trade around them all day.
✅ No Auto Calculations — 100% manual by design — ensuring only your analyzed levels are shown, exactly as you defined them.
💡 How to Use
Open the indicator’s settings and manually enter those price values.
The indicator will plot and preserve those exact levels on your chart.
Switch to your lower timeframe and observe how price reacts around them — without ever needing to redraw.
🎯 Why It’s Useful
Keeps your HTF levels organized and persistent across sessions.
Saves time by avoiding redrawing.
Fits perfectly into ICT / Smart Money trading workflows.
Ensures full manual control and precision over what’s displayed on your chart.
🧩 Ideal For
ICT and Smart Money traders
Institutional-style manual analysts
Traders marking Mean Thresholds, or Quarter Levels of OBs, FVGs, Wicks etc
Anyone who wants a clean, reliable way to preserve their manual analysis

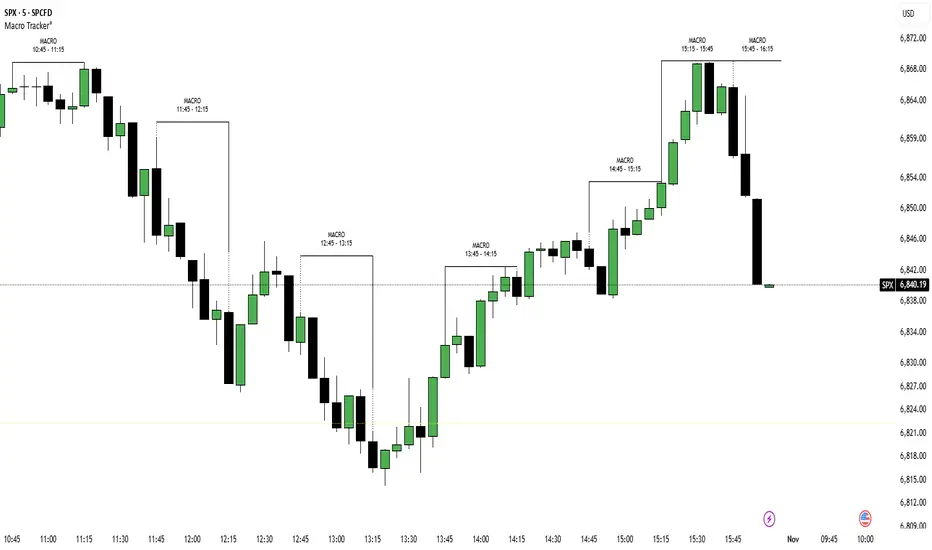
ICT Macro Tracker (xx:45-xx:15) (MTMGBS)Adjusted pinescript to reflect xx:45-xx:15 instead of the traditional xx:50-xx:15
Custom Time Separators + Hourly Open LinesThis Indicator is for those who wants to keep the chart clean and Study 1HR Profile.
best USE is : 1HR line Projected and 1 HR separator is plotted on the chart
i Use 4 Hrs. plotted and using for CRT Method to identify
SWEEP of C1 by C2 and, Entering ON C2 when its Trading back up,
or on your comfort of confirmation with MSS + FVG / OB
Lot of ICT Model can be traded and used with this including
PO3
Lumi trades : 1HR PO3
Ttrades CRT and Many more,
let me know if want to add anything if i think its useful we can add.
cheers

True Previous Day/Week High & LowTrue Previous Day/Week High & Low
What makes this indicator unique:
Unlike most previous day high/low indicators that only track SESSION data (e.g., 6:00 PM - 5:00 PM for futures), this indicator calculates the TRUE calendar day high and low from MIDNIGHT TO MIDNIGHT (00:00 - 23:59) in New York time.
Why this matters:
- Session-based indicators miss crucial price action that occurs during overnight hours
- True midnight-to-midnight calculation gives you the ACTUAL daily range
- Essential for traders who need accurate previous day levels for support/resistance
- Works perfectly on 24-hour markets like futures (NQ, ES, YM, etc.)
Features:
✓ True calendar day high/low (00:00-23:59 NY time)
✓ Previous week high/low
✓ Customizable line colors, widths, and styles (solid, dashed, dotted)
✓ Optional labels with adjustable size, color, and spacing
✓ Values displayed on price scale
✓ Toggle individual levels on/off
✓ Optimized for 1-minute charts but works on all timeframes
Perfect for:
- Futures traders (NQ, ES, YM, RTY)
- Day traders using previous day levels as key support/resistance
- Swing traders tracking weekly ranges
- Anyone who needs accurate 24-hour high/low levels
Settings are clean and intuitive - just add to your chart and customize the appearance to match your setup!

Advanced Smart Trading Suite with OTE═══════════════════════════════════════
ADVANCED SMART TRADING SUITE WITH OPTIMAL TRADE ENTRY
═══════════════════════════════════════
A comprehensive institutional trading system combining multiple advanced concepts including multi-timeframe liquidity analysis, order blocks, fair value gaps, and optimal trade entry zones. Features optional anti-repainting controls for confirmed signal generation.
───────────────────────────────────────
WHAT THIS INDICATOR DOES
───────────────────────────────────────
This all-in-one trading suite provides:
- Multi-Timeframe Liquidity Detection - HTF (Higher Timeframe), LTF (Lower Timeframe), and current timeframe liquidity sweep identification
- Order Blocks - Institutional accumulation/distribution zones with enhanced detection
- Fair Value Gaps (FVG) - Price imbalance detection
- Inverse Fair Value Gaps (iFVG) - Counter-trend imbalance zones
- Optimal Trade Entry (OTE) Zones - Fibonacci retracement-based entry zones (0.618-0.786)
- Trading Sessions - Asian, London, and New York session visualization
- Anti-Repainting Controls - Optional confirmed signals with adjustable confirmation bars
- Comprehensive Alert System - Notifications for all major events
───────────────────────────────────────
HOW IT WORKS
───────────────────────────────────────
ANTI-REPAINTING SYSTEM:
This indicator includes optional anti-repainting controls that fundamentally change how signals are generated:
Confirmed Mode (Recommended):
- Signals wait for confirmation bars before appearing
- No repainting - what you see is final
- Adjustable confirmation period (1-5 bars)
- Slight lag in signal generation
- Better for backtesting and systematic trading
Live Mode:
- Signals appear immediately as patterns develop
- May repaint as new bars form
- Faster signal generation
- Better for discretionary real-time trading
The confirmation system affects all features: liquidity sweeps, order blocks, FVGs, and OTE zones.
LIQUIDITY SWEEP DETECTION:
Three-Tier System:
1. Current Timeframe Liquidity:
- Detects swing highs/lows on chart timeframe
- Configurable lookback and confirmation periods
- Session-tagged for context (Asian/London/NY)
2. HTF (Higher Timeframe) Key Liquidity:
- Default: 4H timeframe (configurable to Daily/Weekly)
- Strength-based filtering using ATR multipliers
- Distance-based clustering prevention
- Only strongest levels displayed (top 1-10)
- Labels show timeframe and strength rating
3. LTF (Lower Timeframe) Key Liquidity:
- Default: 1H timeframe (configurable)
- Precision entry/exit levels
- Strength-based ranking
- Distance filtering to avoid clutter
Sweep Detection Methods:
- Wick Break: Any wick beyond the level
- Close Break: Close price beyond the level
- Full Retrace: Break and close back inside (stop hunt detection)
Buffer System:
- Configurable ATR-based buffer for sweep confirmation
- Prevents false positives from minor price fluctuations
ORDER BLOCKS (Enhanced):
Detection Methodology:
- Identifies the last opposing candle before significant structure break
- Bullish OB: Last red candle before bullish break
- Bearish OB: Last green candle before bearish break
Enhanced Filters:
1. Size Filter:
- Minimum order block size (ATR-based)
- Ensures significant zones only
2. Volume Filter:
- Requires above-average volume (configurable multiplier)
- Confirms institutional participation
3. Imbalance Filter:
- Requires strong directional move after OB formation
- Validates true institutional activity
Violation Detection:
- Wick-based: Any wick through the zone
- Close-based: Close price through the zone
- Automatic removal of broken order blocks
FAIR VALUE GAPS (FVG):
Bullish FVG: Gap between candle 3 low and candle 1 high (three-bar pattern)
Bearish FVG: Gap between candle 3 high and candle 1 low
Requirements:
- Minimum gap size (ATR-based)
- Clear price imbalance
- No overlap between the three candles
Fill Detection:
- Configurable fill threshold (default 50%)
- Tracks partial and complete fills
- Removes filled gaps to keep chart clean
INVERSE FAIR VALUE GAPS (iFVG):
What are iFVGs:
- Counter-trend FVGs that form after original FVG is filled
- Indicate potential reversal or continuation failure
- Form within specific timeframe after original FVG
Detection Rules:
- Must occur after a FVG is filled
- Must form within 20 bars of original FVG
- Minimum size requirement (ATR-based)
- Opposite direction to original FVG
Visual Distinction:
- Dashed border boxes
- Different color scheme from regular FVGs
- Combined labels when FVG and iFVG overlap
OPTIMAL TRADE ENTRY (OTE) ZONES:
Based on Fibonacci retracement principles used by institutional traders:
Concept:
After a structure break (swing high/low violation), price often retraces to specific Fibonacci levels before continuing. The OTE zone (0.618 to 0.786) represents the optimal entry area.
Bullish OTE Formation:
1. Swing low is formed
2. Structure breaks above previous swing high (bullish structure break)
3. Price retraces into 0.618-0.786 Fibonacci zone
4. Entry signal when price enters and holds in OTE zone
Bearish OTE Formation:
1. Swing high is formed
2. Structure breaks below previous swing low (bearish structure break)
3. Price retraces into 0.618-0.786 Fibonacci zone
4. Entry signal when price enters and holds in OTE zone
Key Fibonacci Levels:
- 0.618 (Golden ratio - primary target)
- 0.705 (Square root of 0.5 - institutional level)
- 0.786 (Square root of 0.618 - deep retracement)
Structure Break Requirement:
- Optional setting to require confirmed structure break
- Prevents premature OTE zone identification
- Ensures proper swing structure is established
Entry/Exit Tracking:
- Green checkmark: Price entered OTE zone validly
- Red X: Price exited OTE zone (stop or target)
- Real-time status monitoring
TRADING SESSIONS:
Displays three major trading sessions with full customization:
Asian Session (Tokyo + Sydney):
- Default: 01:00-13:00 UTC+4
- Typically lower volatility
- Sets up key levels for London open
London Session:
- Default: 11:00-20:00 UTC+4
- Highest liquidity period
- Major institutional moves
New York Session:
- Default: 16:00-01:00 UTC+4
- US market hours
- High impact news events
Features:
- Real-time status indicators (🟢 Open / 🔴 Closed)
- Session high/low tracking
- Overlap detection and highlighting
- Historical session display (0-30 days)
- Customizable colors and borders
───────────────────────────────────────
HOW TO USE
───────────────────────────────────────
MASTER CONTROLS:
Enable/disable major features independently:
- Trading Sessions
- Liquidity Sweeps (Current TF)
- HTF Liquidity Sweeps
- LTF Liquidity Sweeps
- Order Blocks
- Fair Value Gaps
- Inverse Fair Value Gaps
- Optimal Trade Entry Zones
ANTI-REPAINTING SETUP:
For Backtesting/Systematic Trading:
1. Enable "Use Confirmed Signals"
2. Set Confirmation Bars to 2-3
3. All signals will wait for confirmation
4. No repainting will occur
For Real-Time Discretionary Trading:
1. Disable "Use Confirmed Signals"
2. Signals appear immediately
3. Be aware signals may adjust with new bars
MULTI-TIMEFRAME LIQUIDITY STRATEGY:
Top-Down Analysis:
1. Identify HTF liquidity levels (4H/Daily) for major targets
2. Find LTF liquidity levels (1H) for entry refinement
3. Wait for HTF liquidity sweep (liquidity grab)
4. Enter on LTF order block in direction of HTF sweep
5. Target next HTF or LTF liquidity level
Liquidity Sweep Trading:
1. HTF liquidity sweep = major institutional move
2. Look for immediate reversal or continuation
3. Use order blocks for entry timing
4. Place stops beyond the swept liquidity
SESSION-BASED TRADING:
Asian Session Strategy:
1. Identify Asian session high/low
2. Wait for London or NY session to open
3. Trade breakouts of Asian range
4. Target previous day's highs/lows
London/NY Session Strategy:
1. Watch for liquidity sweeps at session open
2. Enter on order block confirmation
3. Use OTE zones for retracement entries
4. Target session high/low or HTF liquidity
OTE ZONE TRADING:
Setup Identification:
1. Wait for clear swing high/low formation
2. Confirm structure break in intended direction
3. Monitor for price retracement to 0.618-0.786 zone
4. Enter when price enters OTE zone with confirmation
Entry Rules:
- Bullish: Long when price enters OTE zone from above
- Bearish: Short when price enters OTE zone from below
- Stop loss: Beyond 0.786 level or swing extreme
- Target: Previous swing high/low or HTF liquidity
Exit Management:
- Indicator tracks when price exits OTE zone
- Red X indicates position should be managed/closed
- Use order blocks or FVGs for partial profit targets
FAIR VALUE GAP STRATEGY:
FVG Entry Method:
1. Wait for FVG formation
2. Monitor for price return to FVG
3. Enter on first touch of FVG zone
4. Stop beyond FVG boundary
5. Target: Fill of FVG or next liquidity level
iFVG Reversal Strategy:
1. Original FVG is filled
2. iFVG forms in opposite direction
3. Indicates failed move or reversal
4. Enter on iFVG confirmation
5. Target: Opposite end of range or next structure
Combined FVG + iFVG:
- When both overlap, indicator combines labels
- Represents high-probability reversal zone
- Use with order blocks for confirmation
ORDER BLOCK STRATEGY:
Entry Approach:
1. Wait for order block formation after structure break
2. Enter on first return to order block
3. Place stop beyond order block boundary
4. Target: Next order block or liquidity level
Confirmation Layers:
- Order block + FVG = strong confluence
- Order block + Liquidity sweep = institutional setup
- Order block + OTE zone = optimal entry
- Order block + Session open = high probability
Volume Analysis:
- Wider colored section = stronger institutional interest
- Use volume bars to confirm order block strength
- Higher volume order blocks = more reliable
───────────────────────────────────────
CONFIGURATION GUIDE
───────────────────────────────────────
LIQUIDITY SETTINGS:
Lookback: 5-30 bars
- Lower = more frequent, sensitive levels
- Higher = fewer, more significant levels
- Recommended: 15 for intraday, 20-25 for swing
Sweep Detection Type:
- Wick Break: Most sensitive
- Close Break: More conservative
- Full Retrace: Stop hunt detection
Sweep Buffer: 0-1.0 ATR
- Adds distance requirement for sweep confirmation
- Prevents false positives
- Recommended: 0.1 for most markets
HTF/LTF LIQUIDITY:
HTF Timeframe Selection:
- Swing trading: 1D or 1W
- Day trading: 4H or 1D
- Scalping: 1H or 4H
LTF Timeframe Selection:
- Swing trading: 4H or 1D
- Day trading: 1H or 4H
- Scalping: 15m or 1H
Strength Filters:
- Min Pivot Strength: Higher = fewer, stronger levels
- Min Distance: Higher = less clustering
- Recommended: 2.0 ATR for HTF, 1.5 ATR for LTF
ORDER BLOCK SETTINGS:
Swing Length: 5-20
- Controls sensitivity of structure break detection
- Lower = more order blocks, faster signals
- Higher = fewer order blocks, stronger signals
- Recommended: 8-10 for most timeframes
Enhancement Filters:
- Min Size: 0.5-1.5 ATR typical
- Volume Multiplier: 1.2-2.0 typical
- Imbalance: Enable for strongest signals only
OTE SETTINGS:
Swing Length: 5-50
- Controls OTE zone formation sensitivity
- Lower = more frequent, smaller moves
- Higher = fewer, larger trend moves
- Recommended: 10-15 for intraday
Require Structure Break:
- Enabled: Only shows OTE after confirmed break
- Disabled: Shows potential OTE zones earlier
- Recommended: Enable for higher probability setups
FVG SETTINGS:
Min FVG Size: 0.1-2.0 ATR
- Lower = more gaps detected
- Higher = only significant gaps
- Recommended: 0.5 ATR for most markets
Fill Threshold: 0.1-1.0
- Determines when gap is considered "filled"
- 0.5 = 50% fill required
- Higher = more conservative
iFVG Min Size: 0.1-2.0 ATR
- Typically smaller than regular FVG
- Recommended: 0.3 ATR
ALERT SYSTEM:
Available Alerts:
- Liquidity Sweeps (Current TF)
- HTF Liquidity Sweeps
- LTF Liquidity Sweeps
- Session Changes (Open/Close)
- OTE Entry Signals
Alert Setup:
1. Enable alerts in settings
2. Select specific alert types
3. Create TradingView alert using "Any alert() function call"
4. Configure delivery method (mobile, email, webhook)
Alert Messages Include:
- Event type and direction
- Confirmation status (if using confirmed mode)
- Price level
- Timeframe (for liquidity sweeps)
───────────────────────────────────────
RECOMMENDED CONFIGURATIONS
───────────────────────────────────────
For Day Trading (15m-1H charts):
- HTF Liquidity: 4H
- LTF Liquidity: 1H
- Liquidity Lookback: 15
- Order Block Swing Length: 8
- OTE Swing Length: 10
- Confirmed Signals: Enabled, 2 bars
For Swing Trading (4H-1D charts):
- HTF Liquidity: 1D or 1W
- LTF Liquidity: 4H
- Liquidity Lookback: 20
- Order Block Swing Length: 10
- OTE Swing Length: 15
- Confirmed Signals: Enabled, 2-3 bars
For Scalping (5m-15m charts):
- HTF Liquidity: 1H or 4H
- LTF Liquidity: 15m or 1H
- Liquidity Lookback: 10-12
- Order Block Swing Length: 6-8
- OTE Swing Length: 8
- Confirmed Signals: Optional
───────────────────────────────────────
PERFORMANCE OPTIMIZATION
───────────────────────────────────────
This indicator is optimized with:
- max_bars_back declarations for efficient lookback
- Automatic memory cleanup every 10 bars
- Conditional execution based on enabled features
- Drawing object limits to prevent performance degradation
Memory Management:
- Old liquidity zones automatically removed
- Filled FVGs/iFVGs cleaned up
- Exited OTE zones removed
- Mitigated order blocks deleted
Best Practices:
- Enable only needed features
- Use appropriate timeframe combinations
- Don't display excessive historical sessions
- Monitor drawing object counts on lower timeframes
───────────────────────────────────────
EDUCATIONAL DISCLAIMER
───────────────────────────────────────
This indicator combines multiple institutional trading concepts:
- Liquidity theory (where orders accumulate)
- Order flow analysis (institutional footprints)
- Price imbalance detection (FVGs)
- Fibonacci retracement theory (OTE zones)
- Session-based trading (time-of-day patterns)
All calculations use standard technical analysis methods:
- Pivot high/low detection
- ATR-based normalization
- Volume analysis
- Fibonacci ratios
- Time-based filtering
The indicator identifies potential setups but does not predict future price movements. Success depends on proper application within a complete trading plan including risk management, position sizing, and market context analysis.
───────────────────────────────────────
USAGE DISCLAIMER
───────────────────────────────────────
This tool is for educational and analytical purposes. Trading involves substantial risk of loss. The anti-repainting features provide confirmed signals but do not guarantee profitability. Always conduct independent analysis, use proper risk management, and never risk capital you cannot afford to lose. Past performance does not indicate future results.

Key Liquidity Advanced Multi-Timeframe Suite═══════════════════════════════════════
KEY LIQUIDITY ADVANCED MULTI-TIMEFRAME SUITE
═══════════════════════════════════════
A professional-grade indicator focused on identifying institutional liquidity levels across multiple timeframes, combined with order flow analysis and market structure tools.
───────────────────────────────────────
WHAT THIS INDICATOR DOES
───────────────────────────────────────
This tool specializes in multi-timeframe liquidity analysis with the following components:
- Multi-Timeframe Liquidity Levels - Track swing highs/lows on HTF (Higher Timeframe), LTF (Lower Timeframe), and CTF (Current Timeframe)
- Order Blocks - Identify institutional accumulation and distribution zones
- Premium/Discount Zones - Show price distribution relative to swing ranges
- Market Structure Breaks - Highlight significant trend changes
- Trading Sessions - Display major market session boundaries (Optional)
───────────────────────────────────────
HOW IT WORKS
───────────────────────────────────────
MULTI-TIMEFRAME LIQUIDITY SYSTEM:
The indicator uses a three-tier liquidity detection system:
1. HTF (Higher Timeframe) Liquidity:
- Default: 4H timeframe (configurable to Daily, Weekly)
- Identifies major institutional levels
- Uses pivot detection with adjustable left/right bar parameters
- Color-coded: Green for highs, Red for lows
2. LTF (Lower Timeframe) Liquidity:
- Default: 1H timeframe (configurable)
- Provides precision entry/exit levels
- Color-coded: Blue for highs, Orange for lows
3. CTF (Current Timeframe) Liquidity:
- Optional feature for chart timeframe levels
- Color-coded: Purple for highs, Pink for lows
Calculation Method:
- Uses standard pivot high/low detection algorithm
- Configurable sensitivity via left bars (lookback) and right bars (confirmation)
- Levels automatically removed when price sweeps through them (mitigation)
- Optional display of mitigated levels with reduced opacity
ORDER BLOCKS:
Detection Logic:
- Bullish OB: Last bearish candle before significant bullish move
- Bearish OB: Last bullish candle before significant bearish move
- Uses swing length parameter to identify structural breaks
- Strength visualization showing buying vs selling pressure
Visual Elements:
- Split-colored boxes showing institutional sentiment
- Upper half: Bullish strength (teal)
- Lower half: Bearish strength (red)
- Labels positioned at center with institutional markers
Violation Detection:
- Configurable: Wick-based or Close-based
- Automatically removes broken order blocks
- Optional overlap hiding to keep chart clean
PREMIUM/DISCOUNT ZONES:
Zone Structure:
- Premium Zone: Upper 5% of swing range (institutional selling area)
- Equilibrium: Middle 5% representing fair value
- Discount Zone: Lower 5% of swing range (institutional buying area)
The zones dynamically update based on trailing swing extremes and adapt to current market structure.
MARKET STRUCTURE BREAKS (MSB):
Identifies when price breaks through significant swing points:
- Bearish MSB: Price closes below swing low
- Bullish MSB: Price closes above swing high
- Labels appear only on trend direction changes
- Horizontal lines extend from break point
TRADING SESSIONS (Optional):
Displays time-based session boxes for:
- Asian Session (Tokyo + Sydney combined)
- London Session
- New York Session
Features:
- Customizable session times and time zones
- Session high/low tracking
- Overlap detection showing when multiple sessions are active
- Fully configurable colors and display options
───────────────────────────────────────
HOW TO USE
───────────────────────────────────────
MASTER TOGGLE CONTROLS:
Use these to enable/disable major features:
- Key Liquidity Levels (Main feature)
- Premium/Discount Zones
- Order Blocks
- Market Structure Breaks
- Trading Sessions
MULTI-TIMEFRAME LIQUIDITY STRATEGY:
Conservative Approach:
1. Wait for HTF liquidity sweep (4H or Daily level)
2. Look for LTF confirmation (1H level hold)
3. Enter when order block forms at discount (bullish) or premium (bearish)
Aggressive Approach:
1. Trade LTF liquidity sweeps in direction of HTF trend
2. Use order blocks for entry refinement
3. Target next LTF or HTF liquidity level
Range Trading:
1. Identify premium and discount zones
2. Buy at discount, sell at premium
3. Use equilibrium as profit target or re-entry
ORDER BLOCK TRADING:
Entry Method:
1. Wait for order block formation (after structure break)
2. Enter on first return to order block zone
3. Place stop beyond the order block
Strength Analysis:
- Wider bullish section = stronger institutional buying
- Wider bearish section = more selling pressure
- Use this to gauge conviction
Violation:
- Order block broken = setup invalidated
- Look for next order block in continuation
MARKET STRUCTURE TRADING:
MSB signals potential trend change:
- Bearish MSB + Bearish OB = short opportunity
- Bullish MSB + Bullish OB = long opportunity
- Wait for retest of broken level for confirmation
───────────────────────────────────────
CONFIGURATION GUIDE
───────────────────────────────────────
KEY LIQUIDITY SETTINGS:
Pivot Detection:
- Left Bars (Default: 15): Lookback period for pivot identification
- Right Bars (Default: 5): Confirmation period
- Higher values = fewer, more significant levels
- Lower values = more frequent, sensitive levels
Timeframe Selection:
- HTF: Recommended 4H, 1D, or 1W for swing trading
- LTF: Recommended 1H or 4H for day trading
- CTF: Use for scalping on current chart timeframe
Display Options:
- Display Limit: Maximum number of levels shown per timeframe
- Extension: Short/Current/Max - how far lines extend
- Line Width: Visual prominence (1-5)
- Text Size: Label size adjustment
Mitigation:
- Remove: Delete levels when swept (cleaner chart)
- Show: Keep swept levels visible with reduced opacity
ORDER BLOCKS SETTINGS:
Core Parameters:
- Swing Length (Default: 8): Sensitivity for structure detection
- Show Last X (Default: 4): Number of active blocks displayed
- Violation Check: Choose Wick or Close-based invalidation
- Hide Overlap: Remove overlapping blocks for clarity
PREMIUM/DISCOUNT ZONES:
- Swing Detection Length (Default: 50): Range calculation period
- Longer period = broader zones, more stable
- Shorter period = tighter zones, more reactive
TRADING SESSIONS:
Time Configuration:
- Adjust session times for your timezone
- Use IANA timezone database format recommended
- Days to Show: Historical session display (0-10)
Visualization:
- Session boxes with colored backgrounds
- Optional high/low lines within each session
- Optional open/close lines
- Overlap highlighting when sessions coincide
───────────────────────────────────────
ALERT SYSTEM
───────────────────────────────────────
Available Alerts:
- HTF High Liquidity Hit
- HTF Low Liquidity Hit
Alert Configuration:
1. Enable HTF Liquidity Alerts in settings
2. Select specific alert types (High/Low)
3. Create TradingView alert with "Any alert() function call"
4. Alerts fire once per bar when liquidity is swept
Alert Message Format:
- Event type and description
- Timeframe information
- Current price
- Timestamp
───────────────────────────────────────
RECOMMENDED TIMEFRAME COMBINATIONS
───────────────────────────────────────
Swing Trading:
- Chart: 4H or 1D
- HTF Liquidity: 1D or 1W
- LTF Liquidity: 4H or 1D
Day Trading:
- Chart: 15m or 1H
- HTF Liquidity: 4H or 1D
- LTF Liquidity: 1H or 4H
Scalping:
- Chart: 5m or 15m
- HTF Liquidity: 1H or 4H
- LTF Liquidity: 15m or 1H
- Enable CTF Liquidity
───────────────────────────────────────
PERFORMANCE NOTES
───────────────────────────────────────
This indicator is optimized for performance:
- Uses max_bars_back declarations to limit lookback
- Conditional execution based on toggle settings
- Efficient array management for drawing objects
- Recommended for intraday timeframes only
- Sessions feature requires intraday timeframes
───────────────────────────────────────
EDUCATIONAL DISCLAIMER
───────────────────────────────────────
This indicator identifies areas where institutional orders may be positioned based on historical price action. It uses standard technical analysis techniques:
- Pivot point detection for liquidity levels
- Swing analysis for market structure
- Volume-weighted order block strength
- Time-based session filtering
The indicator does not predict future price movements. Always combine with your own analysis, risk management, and trading plan.
───────────────────────────────────────
USAGE DISCLAIMER
───────────────────────────────────────
This tool is for educational and analytical purposes. Past performance does not guarantee future results. Trading involves substantial risk of loss. Always conduct your own due diligence and never risk more than you can afford to lose.

OG FlowMasterOG FlowMaster is a precision tool designed to detect and visualize Imbalance Zones key areas where price moved inefficiently, leaving behind potential rebalancing points.
By tracking these institutional footprints, OG FlowMaster helps traders anticipate liquidity grabs, reversals, and continuation moves with clarity and confidence.
Whether you trade indices, forex, or commodities, it maps out the zones where price may seek balance between demand and supply turning invisible inefficiencies into visible trading opportunities.
🧠 Trade between the OGs. Master the Flow.

AEON | Liquidity HunterA visual tool for identifying high-probability liquidity zones across multiple timeframes and sessions.
Overview
Liquidity Hunter is a multi-timeframe, all market tool designed to help traders visualise areas where price may be drawn in search of resting liquidity. These liquidity zones often align with swing highs and lows, session extremes, or significant higher-time-frame reference points.
Rather than producing entry or exit signals, this indicator aims to support market behaviour analysis and contextual awareness.
Core Functions
The indicator identifies potential liquidity areas using four optional methods:
1. Current Time Frame Analysis – Automatically locates swing highs and lows based on a customisable setting for sensitivity and lookback depth.
2. Higher Time Frame Analysis – Uses the same logic as above, but projects liquidity zones from a selected higher time frame (HTF).
3. Session Highs & Lows – Highlights the Asian, London, New York, or user-defined session extremes where liquidity commonly pools.
4. Time-Based Highs & Lows – Marks the final bar of any higher time frame (for example, the last H4 or D1 candle) to show potential liquidity reference points.
Each method can be enabled or disabled independently and visually customised, allowing traders to tailor the display to their preferred style and time frame.
How to Use
When applied, the indicator plots horizontal levels representing potential liquidity pools. These levels persist until price engages with or mitigates them, at which point users can opt to modify their visual style or delete them as preferred.
Adjusting the sensitivity of the current and higher time frame levels may reflect the market's likelihood of treating them as targets or reversal points.
Many traders combine these levels with concepts such as market structure shifts, displacement, or fair-value gaps to build a narrative around price behaviour.
Disclaimer
This indicator is provided for educational and informational purposes only. It does not constitute financial advice or a trade signal. Past performance or visual confluence does not guarantee future results.
---
About the Author
Created by a passionate developer focused on algorithmic and quantitative concepts.
2-Stage PSP with SMT [Pogiest]General
Precision Swing Point (PSP) is a concept derived from Quarterly Theory concepts originating from ICT methodologies. The concept typically uses a 3-candle swing formation in which candle 2 has a divergence in the closing price with one asset compared to the other two assets in a correlated asset triad (i.e. one closes bullish and other two closes bearish, vice-versa). A Terminus Price Divergence (TPD) is an additional divergence between candle 1’s closing price and candle 3’s opening price (i.e. one asset’s candle 3 opening price opens below candle 1 closing price while the other two assets’ candle 3 opening price opens above candle 1 closing price, vice-versa). The candle 3 divergence and candle 2 divergence put together is what defines a TPD. Additionally, consecutive candle SMT (Smart Money Technique) are divergences between Candle 1/Candle 2 highs/lows or Candle 2/Candle 3 high/lows. There are different types of cracks in correlation. A crack in correlation can be defined as a precision swing point, a terminus price divergence, SMT, etc. A “2-Stage PSP” can be defined as a confirmed PSP with consecutive candle SMT. Several cracks in correlation can signify a potential reversal, retracement, or continuation.
What makes this indicator unique:
This indicator is designed to track PSP and TPDs in real time as they are forming. It first displays the current state of the current candle’s price action whether bullish or bearish and highlights when a PSP is about to form. Once the PSP is confirmed, the indicator looks for a second crack in correlation between candle 1’s closing price and candle 3’s opening price to confirm a TPD is active. Once the TPD is active, it looks for a crack in correlation via SMT between Candle 1 and Candle 2’s highs/lows or between Candle 2 and Candle 3’s high/lows. The PSP w/ TPD confirmation and SMT divergence would be deemed a “2-Stage PSP” which is all highlighted in the indicator table. Several cracks in correlation can signify a potential reversal, retracement, or continuation.
Note: Credit of concepts/ideas goes to TraderDaye, JacobSpeculates, The Market Lens Team, Afyz, and ICT.
How the Indicator Table Works
Timeframe Column:
1. Displays up to four different timeframes to monitor.
Asset Columns:
1. Cells display “Bull” in green background color or “Bear” in red background color showing the current state of each candle and updates in real-time tick by tick.
-2. Up and Down arrows are fixed in the cells when the TPD status is “Active” (See below) indicating the final print of the PSP candle (candle 2) closing bullish (up arrow) or bearish (down arrow). The arrows will be cleared once the TPD status is either in an “Inactive” or “Pending” state.
TPD Status Column (see defined divergences in General section above):
1. “Inactive” indicates no divergence in all assets (i.e. all three assets in a triad are all printing bullish or bearish candles)
2. “Pending” indicates a potential divergence in candle 2’s closing price (i.e. one asset’s current state in candle 2 is bearish while the others are bullish, vice versa). This updates in real-time tick by tick and continues to monitor each candle as they form for a candle 2 divergence.
3. “Active” indicates a confirmed TPD in which both a candle 2 divergence and candle 3 divergence (i.e. divergence between candle 3 opening price and candle 1 closing price) exists.
Note 1: If candle 2 has an asset in a correlated triad close as a doji candle (opening price and closing price are exactly the same) while the other two assets close bullish or bearish, the indicator will not deem candle 2 as a valid PSP candle. There has to be a divergence in the opening/closing price on at least two assets to be valid.
Note 2: Any historical TPDs will not be displayed in the table as this indicator only tracks TPDs in real time and continuously monitors for potential TPDs and confirmed TPDs.
Added Feature (2 Stage PSP)
SMT 1: Displays an SMT consecutive candle divergence between candle 1 and candle 2’s highs and lows. This is displayed once a TPD is in “Active” status while candle 3 is printing. Therefore, the label in the table cell displays past data (Candle 1 and Candle 2 high/low SMTs).
1. “Inactive” indicates there were no SMT divergences.
2. “Asset symbol names” are displayed with a corresponding up arrow or down arrow. Cell background color is red for SMT Divergence at the highs and green for SMT Divergence at the lows. For example, if there was a bearish SMT at the highs of candle 1/candle 2 and one asset made the higher high in candle 2, then that asset would have the up arrow indicating it swept candle 1’s high while the other assets have the down arrow as they did not sweep candle 1’s high. This works vice versa for bullish scenario.
3. “Both” indicates there are SMT divergences at both the highs and lows of candle 1 and candle 2.
SMT 2: Displays an SMT consecutive candle divergence between candle 2 and candle 3’s highs and lows. This is displayed while a TPD is in “Active” status and updates in real-time tick by tick during candle 3’s price action.
1. “Inactive” indicates there are no current SMT divergences.
2. “Asset symbol names” are displayed with a corresponding up arrow or down arrow. Cell background color is red for SMT Divergence at the highs and green for SMT Divergence at the lows. For example, if there was a bearish SMT at the highs of candle 2/candle 3 and one asset made the higher high in candle 3, then that asset would have the up arrow indicating it swept candle 2’s high while the other assets have the down arrow as they did not sweep candle 2’s high. If one of the assets that did not sweep candle 2’s high ends up sweeping the high, then that asset will dynamically move to the left of the cell next to the asset that swept candle 2’s high with an up arrow leaving only one asset with the down arrow. If the last asset ends up sweeping candle 2’s high, then the cell would change to “Inactive”. This works vice versa for bullish scenario.
3. “Both” indicates there are SMT divergences at both the highs and lows of candle 2 and candle 3. If an SMT on one side gets deleted, then the cell will automatically update to display the SMT that is still intact.
Note: Equal lows/highs are considered to be a failure swing since it did not sweep the previous candle low/high.
Settings
1. Choose up to three different assets to monitor.
Note: If only two are selected, the indicator will only display the two selected and compare the two assets for divergences. If one is selected, a warning sign will be displayed to select at least two assets.
2. Choose up to four different timeframes. Option to deselect timeframes.
3. Option to enable all alerts or active alerts. Alerts include the different status changes in the table (i.e. Pending, Active, Bullish SMT, Bearish SMT, etc for each or all timeframes).
4. Toggle option to show/hide the table. Toggle option to show/hide the “Title Row” which is the first row at the top of the table.
5. Adjust the table positioning to be displayed on the chart.
6. Option to change text size in the table cells. This will also increase/decrease the size of the table.
Unique User Experience:
1. Track current PSP/TPD status in real-time tick by tick as candles form in multiple timeframes.
2. Track consecutive candle SMT in a 3-candle swing formation in real-time in multiple timeframes.
3. Instead of switching through timeframes to check for PSPs/TPDs, they are consolidated in one table.
4. Once there is a confirmed consecutive candle SMT indicated on the table, there are several cracks in correlation (PSP, TPD, and SMT).
Risk Disclaimer
This indicator is for educational and informational purposes only and does not constitute financial advice. All trading and investment decisions remain solely the responsibility of the user.
Trading involves a high degree of risk, and past performance is not indicative of future results.
Always conduct your own research and consult with a qualified financial professional before making any trading decisions.
By using this indicator, users acknowledge they understand these risks and accept full responsibility for their trading decisions and outcomes.

Supply and Demand Scanner Toolkit [TradingFinder]🔵 Introduction
The analytical system presented here is built upon a deep quantitative foundation designed to capture the dynamic behavior of supply and demand in live markets. At its core, it calculates continuously adaptive zones where institutional liquidity, volatility shifts, and momentum transitions converge. These zones are derived from a combination of a regression-based moving average, a long-period ATR, and Fibonacci expansion ratios, all working together to model real-time volatility, price momentum, and the underlying market imbalance.
In practice, this means that at any given moment, five primary bands and seven variable analytical zones are generated around price, representing different market states ranging from extreme overbought to extreme oversold.
Each band reacts dynamically to price volatility, recalibrating with every new candle, which allows the system to mirror the true, constantly changing structure of supply and demand. Every movement between these zones reflects a transition in the strength and dominance of buyers and sellers, a process referred to as volatility-driven price state transitions.
Traditional analytical models often rely on fixed or static indicators that cannot keep up with the rapid microstructural changes in modern markets. This system instead uses regression and smoothing logic to adapt on the fly. By combining a regression moving average with a smoothed moving average, the model calculates real-time trend direction, momentum flow, and trend strength.
When the regression average rises above the smoothed one, the system classifies the trend as bullish; when it falls below, bearish. This dual-layer structure not only helps confirm direction but also enables the automatic detection of critical structural shifts such as Break of Structure (BoS), Change of Character (CHoCH), and directional reversals.
Both the current trend (Live Trend) and projected future trend (Vision Trend) are calculated simultaneously across all available timeframes. This dual analysis allows traders to identify structural changes earlier and to recognize whether a trend is gaining or losing momentum.
In most conventional moving-average-based frameworks, trading signals are delayed because these models react to price rather than anticipate it. As a result, many buy or sell signals appear after the real move has already begun, leading to entries that contradict the current trend. This system eliminates that lag by employing a mean reversion trading model. Instead of waiting for crossovers, it observes how far price deviates from its statistical mean and reacts when that deviation begins to shrink, the moment when equilibrium forces reemerge.
This approach produces non-lagging, data-driven signals that appear at the exact moment price begins to revert toward balance. At the same time, traders can visually assess the market’s condition by observing the spacing, compression, or expansion of the dynamic bands, which represent volatility shifts and trend energy. Through this interaction, the trader can quickly gauge whether a trend is strengthening, losing power, or preparing for a reversal. In other words, the model provides both quantitative precision and intuitive visualization.
A unique visual element in this system is how candles are displayed during transitional states. When Live Trend and Vision Trend contradict each other, for instance, when the current trend is bullish but the projected trend turns bearish, candle bodies automatically appear as hollow.
These hollow candles act as visual alerts for zones of uncertainty or equilibrium between buyers and sellers, often preceding trend reversals, liquidity sweeps, or volatility compression phases. Traders quickly learn to interpret hollow candles as signals to pause, observe, or prepare for potential shifts rather than to act impulsively.
Signal generation in this model occurs when price reverts from extreme zones back toward neutrality. When price exits the strong overbought or strong oversold zones and reenters a milder area, the system produces a reversal signal that aligns with real-time market dynamics. To refine accuracy, these signals are confirmed through several filters, including momentum verification, volatility behavior, and smart money validation. This multi-layered signal logic significantly reduces false entries, helping traders avoid overreactions to temporary liquidity spikes and enhancing performance in volatility-driven markets.
On a broader level, the model supports full multi-timeframe analysis. It can analyze up to twenty symbols simultaneously, across multiple timeframes, to detect directional bias, correlation, and confluence. The result is a holistic map of market structure in real time, showing how each asset aligns or diverges from others and how lower timeframes fit into the macro trend. Variables such as Live Trend, Vision Trend, Directional Strength, and Zone Positioning combine to give a complete structural snapshot at any given moment.
Risk management is handled by an adaptive Trailing Stop Engine that continuously aligns with current volatility and price flow. It integrates pivot mapping with ATR-based calculations to dynamically adjust stop-loss levels as price evolves. The engine offers four adaptive modes, Grip, Flow, Drift, and Glide, each tailored to different levels of market volatility and trader risk tolerance. In visualization, the profit area between entry and stop-loss is shaded light green for long positions and light red for short positions. This design allows immediate recognition of active risk exposure and profit lock-in zones, all in real time.
Altogether, the combination of ATR Volatility Mapping, Fibonacci Band Calibration, Regression-Based Trend Engine, Dynamic Supply and Demand Equilibrium, Conflict Detection through Hollow Candles, Mean Reversion Signal Model, and Adaptive Trailing Stop forms a unified analytical system. It maps the market’s structure, identifies current and future trends, measures the real-time balance of buyers and sellers, and highlights optimal entry and exit points. The final result is higher analytical precision, improved risk control, and a clearer view of the true, data-defined market structure.
🔵 How to Use
Analyzing supply and demand in live financial markets is one of the most complex challenges traders face. Price rarely moves in a straight line; instead, it evolves through phases of expansion, compression, and redistribution. Many traders misinterpret these movements because the zones that appear strong or reactive at first glance often represent nothing more than temporary liquidity redistributions.
These areas, while visually convincing, may lose relevance quickly when volatility increases or when viewed from another timeframe. In high-volatility environments, traditional zone analysis becomes even more unreliable. Price may seem to respect a support or resistance level only to break through it a few candles later. This behavior creates false zones and misleading reversal points.
The key to filtering such movements lies in understanding the context, how volatility, momentum, and structural flow interact across different timeframes. A single timeframe can only tell part of the story. The market’s true structure emerges only when data is synchronized from macro to micro levels.
This is where multi-timeframe correlation becomes essential. Every timeframe offers a different lens through which supply and demand balance can be observed. For example, a trader might see a bullish setup on a 15-minute chart while the 4-hour chart is still showing a strong distribution phase. Without alignment between these layers, trades are easily positioned against the dominant liquidity flow. The model presented here solves this by processing all relevant timeframes simultaneously, allowing traders to see how short-term movements fit within higher-level structures.
Each market phase, whether accumulation, expansion, or reversion, carries a unique volatility fingerprint. The system tracks transitions in volatility regimes, momentum divergence, and structural breakouts to anticipate when a phase change is approaching. For instance, when volatility compresses and ATR readings narrow, it often signals an upcoming breakout or reversal. By monitoring these shifts in real time, the model helps the trader differentiate between liquidity grabs (temporary volatility spikes) and genuine structural changes.
Every supply-demand interaction within this system is adaptive rather than static. The zones continuously recalibrate based on live parameters such as price velocity, momentum distribution, and liquidity displacement. This adaptive structure ensures that the balance between buyers and sellers is represented accurately as market conditions evolve.
In practice, this allows the user to identify early signs of trend exhaustion, potential reversals, and continuation patterns long before traditional indicators would react.
In essence, successful supply and demand analysis requires moving beyond subjective interpretation toward data-driven decision-making.
Manual drawing of zones or relying solely on visual intuition can lead to inconsistent results, especially in fast-changing markets. By combining ATR-driven volatility mapping, mean reversion dynamics, and multi-timeframe alignment, this framework offers a clear, objective, and responsive model of how market forces actually operate. Each decision becomes grounded in measurable context, not assumptions.
The analytical interface is divided into two main sections : the visual chart framework and the scanner data table.
On the chart, five dynamic bands and seven analytical zones appear around price. These are calculated from ATR, regression moving average, and Fibonacci expansion ratios to define whether the market is overbought, oversold, or neutral. Each zone has distinct color coding, allowing traders to recognize the market state instantly without switching tools or indicators.
Price movement within these bands reveals more than just direction, it tells a story of volatility, liquidity flow, and market equilibrium. The upper zones typically indicate exhaustion of buying pressure, while lower zones highlight areas of overselling or potential recovery. The way price reacts near these boundaries can help determine whether a continuation or reversal is likely.
At the heart of the visualization are two layered trend components : Live Trend and Vision Trend.
The Live Trend shows the present market direction based on regression and smoothing logic, while the Vision Trend projects the probable future trajectory by analyzing slope deviation and momentum displacement. When these two align, the trader sees confirmation of market strength. When they diverge, candle bodies turn hollow, a simple yet powerful visual alert signaling hesitation, consolidation, or a possible turning point.
At the bottom of the interface, the Scanner Table organizes all analytical data into a structured display. Each row corresponds to a symbol and timeframe, showing the current Live Trend, Vision Trend, Directional Strength, Zone Position, and Signal Age. This table provides a real-time overview of all assets being tracked, showing which ones are trending, which are in reversal, and which are entering transition zones. By analyzing this table, traders can instantly identify correlation clusters, where multiple assets share the same trend direction, often a sign of broader market sentiment shifts.
The Scanner can simultaneously process multiple timeframes and up to twenty different assets, producing a panoramic market overview. This makes it easy to apply a top-down analytical workflow, starting with higher timeframe alignment, then drilling down into lower levels for execution. Instead of reacting to isolated signals, traders can see where confluence exists across structures and focus only on setups that align with overall market context.
The bands and their color coding make interpretation intuitive even for less experienced users. Darker shades correspond to extreme zones, typically where institutional orders are being absorbed or distributed, while lighter zones mark mild overbought or oversold conditions. When price transitions from an outer extreme zone into a milder region, a signal condition becomes active. At this point, traders can cross-check the event using momentum and volatility filters before acting.
The trailing stop section of the display adds another critical dimension to decision-making. It visualizes stop levels as continuously updating colored lines that follow price movement. These levels are calculated dynamically through pivot mapping and ATR-based sensitivity. The shaded area between the entry point and active stop loss (light green for buys, light red for sells) gives traders immediate insight into how much of the move is currently secured as profit and how much remains exposed. This simple visual cue transforms risk management from a static calculation into a living, responsive process.
All components of this analytical system are fully customizable. Users can adjust signal type, calculation periods, smoothing intensity, and band sensitivity to match their trading style. For example, a scalper might shorten ATR and MA periods to capture rapid fluctuations, while a swing trader might increase them for smoother and more stable readings. Because every element responds to live data, even small adjustments lead to meaningful changes in how the system behaves.
When combined with the scanner’s data table, these features enable a top-down analytical workflow, one where decisions are not made from isolated indicators but from a complete, multi-dimensional understanding of market structure. The result is a system that supports both reactive precision and proactive market awareness.
🟣 Long Signal
A long signal is generated when price begins to rebound from deeply oversold conditions. More precisely, when price enters the strong or extreme oversold zones and then returns into the mild oversold region, the system identifies the start of a mean reversion phase. This transition is not based on subjective interpretation but on mathematical deviation from equilibrium, meaning that selling pressure has been exhausted and liquidity begins to shift toward buyers.
Unlike delayed signals that depend on moving average crossovers or oscillators, this signal appears the moment price starts moving back toward balance. The model’s mean reversion logic detects when volatility contraction and momentum realignment coincide, producing a non-lagging entry condition.
In this situation, traders can visually confirm the setup by observing the spacing and curvature of the lower bands. When the lower volatility bands begin to flatten or curve upward while ATR readings stabilize, it indicates that the market is transitioning from distribution to accumulation.
The strength and quality of each long signal depend on the configuration of trend variables. When both Live Trend and Vision Trend are bullish, the probability of continuation is significantly higher. This alignment suggests that the market’s short-term momentum is supported by long-term structure. On the other hand, when the two trends contradict each other, which the chart highlights with hollow candles, it represents a temporary phase of indecision or conflicting forces.
In these moments, traders are encouraged to monitor volatility compression and observe whether the next few candles confirm a real breakout or revert back to range conditions.
Additional confirmation can be derived from observing the slope of the regression moving average and the magnitude of ATR fluctuations. A steeper upward slope combined with decreasing volatility indicates stronger bullish intent. In contrast, if ATR expands while price remains flat, it signals potential traps or fakeouts driven by short-term liquidity grabs.
Valid long signals often emerge near the end of volatility compression periods or immediately after liquidity sweeps around major lows. These are points where large players typically absorb remaining sell orders before initiating upward movement. Once the long condition triggers, the system automatically calculates the initial stop loss using a combination of recent pivots and ATR range. From that point, the Trailing Stop Engine dynamically adjusts as price rises, maintaining optimal distance from the entry point and locking in profits without restricting trade potential.
For educational context, consider a situation where the market has been trending downward for several sessions, and the ATR value begins to decline, showing that volatility is compressing. As price touches the lower extreme zone and reverses into the mild oversold region while Live Trend starts turning positive, this creates an ideal long condition. A new cycle of expansion often begins right after such compression, and the system captures that early shift automatically.
🟣 Short Signal
A short signal represents the opposite scenario, a point where buying momentum weakens after a strong rally, and price begins to revert downward toward equilibrium. When price exits the strong or extreme overbought zones and moves into the mild overbought region, the model detects the start of a bearish mean reversion phase.
Here too, the signal appears without delay, as it is based on the real-time relationship between price and its volatility boundaries rather than on indicator crossovers.
The system identifies these short conditions when upward momentum shows visible fatigue in the volatility bands. The upper bands start to flatten or turn downward while the regression slope begins to lose angle. This is often accompanied by rising ATR readings, showing an expansion in volatility that reflects distribution rather than continuation.
The quality of the short signal is strongly influenced by the interaction between the two trend layers. When both Live Trend and Vision Trend point downward, the likelihood of sustained bearish continuation increases dramatically. However, if they diverge, candle bodies turn hollow, clearly marking zones of conflict or hesitation. These phases often coincide with the end of a bullish impulse wave and the start of an early correction.
A practical example can illustrate this clearly. Imagine a market that has been trending upward for several days with expanding volatility. When price pushes into the extreme overbought zone and starts pulling back into the mild region, the system interprets it as the first sign of distribution. If at the same time the regression moving average flattens and ATR begins to rise, it strongly suggests that institutional participants are taking profit. The generated short signal allows the trader to position early in anticipation of the downward reversion that follows.
The initial stop loss for short trades is calculated above the most recent pivot high, ensuring logical protection based on the structural context. From there, the Trailing Stop Engine automatically tracks the price movement downward, tightening stops as volatility decreases or expanding them during sharp swings to avoid premature exits.
The engine’s dynamic nature makes it suitable for both aggressive scalpers and patient swing traders. Scalpers can set the trailing sensitivity to “Grip” mode for tighter control, while swing traders can use “Glide” mode to capture larger portions of the trend.
Most short signals form right after volatility expansion or liquidity grabs around major highs, classic exhaustion areas where momentum divergence becomes evident. The combination of visual cues (upper band curvature, hollow candles, ATR spikes) provides traders with multiple layers of confirmation before taking action.
In both long and short scenarios, this analytical system replaces emotional decision-making with structured interpretation. By translating volatility, momentum, and price positioning into clear contextual patterns, it empowers the trader to see where reversals are forming in real time rather than guessing after the move has started.
🔵 Setting
🟣 Logical Setting
Channel Period : The main channel period that defines the base moving average used to calculate the central line of the bands. Higher values create a smoother and longer-term structure, while lower values increase short-term sensitivity and faster reactions.
Channel Coefficient Period : The ATR period used to measure volatility for determining the channel width. Higher values provide greater channel stability and reduce reactions to short-term market noise.
Channel Coefficient : The ATR sensitivity factor that defines the distance of the bands from the central average. A higher coefficient widens the bands and increases the probability of detecting overbought or oversold conditions earlier.
Band Smooth Period : The smoothing period applied to the bands to filter minor price noise. Lower values produce quicker reactions to price changes, while higher values create smoother and more stable lines.
Trend Period : The period used in the regression moving average calculation to identify overall trend direction. Shorter values highlight faster trend shifts, while longer values emphasize broader market trends.
Trend Smooth Period : The smoothing period for the regression trend to reduce volatility and confirm the dominant market direction. This setting helps to better distinguish between corrective and continuation phases.
Signals Gap : The time interval between generated signals to prevent consecutive signal clustering. A higher value strengthens the temporal filter and produces more selective and refined signals.
Bars to Calculate : Defines the number of historical candles used in calculations. Limiting this value optimizes script performance and reduces processing load, especially when multiple symbols or timeframes are analyzed simultaneously. Higher values increase analytical depth by including more historical data, while lower values improve responsiveness and reduce potential lag during live chart updates.
Trailing Stop : Enables or disables the dynamic trailing stop engine. When active, the system automatically adjusts stop loss levels based on live volatility and price structure, maintaining alignment with market flow and trend direction.
Trailing Stop Level : Defines the operational mode of the trailing stop engine with four adaptive styles: Grip, Flow, Drift, and Glide. Grip offers tight stop management for scalping and high precision setups, while Glide allows wider flexibility for swing or long-term trades.
Trailing Stop Noise Filter : Applies an additional filtering layer that smooths minor fluctuations and prevents unnecessary stop adjustments caused by short-term market noise or micro volatility.
🟣 Display Settings
Show Trend on Candles : Displays the current trend direction directly on price candles by applying dynamic color coding. When Live Trend and Vision Trend align bullish, candles appear in green tones, while bearish alignment displays in red. If the two trends conflict, candle bodies turn hollow, marking a Trend Conflict Zone that signals potential indecision or upcoming reversal. This feature provides instant visual confirmation of market direction without the need for external indicators
Table on Chart : Allows users to choose whether the analytical table appears directly over the chart or positioned below it. This gives full control over screen layout based on personal workspace preference and chart design.
Number of Symbols : Controls how many symbols are displayed in the screener table, adjustable from 10 up to 20 in steps of 2. This flexibility helps balance between detailed screening and visual clarity on different screen sizes.
Table Mode : Defines how the screener table is visually arranged.
Basic Mode : Displays all symbols in a single column for vertical readability.
Extended Mode : Arranges symbols side by side in pairs to create a more compact and space-efficient layout.
Table Size : Adjusts the visual scaling of the table. Available options include auto, tiny, small, normal, large, and huge, allowing traders to optimize table visibility based on their screen resolution and preferred chart density.
Table Position : Determines the exact placement of the screener table within the chart interface. Users can select from nine available alignments combining top, middle, and bottom vertically with left, center, and right horizontally.
🟣 Symbol Settings
Each of the 10 available symbol slots includes a full range of adjustable parameters for personalized analysis.
Symbol : Defines or selects the asset to be tracked in the screener, such as XAUUSD, BTCUSD, or EURUSD. This enables multi-asset scanning across different markets including forex, commodities, indices, and crypto.
Timeframe : Sets the specific timeframe for analysis for each selected symbol. Examples include 15 minutes, 1 hour (60), 4 hours (240), or 1 day (1D). This flexibility ensures precise control over how each asset is monitored within the multi-timeframe structure.
🟣 Alert Settings
Alert : Enables alerts for AAS.
Message Frequency : Determines the frequency of alerts. Options include 'All' (every function call), 'Once Per Bar' (first call within the bar), and 'Once Per Bar Close' (final script execution of the real-time bar). Default is 'Once per Bar'.
Show Alert Time by Time Zone : Configures the time zone for alert messages. Default is 'UTC'.
🔵 Conclusion
Understanding financial markets requires more than indicators, it demands a framework that captures the interaction of price, volatility, and structure in real time. This analytical system achieves that by combining mean reversion logic, volatility mapping, and dynamic supply and demand modeling into an adaptive, data-driven environment. Its computational bands and trend layers visualize market intent, showing when momentum is strengthening, fading, or preparing to shift.
Each signal, derived from statistical equilibrium rather than delayed indicators, reflects the exact moment when the balance between buyers and sellers changes. Variables like Live Trend, Vision Trend, Directional Strength, and ATR-based Volatility Context help traders assess signal quality and alignment across multiple timeframes. The system blends automation with human interpretation, preserving macro-to-micro consistency and enabling confident entries, exits, and stop management through its adaptive Trailing Stop Engine.
Every component, from color-coded zones to hollow candles, forms part of a broader narrative that teaches traders to read the market’s language instead of reacting to it. Built on self-correcting analysis, the framework continuously recalibrates with live data. By transforming volatility, liquidity, and price behavior into structured insight, it empowers traders to move from reaction to prediction, a living ecosystem that evolves with both the market and the trader.
Paid script

Auto HTF Candles [@gaucho_trader][Auto HTF Candles
(Title)
Tired of constantly switching between timeframes? 🔄 This indicator solves that problem by bringing Higher Timeframe (HTF) context directly onto your current chart.
Auto HTF Candles plots up to three different sets of HTF candles in a clean, non-intrusive panel on the right side of your screen. Now you can watch a 4H candle develop while analyzing price action on a 5-minute chart, all in one view.
Core Concept 🎯
The principle is simple: your lower timeframe (LTF) trading decisions become significantly more powerful when aligned with the HTF trend and structure. By displaying the live HTF candles, you can instantly see if the current LTF move is a weak pullback against a strong HTF candle or a powerful breakout from an HTF consolidation. This indicator provides that essential macro context without ever leaving your main chart.
Key Features 📊
📈 Display Multiple Timeframes: Plot up to three fully independent higher timeframes simultaneously (e.g., 15m, 1H, and 4H).
🤖 Automatic HTF Selection: Enable the "Auto-Adjust HTF 1" feature, and the script will intelligently select a logical higher timeframe for you based on your current chart.
⏳ Real-Time Countdown Timer: Each timeframe displayed includes a timer showing the exact time remaining until the current HTF candle closes. This is crucial for anticipating end-of-candle volatility.
🎨 Fully Customizable Appearance: You have complete control over the visual style. Adjust colors, candle width, spacing, and the padding from the live price.
✨ Clean & Organized Layout: The candles are neatly arranged to the right of the current price, ensuring your main chart remains clear and unobstructed.
How to Use It 💡
Context is King: Use the HTF candles to define your bias. If the 4H candle is strongly bullish, you can look for more confident long entries on your 5m chart.
Identify Key Levels in Real-Time: Watch the highs and lows of the HTF candles as they form. These levels often act as powerful intraday support and resistance.
Anticipate Reversals: Is the 1H candle approaching its close and printing a long upper wick? This could signal a potential reversal, giving you a heads-up before the pattern is obvious on the LTF.
Streamline Your Workflow: Use the "Auto-Adjust" feature for a dynamic analysis setup. As you switch between different charts, your most relevant HTF context will follow you automatically.
Main Settings ⚙️
HTF 1, 2, 3: Enable and select up to three custom timeframes and set how many recent candles you want to display for each.
Auto-Adjust HTF 1: The star of the show. Toggle this on to let the script automatically select the first HTF based on your chart's period.
Styling: A comprehensive section to modify all colors, candle width, and the spacing between candles and timeframes.
Label Settings: Independently control the visibility, color, and size of the HTF name labels and the countdown timers.
⚠️ Disclaimer
This indicator is a tool for market analysis and should not be considered financial advice. Trading involves significant risk. Always perform your own due diligence before making any trading decisions.
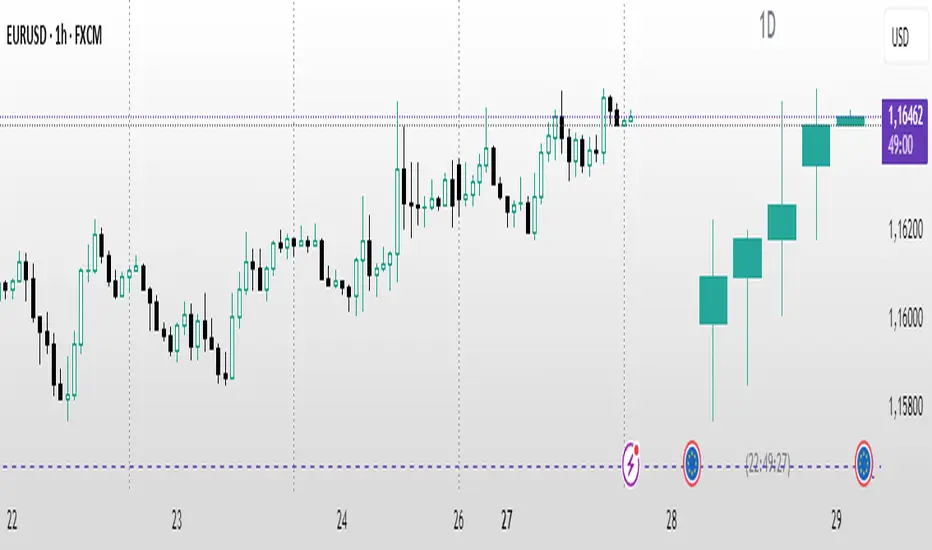
Automatic Higher Timeframe Dividers [@gaucho_trader]🧭 Overview
The HTF Separators (auto) indicator automatically draws vertical lines marking the start of each candle belonging to a higher–timeframe (HTF).
This allows you to visually identify the boundaries of higher–timeframe candles within your current chart — an essential concept for multi–timeframe (MTF) analysis.
For example:
On a 15-minute chart, each line marks the start of a new 4-hour candle.
On a 1-hour chart, the lines show where each daily candle begins.
On a daily chart, they highlight the start of each month.
These vertical separators help you recognize moments when price often reacts or shifts, since the open of a new higher-timeframe candle frequently aligns with impulses, reversals, or structural changes.
⚙️ Main Features
✅ Automatic timeframe mapping:
1m → 15m
3m → 30m
5m → 1H
15m → 4H
1H → 1D
4H → 1W
1D → 1M
✅ Full customization:
Line color
Line width
Style (solid, dashed, or dotted)
✅ Optional HTF label:
Display a small label showing the detected higher timeframe (e.g. “HTF: 4H”).
🧩 How to use
Add the indicator to your chart.
Adjust the color, width, and style to your preference.
(Optional) Enable the label to display the current HTF being tracked.
Watch how vertical lines automatically appear whenever a new higher-timeframe candle starts.
This helps you align your trades and analysis with higher-timeframe structure, giving you a clearer understanding of market cycles and timing.
💡 Practical Example
If you trade on a 15-minute chart, each separator line represents the start of a 4-hour candle.
Use it to:
Understand the context of your current candle within the larger trend.
Spot key reaction points at HTF opens.
Time entries and exits around HTF shifts.
🧠 Best for
Traders using multi-timeframe analysis (MTF)
Intraday and swing traders seeking better HTF alignment
Anyone wanting a cleaner and more structured chart view
📈 Automatic Higher Timeframe Dividers is a lightweight, practical tool that brings clarity and temporal precision to your technical analysis — helping you instantly see where each major candle begins on your chart.

ICT SMART MONEY__Advanced Multi-Timeframe Target TREND indicator with comprehensive ICT (Inner Circle Trader) concepts, session analysis, and smart money concepts for professional forex and crypto trading.__
---
### __🔥 Core Features:__
#### __📈 Multi-Timeframe Analysis__
- __7 Timeframe Table__: 1min, 5min, 15min, 30min, 1hour, 4hour, Daily analysis
- __Target System__: Stop Loss, Entry, TP1, TP2, TP3 calculations for each timeframe
- __Trend Direction__: Visual arrows showing bullish/bearish bias across all timeframes
#### __⚡ ICT Killzone Sessions__
- __4 Major Sessions__: Asia KZ, London KZ, NY AM, NY PM with colored session boxes
- __Pivot Lines__: Automatic high/low detection with full format labels ("ASIA High", "LONDON Low")
- __Global Label Alignment__: All session labels perfectly aligned for professional appearance
- __Range Analytics__: Real-time pip calculations with historical averages and Turkish volatility analysis
#### __🌍 Trading Session Management__
- __Individual Controls__: Asia/London sessions auto-enabled, NY sessions optional
- __Horizontal Lines__: Clean session high/low tracking without clutter
- __NY Lunch Session__: Additional 11:30-13:30 session for advanced analysis
- __Session Transparency__: Adjustable transparency levels for optimal chart visibility
#### __📍 Professional Key Levels__
- __Monday High/Low__: Weekly opening reference levels
- __Previous Day High/Low__: Daily support/resistance zones
- __Previous Week High/Low__: Major weekly levels
- __Full Format Labels__: "Previous Day High" instead of "PDH" for crystal clarity
- __160 Bar Distance__: Optimized label positioning for clean charts
#### __🔗 Liquidity Trendlines__
- __Automatic Detection__: 8-bar lookback pivot detection system
- __Breakout Signals__: Visual alerts when trendlines are broken
- __Dynamic Padding__: 4.0 ATR-based trendline spacing
- __Bullish/Bearish Colors__: Clear color coding for trend direction
#### __💎 Smart Money Concepts (SMC)__
- __Fair Value Gaps (FVG)__: Automatic gap detection with mitigation tracking
- __Structure Analysis__: BOS (Break of Structure) and CHoCH (Change of Character) detection
- __Structure Fibonacci__: 5-level fibonacci retracements (78.6%, 70.5%, 61.8%, 50%, 38.2%)
- __Lifecycle Management__: Complete FVG and structure history tracking
#### __📊 Range Analytics Table__
- __Session Volatility__: Current pip movement vs historical averages
- __Turkish Analysis__: "Güçlü Momentum", "Yüksek Aktivite", "Normal Aktivite", "Düşük Hareket", "Zayıf Session"
- __Integrated Display__: Seamlessly positioned below multi-timeframe table
- __Professional Formatting__: Color-coded session identification with status analysis

Previous Period High/Low LevelsThis indicator plots the previous day, week, and month high and low levels to highlight key liquidity levels.
Perfect for traders using market structure, liquidity, or SMC concepts.
Features:
Auto-plots PDH/PDL, PWH/PWL, and PMH/PML
Adjustable line styles, widths, and label sizes
Toggle price display on or off
Accurate UTC offset handling

IPDA Ranges – ProIPDA Ranges – Pro
This indicator plots Institutional Price Delivery Algorithm (IPDA) ranges based on lookback periods of 20, 40, and 60 days, as taught by ICT (Inner Circle Trader). It visualizes premium and discount zones, equilibrium levels, quadrants, and sub-quadrants to help traders identify key price areas and potential market biases.
Key Features:
- Displays IPDA ranges as boxes or lines, with customizable colors for discount, equilibrium, and premium zones.
- Optionally shades the 25%-75% mid-zone for each range.
- Supports quadrants (25% steps) and sub-quadrants with lines and labels for detailed price segmentation.
- Includes a table displaying either discount/premium status or percentage from equilibrium for each range.
- Configurable alerts for entry/exit into the mid-zone.
- Visual options include line styles, label sizes, price display on labels, and buffers for zone extension.
Settings Overview:
- IPDA Intervals: Enable/disable IPDA20, IPDA40, IPDA60; toggle quadrants, sub-quadrants, mid-zone shading, and drawing with lines vs. boxes.
- Colors and Styles: Customize colors for zones, lines, labels; select solid/dotted/dashed styles for borders and lines.
- Appearance: Adjust label and table sizes, table position, and background opacity.
- Labels: Show/hide per-range labels and include prices.
- Alerts: Enable mid-zone entry/exit alerts.
Usage:
Add the indicator to your chart and select the desired IPDA intervals. The ranges update dynamically based on daily highs and lows. Use the table for quick reference to current positioning (discount/premium or percentage). The mid-zone shading helps identify consolidation areas, while quadrants and sub-quadrants assist in pinpointing potential support/resistance levels.
© MadMonkTrading


Vault FX Time + Price Indicator v1Collection of tools for analysis:
- Midnight Open Horizontal Price Line
- 09:30 Open Horizontal Price Line
- Midnight and 09:30 Vertical Price Lines
- NWOG painter
- Asia Range Box
- Asia Range H/L lines (Lines extend until purged or 10:00 AM NY, whichever occurs first)
- Asia Range Standard Deviation Levels (Customizable)
- Day Separators
- PDH/PDL | PWH/PWL | PMH/PML Lines w/ Alerts
- First Presented FVG for NY-AM Session (1min Chart)
- Timeframe Specific Swing High/Low Sweeps w/ Alerts (Requires user setup)
Some features are still being tested, let me know if you find any bugs!

Timeframe LiquidityTimeframe Liquidity – Multi-Timeframe Highs & Lows by
Timeframe Liquidity automatically plots previous day, week, month, and year highs and lows, key liquidity zones used by smart money and price-action traders. These levels extend into the future and can automatically stop once price wicks through, showing clear liquidity sweeps and tested zones.
Perfect for traders using ICT / SMC concepts, liquidity theory, or market structure analysis. Instantly see where liquidity rests, where it’s been taken, and how price reacts at major support and resistance.
Features:
Auto-plots PDH/PDL, PWH/PWL, PMH/PML, PYH/PYL
Custom line styles, colors, and label sizes
Option to stop line on wick (liquidity sweep)
Smart timeframe visibility (hides same-TF levels)
Accurate UTC offset handling
Identify liquidity pools fast, trade cleaner charts, and track where smart money hunts liquidity.
Built for precision, clarity, and confluence.
