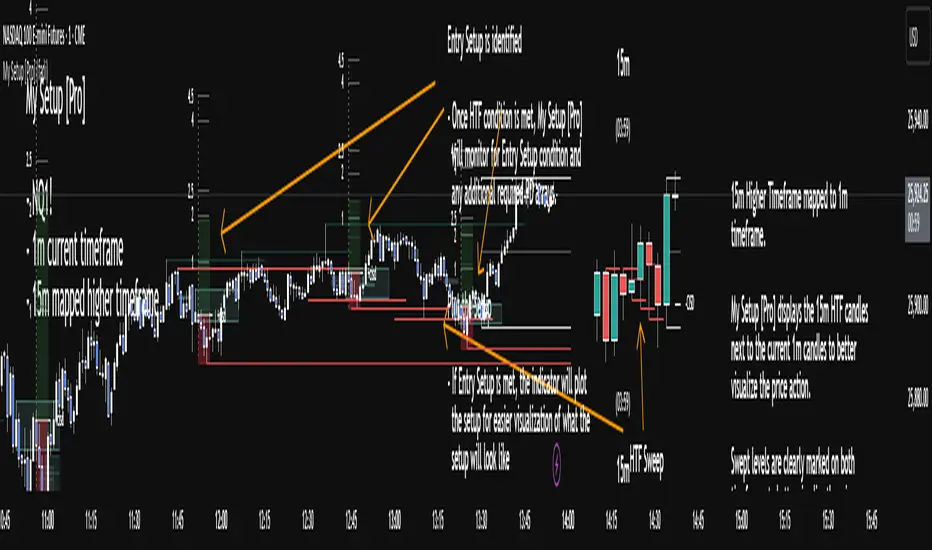
My setup [Pro] (fadi)My Setup is a powerful TradingView indicator that visualizes your trading strategy, helping you find high-probability setups with precision and discipline. It combines Higher Timeframe (HTF) context with Lower Timeframe (LTF) entries on a single chart, streamlining your trading process.
What It Does
Tracks your chosen timeframe and its paired higher timeframe for custom trade setups, so you don’t have to stay glued to the screen.
Plots clear Entry, Stop Loss, and Take Profit levels when your conditions align.
Customizes to your strategy with HTF triggers (e.g., sweeps, liquidity grabs) and LTF entries (e.g., Order Blocks, FVGs, Breakers).
Ensures discipline by only showing setups that meet all your rules, eliminating emotional trading and FOMO.
Backtest your edge by visualizing past setups to refine entries, stops, and confluences.
How It Works
Set Your HTF Trigger: Choose a market event like a sweep of a high/low, pivot point, or liquidity grab on the paired higher timeframe (e.g., 1H for a 5m chart).
Define Your LTF Entry: Select your entry model from a range of institutional concepts, such as Order Block, Fair Value Gap (FVG), Inverted FVG (iFVG), Breaker Block, Unicorn Model, and more, on the chart’s timeframe.
Add Confluence Filters: Stack conditions like requiring an FVG + Breaker for higher-probability setups.
See It on Your Chart: When a setup forms, it’s instantly plotted with Entry, Stop Loss, and Take Profit levels based on your Risk-to-Reward ratio.
Key Features
Multi-Timeframe Sync: Pair your chart’s timeframe (e.g., 5m) with a higher timeframe (e.g., 1H) for seamless analysis.
Institutional Tools: Supports a comprehensive suite of ICT concepts, including Order Blocks, FVGs, iFVGs, Breakers, Unicorn Model, and additional entry models.
Custom Risk Management: Set your Stop Loss and Take Profit levels with fixed R:R or measured moves using large range of entry and stop levels.
Session Filtering: Limit setups to specific trading sessions (e.g., London, New York) with timezone support.
Visual Clarity: Displays HTF candles and key levels on your chart for context, with customizable colors and styles.
Alerts: Get notified the moment a valid setup appears, even on live candles.
Who It’s For
Traders who want to systematize their ICT-based strategy on a single chart.
Those seeking to trade with discipline and avoid impulsive decisions.
Anyone looking to backtest and optimize their setups with clear, visual feedback.
Busy traders who need a tool to track their chart while they focus on life.
Why Choose My Setup ?
Save Time: Let the indicator track your chart and its paired timeframe.
Trade Confidently: Only take A+ setups that match your exact rules.
Learn and Improve: Analyze historical setups to refine your strategy.
Disclaimer of Warranties and Limitation of Liability for [My Setup ]
Please read this disclaimer carefully before using the [My Setup ] indicator (hereafter referred to as "the Software").
1. No Financial Advice
The Software is provided for educational and informational purposes only. The data, calculations, and signals generated by the Software are not, and should not be interpreted as, financial advice, investment advice, trading advice, or a recommendation or solicitation to buy, sell, or hold any security or financial instrument.
2. Assumption of Risk You acknowledge that trading and investing are inherently risky activities that carry a high potential for significant financial loss. All actions you take in the market, including but not limited to trade execution and risk management, are your sole responsibility. You agree to use the Software at your own sole risk. The creator shall not be held responsible or liable for any financial losses or damages you may incur as a result of using the Software.
3. No Warranty; "AS IS" Provision
The Software is provided "AS IS" and "AS AVAILABLE", without any warranties of any kind, either express or implied. The creator disclaims all warranties, including, but not limited to, implied warranties of merchantability, fitness for a particular purpose, accuracy, timeliness, completeness, and non-infringement.
The creator does not warrant that the Software will be error-free, uninterrupted, secure, or free of bugs, viruses, or other harmful components. You acknowledge that software is never wholly free from defects, and you are responsible for implementing your own procedures for data accuracy and security.
4. Limitation of Liability
TO THE MAXIMUM EXTENT PERMITTED BY APPLICABLE LAW, IN NO EVENT SHALL THE CREATOR, FADI ZEIDAN, BE LIABLE FOR ANY CLAIM, DAMAGES, OR OTHER LIABILITY, WHETHER IN AN ACTION OF CONTRACT, TORT, OR OTHERWISE, ARISING FROM, OUT OF, OR IN CONNECTION WITH THE SOFTWARE OR THE USE OR OTHER DEALINGS IN THE SOFTWARE.
This limitation of liability applies to any and all damages, including but not limited to:
Direct, indirect, incidental, special, consequential, or exemplary damages.
Loss of profits, revenue, data, or use.
Financial losses resulting from trading decisions made based on the Software.
Damages arising from software defects, interruptions, or inaccuracies.
5. Indemnification
You agree to indemnify, defend, and hold harmless the creator, Fadi Zeidan, from and against any and all claims, liabilities, damages, losses, or expenses, including reasonable attorneys' fees and costs, arising out of or in any way connected with your access to or use of the Software.
6. Acknowledgment and Agreement
By accessing, installing, or using the [My Setup ] indicator, you acknowledge that you have read, understood, and agree to be bound by the terms of this disclaimer. If you do not agree with these terms, you must not use the Software.
Ict
Momentum-Based Fair Value Gaps [BackQuant]Momentum-Based Fair Value Gaps
A precision tool that detects Fair Value Gaps and color-codes each zone by momentum, so you can quickly tell which imbalances matter, which are likely to fill, and which may power continuation.
What is a Fair Value Gap
A Fair Value Gap is a 3-candle price imbalance that forms when the middle candle expands fast enough that it leaves a void between candle 1 and candle 3.
Bullish FVG : low > high . This marks a bullish imbalance left beneath price.
Bearish FVG : high < low . This marks a bearish imbalance left above price.
These zones often act as magnets for mean reversion or as fuel for trend continuation when price respects the gap boundary and runs.
Why add momentum
Not all gaps are equal. This script measures momentum with RSI on your chosen source and paints each FVG with a momentum heatmap. Strong-momentum gaps are more likely to hold or propel continuation. Weak-momentum gaps are more likely to fill.
Core Features
Auto FVG Detection with size filters in percent of price.
Momentum Heatmap per gap using RSI with smoothing. Multiple palettes: Gradient, Discrete, Simple, and scientific schemes like Viridis, Plasma, Inferno, Magma, Cividis, Turbo, Jet, plus Red-Green and Blue-White-Red.
Bull and Bear Modes with independent toggles.
Extend Until Filled : keep drawing live to the right until price fully fills the gap.
Auto Remove Filled for a clean chart.
Optional Labels showing the smoothed RSI value stored at the gap’s birth.
RSI-based Filters : only accept bullish gaps when RSI is oversold and bearish gaps when RSI is overbought.
Performance Controls : cap how many FVGs to keep on chart.
Alerts : new bullish or bearish FVG, filled FVG, and extreme RSI FVGs.
How it works
Source for Momentum : choose Returns, Close, or Volume.
Returns computes percent change over a short lookback to focus on impulse quality.
RSI and Smoothing : RSI length and a small SMA smooth the signal to stabilize the color coding.
Gap Scan : each bar checks for a 3-candle bullish or bearish imbalance that also clears your minimum size filter in percent of price.
Heatmap Color : the gap is painted at creation with a color from your palette based on the smoothed RSI value, preserving the momentum signature that formed it.
Lifecycle : if Extend Unfilled is on, the zone projects forward until price fully trades through the far edge. If Auto Remove is on, a filled gap is deleted immediately.
How to use it
Scan for structure : turn on both bullish and bearish FVGs. Start with a moderate Min FVG Size percent to reduce noise. You will see stacked clusters in trends and scattered singletons in chop.
Read the colors : brighter or stronger palette values imply stronger momentum at gap formation. Weakly colored gaps are lower conviction.
Decide bias : bullish FVGs below price suggest demand footprints. Bearish FVGs above price suggest supply footprints. Use the heatmap and RSI value to rank importance.
Choose your playbook :
Mean reversion : target partial or full fills of opposing FVGs that were created on weak momentum or that sit against higher timeframe context.
Trend continuation : look for price to respect the near edge of a strong-momentum FVG, then break away in the direction of the original impulse.
Manage risk : in continuation ideas, invalidation often sits beyond the opposite edge of the active FVG. In reversion ideas, invalidation sits beyond the gap that should attract price.
Two trade playbooks
Continuation - Buy the hold of a bullish FVG
Context uptrend.
A bullish FVG prints with strong RSI color.
Price revisits the top of the gap, holds, and rotates up. Enter on hold or first higher low inside or just above the gap.
Invalidation: below the gap bottom. Targets: prior swing, measured move, or next LV area.
Reversion - Fade a weak bearish FVG toward fill
Context range or fading trend.
A bearish FVG prints with weak RSI color near a completed move.
Price fails to accelerate lower and rotates back into the gap.
Enter toward mid-gap with confirmation.
Invalidation: above gap top. Target: opposite edge for a full fill, or the gap midline for partials.
Key settings
Max FVG Display : memory cap to keep charts fast. Try 30 to 60 on intraday.
Min FVG Size % : sets a quality floor. Start near 0.20 to 0.50 on liquid markets.
RSI Length and Smooth : 14 and 3 are balanced. Increase length for higher timeframe stability.
RSI Source :
Returns : most sensitive to true momentum bursts
Close : traditional.
Volume : uses raw volume impulses to judge footprint strength.
Filter by RSI Extremes : tighten rules so only the most stretched gaps print as signals.
Heatmap Style and Palette : pick a palette with good contrast for your background. Gradient for continuous feel, Discrete for quick zoning, Simple for binary, Palette for scientific schemes.
Extend Unfilled - Auto Remove : choose live projection and cleanup behavior to match your workflow.
Reading the chart
Bullish zones sit beneath price. Respect and hold of the upper boundary suggests demand. Strong green or warm palette tones indicate impulse quality.
Bearish zones sit above price. Respect and hold of the lower boundary suggests supply. Strong red or cool palette tones indicate impulse quality.
Stacking : multiple same-direction gaps stacked in a trend create ladders. Ladders often act as stepping stones for continuation.
Overlapping : opposing gaps overlapping in a small region usually mark a battle zone. Expect chop until one side is absorbed.
Workflow tips
Map higher timeframe trend first. Use lower timeframe FVGs for entries aligned with the higher timeframe bias.
Increase Min FVG Size percent and RSI length for noisy symbols.
Use labels when learning to correlate the RSI numbers with your palette colors.
Combine with VWAP or moving averages for confluence at FVG edges.
If you see repeated fills and refills of the same zone, treat that area as fair value and avoid chasing.
Alerts included
New Bullish FVG
New Bearish FVG
Bullish FVG Filled
Bearish FVG Filled
Extreme Oversold FVG - bullish
Extreme Overbought FVG - bearish
Practical defaults
RSI Length 14, Smooth 3, Source Returns.
Min FVG Size 0.25 percent on liquid majors.
Heatmap Style Gradient, Palette Viridis or Turbo for contrast.
Extend Unfilled on, Auto Remove on for a clean live map.
Notes
This tool does not predict the future. It maps imbalances and momentum so you can frame trades with clearer context, cleaner invalidation, and better ranking of which gaps matter. Use it with risk control and in combination with your broader process.

MNQ Verse Indicator por Santino_tradingThe MNQ Verse Indicator is a comprehensive tool designed for intraday traders, especially for those who trade indices like (MNQ, MYM Y MES). Its purpose is to consolidate the most crucial price levels that define daily market structure into a single view, allowing traders to make more informed decisions based on price context.
This indicator automatically plots key liquidity levels, opening ranges, and higher timeframe pivots, offering a clear map of potential price reaction zones.
Key Indicator Components
ORG (Opening Range)
Calculates and plots the opening range defined between the 4:14 PM close of the previous day and the 9:30 AM open of the current day (NY time).
Includes key retracement levels within the range: 50% (Equilibrium or CE), 25%, and 75%, which often act as intraday support or resistance.
Opens (Day Open & Midnight)
Day Open: Marks the opening price of the new trading day at 6:00 PM (NY time).
NY Midnight Open: Pinpoints the opening price at midnight in New York, a significant institutional level for the session.
Sessions (Asia & London)
Delineates the highs and lows of the Asia and London sessions. These levels are crucial as they often become liquidity targets during the New York session.
Includes an option to show or hide a colored box that highlights the session's range for better visualization.
Previous Pivots (D/W/M)
Daily (PDH/PDL): Previous Day's High and Low.
Weekly (PWH/PWL): Previous Week's High and Low.
Monthly (PMH/PML): Previous Month's High and Low.
These higher timeframe pivots act as magnets for price and represent major support and resistance levels.
How to Use It
The levels plotted by the MNQ Verse Indicator can be used to:
Identify high-probability zones for support and resistance.
Frame the daily bias by observing how price reacts to these key levels.
Set take-profit targets at the liquidity levels from previous sessions.
Understand the overall market context without needing to switch between multiple charts or indicators.
Full Customization
The indicator is highly customizable. From the settings menu, you can:
Adjust the color, style (solid, dotted, dashed), and text size for each level independently.
Enable or disable each group of levels according to your strategy.
Show or hide the colored boxes for the Asia and London sessions.
DISCLAIMER: This tool is designed for technical analysis and educational purposes. It does not constitute financial advice or a recommendation to buy or sell. All trading decisions are the sole responsibility of the user. Trade with caution.

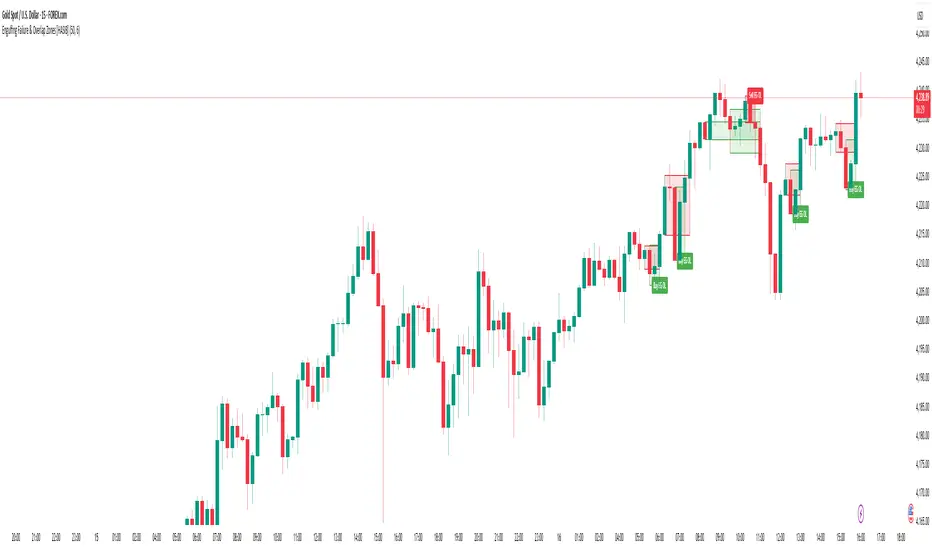
Engulfing Failure & Overlap Zones [HASIB]🧭 Overview
Engulfing Failure & Overlap Zones is a smart price action–based indicator that detects failed engulfing patterns and overlapping zones where potential liquidity traps or reversal setups often occur.
It’s designed to visually highlight both bullish and bearish failed engulfing areas with clean labels and zone markings, making it ideal for traders who follow Smart Money Concepts (SMC) or price action–driven trading.
⚙️ Core Concept
Engulfing patterns are powerful reversal signals — but not all of them succeed.
This indicator identifies:
When a Buy Engulfing setup fails and overlaps with a Sell Engulfing zone, and
When a Sell Engulfing setup fails and overlaps with a Buy Engulfing zone.
These overlapping areas often represent liquidity grab zones, reversal points, or Smart Money manipulation levels.
🎯 Key Features
✅ Detects both Buy and Sell Engulfing Failures
✅ Highlights Overlapping (OL) zones with colored rectangles
✅ Marks Buy EG OL / Sell EG OL labels automatically
✅ Fully customizable visuals — colors, padding, and zone styles
✅ Optimized for both scalping and swing trading
✅ Works on any timeframe and any instrument
⚡ How It Helps
Identify liquidity traps before reversals happen
Visually see Smart Money overlap zones between opposing engulfing structures
Strengthen your entry timing and confirmation zones
Combine with your own SMC or ICT-based trading setups for higher accuracy
📊 Recommended Use
Use on higher timeframes (e.g., M15, H1, H4) to confirm major liquidity zones.
Use on lower timeframes (e.g., M1–M5) for precision entries inside the detected zones.
Combine with tools like Order Blocks, Break of Structure (BOS), or Fair Value Gaps (FVG).
🧠 Pro Tip
When a failed engulfing overlaps with an opposite engulfing zone, it often signals market maker intent to reverse price direction after liquidity has been taken. Watch these zones closely for strong reaction candles.
ICT Anchored Market Structures with Validation [LuxAlgo]The ICT Anchored Market Structures with Validation indicator is an advanced iteration of the original Pure-Price-Action-Structures tool, designed for price action traders.
It systematically tracks and validates key price action structures, distinguishing between true structural shifts/breaks and short-term sweeps to enhance trend and reversal analysis. The indicator automatically highlights structural points, confirms breakouts, identifies sweeps, and provides clear visual cues for short-term, intermediate-term, and long-term market structures.
A distinctive feature of this indicator is its exclusive reliance on price patterns. It does not depend on any user-defined input, ensuring that its analysis remains robust, objective, and uninfluenced by user bias, making it an effective tool for understanding market dynamics.
🔶 USAGE
Market structure is a cornerstone of price action analysis. This script automatically detects real-time market structures across short-term, intermediate-term, and long-term levels, simplifying trend analysis for traders. It assists in identifying both trend reversals and continuations with greater clarity.
Market structure shifts and breaks help traders identify changes in trend direction. A shift signals a potential reversal, often occurring when a swing high or low is breached, suggesting a transition in trend. A break, on the other hand, confirms the continuation of an established trend, reinforcing the current direction. Recognizing these shifts and breaks allows traders to anticipate price movement with greater accuracy.
It’s important to note that while a CHoCH may signal a potential trend reversal and a BoS suggests a continuation of the prevailing trend, neither guarantees a complete reversal or continuation. In some cases, CHoCH and BoS levels may act as liquidity zones or areas of consolidation rather than indicating a clear shift or continuation in market direction. The indicator’s validation component helps confirm whether the detected CHoCH and BoS are true breakouts or merely liquidity sweeps.
🔶 DETAILS
🔹 Market Structures
Market structures are derived from price action analysis, focusing on identifying key levels and patterns in the market. Swing point detection, a fundamental concept in ICT trading methodologies and teachings, plays a central role in this approach.
Swing points are automatically identified based exclusively on market movements, without requiring any user-defined input.
🔹 Utilizing Swing Points
Swing points are not identified in real-time as they form. Short-term swing points may appear with a delay of up to one bar, while the identification of intermediate and long-term swing points is entirely dependent on subsequent market movements. Importantly, this detection process is not influenced by any user-defined input, relying solely on pure price action. As a result, swing points are generally not intended for real-time trading scenarios.
Instead, traders often analyze historical swing points to understand market trends and identify potential entry and exit opportunities. By examining swing highs and lows, traders can:
Recognize Trends: Swing highs and lows provide insight into trend direction. Higher swing highs and higher swing lows signify an uptrend, while lower swing highs and lower swing lows indicate a downtrend.
Identify Support and Resistance Levels: Swing highs often act as resistance levels, referred to as Buyside Liquidity Levels in ICT terminology, while swing lows function as support levels, also known as Sellside Liquidity Levels. Traders can leverage these levels to plan their trade entries and exits.
Spot Reversal Patterns: Swing points can form key reversal patterns, such as double tops or bottoms, head and shoulders, and triangles. Recognizing these patterns can indicate potential trend reversals, enabling traders to adjust their strategies effectively.
Set Stop Loss and Take Profit Levels: In ICT teachings, swing levels represent price points with expected clusters of buy or sell orders. Traders can target these liquidity levels/pools for position accumulation or distribution, using swing points to define stop loss and take profit levels in their trades.
Overall, swing points provide valuable information about market dynamics and can assist traders in making more informed trading decisions.
🔹 Logic of Validation
The validation process in this script determines whether a detected market structure shift or break represents a confirmed breakout or a sweep.
The breakout is confirmed when the close price is significantly outside the deviation range of the last detected structural price. This deviation range is defined by the 17-period Average True Range (ATR), which creates a buffer around the detected market structure shift or break.
A sweep occurs when the price breaches the structural level within the deviation range but does not confirm a breakout. In this case, the label is updated to 'SWEEP.'
A visual box is created to represent the price range where the breakout or sweep occurs. If the validation process continues, the box is updated. This box visually highlights the price range involved in a sweep, helping traders identify liquidity events on the chart.
🔶 SETTINGS
The settings for Short-Term, Intermediate-Term, and Long-Term Structures are organized into groups, allowing users to customize swing points, market structures, and visual styles for each.
🔹 Structures
Swings and Size: Enables or disables the display of swing highs and lows, assigns icons to represent the structures, and adjusts the size of the icons.
Market Structures: Toggles the visibility of market structure lines.
Market Structure Validation: Enable or disable validation to distinguish true breakouts from liquidity sweeps.
Market Structure Labels: Displays or hides labels indicating the type of market structure.
Line Style and Width: Allows customization of the style and width of the lines representing market structures.
Swing and Line Colors: Provides options to adjust the colors of swing icons, market structure lines, and labels for better visualization.
🔶 RELATED SCRIPTS
Pure-Price-Action-Structures.
Market-Structures-(Intrabar).

Khosro XAUUSD Strategy [TradingFinder] Trading Room Hunter Setup🔵 Introduction
The Trading Room Hunter (TRH) strategy is an analytical model based on the Smart Money Concept, developed by Khosro, an Iranian international trader based in Dubai. This approach is built upon a deep understanding of liquidity engineering, market structure shifts, and institutional order flow. Its core objective is to identify the so-called TRH Zone, the area where market liquidity gets trapped and institutional investors begin accumulating positions. Unlike traditional indicator-based methods, the TRH Zone focuses purely on price behavior and supply & demand dynamics to pinpoint the most precise reversal zones in the market.
Within Smart Money logic, every impulsive move in price results from the displacement or absorption of liquidity in a specific range. In the TRH model, the last pivot preceding the impulsive move (Origin Pivot) is defined as the Distal Line, and the Break Candle, which disrupts the market structure, forms the Proximal Line. The area between these two points defines the Trading Room Hunter Zone, a reaction zone where price, after creating a displacement or Break of Structure (BoS), often returns to fill an imbalance and provide a precision entry opportunity.
In essence, the TRH Zone is the region where smart money seeks re-entry after a liquidity sweep and a confirmed CHoCH or BoS. It frequently lies between supply/demand boundaries and fair value gaps (FVGs), forming one of the strongest decision-making frameworks within modern price-action theory. Due to its structural accuracy, the TRH setup can also function as a Set & Forget Setup, where the trader defines the zone, places a limit order, and lets the market naturally react, eliminating emotional decision-making and allowing for automated execution aligned with institutional logic.
🔵 How to Use
In the TRH strategy, entries are taken based on price returning to the area between the last impulsive pivot and the break candle. This range (the TRH Zone) represents the region where liquidity from the previous move remains concentrated. Before continuing its main direction, price often revisits this zone to fill imbalances or mitigate unfilled orders. The logic is simple: every explosive move originates from a point where large orders were executed, and TRH precisely highlights that institutional footprint.
🟣 Bullish Setup
When the market breaks a structural high after a strong bearish leg, liquidity shifts from sellers to buyers. The last bearish candle before the breakout marks the origin of the bullish move, and the zone between that candle and the break candle becomes the smart-money entry area. As price revisits this zone and signs of exhaustion in selling pressure appear, that’s the optimal point for a long position. Stop-loss is placed slightly below the origin pivot, and targets are set at the next supply zone or upper liquidity pool.
🟣 Bearish Setup
Conversely, when the market breaks a structural low after a sharp bullish leg, liquidity transitions from buyers to sellers. The last bullish candle before the drop is identified as the origin pivot, while the bearish break candle defines the lower boundary of the zone. The range between these two points forms the TRH Supply Zone, where late buyers are trapped and fresh institutional selling begins. As price retraces into this zone, short entries can be placed near the upper boundary, with stops above the pivot and targets toward the next liquidity pool below.
Because of its structural precision and clearly defined reaction behavior, TRH is one of the most effective Set & Forget setups in Smart Money trading. Simply mark the zone, place your order, and let the market do the rest.
🔵Setting
🟣 Spike Filter | Movement
Minimum Spike Bars : Defines the minimum number of consecutive candles required for a valid spike.
Movement Power : Enables or disables the momentum-based spike filter.
Movement Power Level : Sets the strength threshold; higher values filter out weaker moves and only detect strong spikes.
Pivot Period : Defines the lookback range used to detect swing highs and swing lows in market structure. A higher value smooths out smaller fluctuations and focuses on major pivots, while a lower value increases sensitivity and identifies minor turning points more frequently.
🟣 Position Management
Stop-Loss Threshold : Enables or disables the stop-loss threshold feature.
Stop-Loss Threshold Value : Defines the value of the stop-loss threshold for risk management.
Risk-Reward Ratio : Sets the desired risk-to-reward ratio (e.g., 1:1 or 1:2).
Wide Zone Filter : Filters out zones that exceed a defined width threshold, preventing detection of overly broad TRH areas.
🟣 Display Settings
Display Mode : Chooses between Setup (showing setups) or Signal (showing trade signals).
Show Entry Levels : Displays entry levels on the chart (buy/sell zones) when enabled
Only Display the Last Position : Displays only the most recent position on the chart when enabled.
Setup Width Drawing : Adjusts the visual width of the setup drawings on the chart for better visibility.
🔵 Conclusion
The TRH strategy is a precise structural model of liquidity flow that identifies zones where smart money is most likely to enter and where price is most likely to react. By combining the Origin Pivot and Break Candle, TRH isolates the key areas that drive institutional order flow. Without relying on indicators, it focuses purely on price structure, making it highly effective for both reactive entries and Set & Forget setups.
Ultimately, TRH creates a balance between market structure and liquidity flow, enabling traders to identify institutional decision zones on the chart with minimal risk and maximum clarity

ICT Turtle SoupICT Turtle Soup identifies classic “failed breakout” reversals after liquidity sweeps of recent highs/lows, then augments the setup with volume validation, market structure context, Kill Zone (session) filters, Order Blocks (OB), Fair Value Gaps (FVG), OTE (61.8–78.6%) zones, and optional risk targets (SL/TP 1:1, 1:2, 1:3). A compact dashboard summarizes current context (recent high/low, lookbacks, active session, structure state, mitigation counts).
What the Script Does
⦁ Detects Turtle Soup events: Price breaks a prior swing extreme and then quickly reverses back inside the range.
⦁ Grades signal quality: Factors include reversal speed, volume confirmation, breakout magnitude, and consecutive patterns.
⦁ Overlays market context: Trend/range classification (ADX / MA / ATR Bands / Combined), Kill Zones (Asian/London/NY), and time-of-day filters.
⦁ Marks IMB / mitigation zones: Draws Order Blocks and Fair Value Gaps, with optional live mitigation tracking and fading/removal on mitigation.
⦁ Shows OTE zones (61.8–78.6%) after confirmed reversals to highlight potential pullback entries.
⦁ Plots risk management guides: Optional SL buffer below/above reversal wick and TP bands at 1:1, 1:2, 1:3 R multiples.
⦁ Emits alerts on bullish/bearish Turtle Soup confirmations.
How It Works (Conceptual)
1. Liquidity Sweep & Breakout Check
⦁ Looks back over user-defined windows (single or multiple lookbacks: short/medium/long) to find the most recent swing high/low.
⦁ Flags a breakout when price pierces that swing (above for bearish, below for bullish).
⦁ Optional breakout bar volume check requires volume > avg(volume, N) × multiplier.
⦁ Optional swing age check requires the broken swing to be at least X bars old.
2. Reversal Confirmation
⦁ Within N bars after the sweep, validates a mean-reversion close back inside the prior range with a minimum wick/body ratio to confirm rejection.
⦁ Quality Score adds points for:
⦁ Speed: reversal within fast_reversal_bars;
⦁ Volume: breakout and/or reversal volume spike;
⦁ Series: previous consecutive signals;
⦁ Magnitude: sufficient sweep distance.
⦁ Optional high-quality filter only shows signals meeting a minimum score.
3. Context Filters (Optional)
⦁ Sessions/Kill Zones: Only allow signals in selected sessions (Asian/London/NY) with fully custom HHMM inputs.
⦁ Time Window: Restrict to specific hours (e.g., 08–12).
⦁ Market Structure: Classify Trending vs. Ranging (via ADX, MA separation/slope, ATR bands, or Combined). You can allow signals in trends, ranges, or both.
4. Smart Confluence Layers
⦁ Order Blocks: Finds likely OBs with structural validation (e.g., bearish up-candle prior to down move), imbalance score (body/range × volume factor), and extend-until-touched with mitigation % tracking.
⦁ Fair Value Gaps: Detects valid 3-bar gaps (bull/bear) with size threshold, supports touch / 50% / full mitigation logic, and can fade or remove after mitigation.
⦁ OTE Zones: After a reversal, projects the 61.8–78.6% retracement box from the actual swing range; offset scales to timeframe to avoid clutter.
5. Risk & Display
⦁ SL/TP guides: Optional wick-buffered SL and 1:1/1:2/1:3 TPs.
⦁ Dashboard: Recent high/low, active lookbacks, current session, structure label, and live counts of mitigated OBs/FVGs.
Signals & Visuals
⦁ Bullish Turtle Soup: Triangle up + label (🐢S/M/L/D + star rating).
⦁ Bearish Turtle Soup: Triangle down + label (🐢S/M/L/D + star rating).
⦁ Labels can show: quality stars, FAST/SLOW reversal, reversal & breakout volume tags, previous consecutive count, and last move %.
⦁ Lines/Boxes: OBs, FVGs, OTE zones, SL/TP bands, and optional breakout magnitude line.
Inputs (Key Groups)
⦁ Turtle Soup: Lookbacks (single or S/M/L), reversal bars, wick ratio, magnitude line, reversal speed, volume confirmation (multiplier/length), consecutive tracking.
⦁ Order Blocks: Show/validate structure, lookback, extend-until-touched, mitigation % threshold, colors.
⦁ Fair Value Gaps: Show, min size %, colors, mitigation mode (Touch/50%/Full), optional remove-on-mitigation.
⦁ Kill Zones/Sessions: Enable Asian/London/NY with custom HHMM, colors.
⦁ OTE: Show OTE (61.8–78.6%), color, timeframe-adaptive offsets.
⦁ Signal Filters: Filter by session, time window, market structure method (ADX/MA/ATR/Combined), thresholds (ADX, MA periods, ATR multiplier), trending/ranging allowances, structure label & offset.
⦁ SL/TP: SL buffer %, TP 1:1/1:2/1:3 toggles & colors.
⦁ Breakout Validation: Require breakout-bar volume, min swing age, volume label toggles.
⦁ Alerts: Enable/disable.
⦁ Dashboard: Position, text size, colors, border.
How to Use
1. Markets & Timeframes: Works on FX, crypto, indices, and futures. Start with M5–H1 for intraday and H1–H4 for swing; refine lookbacks per instrument volatility.
2. Core Flow:
⦁ Enable multiple lookbacks for robustness on mixed volatility.
⦁ Turn on validate_swing_significance to avoid micro sweeps.
⦁ Use validate_breakout_volume + use_volume_confirmation to filter weak pokes.
3. Context Choice:
⦁ In ranging environments, allow both sides; in trends, consider counter-trend only at HTF OB/FVG/OTE confluence.
⦁ Narrow to London/NY for higher activity if desired.
4. Entries/Stops/Targets:
⦁ Entry on confirmed label close or at OTE pullback post-signal.
⦁ SL: below/above reversal wick + sl_buffer%.
⦁ TP: scale at 1:1/1:2/1:3 or manage via OB/FVG/structure breaks.
5. Confluence: Prefer Turtle Soup that aligns with OB/FVG zones and Combined structure method for added reliability.
Alerts
⦁ “Bullish Turtle Soup detected” and “Bearish Turtle Soup detected” fire on confirmation.
⦁ Set to Once Per Bar (as coded) or adjust in the alert dialog per your workflow.
Notes & Tips
⦁ Multiple lookbacks (S/M/L) help capture both shallow and deep liquidity sweeps.
⦁ Use market structure label with offset to keep it readable on the right of price.
⦁ Mitigation tracking visually communicates when OB/FVG confluence is no longer valid.
⦁ Dashboard = fast situational awareness; keep it on during live trading.
Limitations & Disclaimer
⦁ This tool is educational and not financial advice. No profitability or win-rate is implied. Markets carry risk; manage position size and test thoroughly.
⦁ Signal quality depends on market regime, spreads, news, and data quality. Backtests/forward-tests may differ.
⦁ Visual objects are capped for performance; old items may auto-clean to keep charts responsive.

ICT Killzones & MacrosICT Killzones & Macros (v1.1.5) — configurable ICT session windows + refined “macro” windows with live High/Low levels, optional extensions, next-window previews, and lightweight opening-price lines. Built to be clock-robust, timezone-aware, and performant on intraday charts.
Tip: All times are interpreted in your chosen IANA timezone (default: America/New_York) and auto-handle DST. You can rename, recolor, enable/disable, and retime every window.
What it plots
- Killzones (5) : Asia (19:00–02:00), London (02:00–05:00), NY AM (07:00–09:30), London Close (10:00–12:00), NY PM (13:30–16:00) — full-height boxes with optional header.
- Macros (8) (defaults tailored for common ICT “refined” windows): Asia-1 (18:00–21:00), Asia-2 (21:00–00:00), London-1 (01:00–04:00), AM-1 (09:45–10:15), AM-2 (10:45–11:15), Lunch (12:00–13:00), PM-1 (13:30–14:30), Power Hour (15:10–16:00).
- Live High/Low lines for the current Macro/Killzone window.
- Optional HL extension to the right until price crosses or the trading day rolls (style selectable).
- “Next” previews : earliest upcoming Macro and Killzone header; optional next-window background band.
- Opening Prices (3 lightweight time lines) : defaults 00:00, 08:30, 09:30 with right-edge labels, scoped to a session you choose (auto-cleans at session end).
- Key inputs & styling
- General : Timezone (IANA), “Sessions to show” (per window) to keep only the last N completed windows.
- Header : height (ticks), gap (ticks), fill opacity, border width/style, text size/color, toggle “Next Macro/Killzone” headers.
- Boxes : global fill opacity, global border width/style (used by both Macros & Killzones).
- High/Low : show HL, HL line style, extend on/off + extension style, optional extension labels.
- Opening Prices : enable Time 1/2/3, set HH:MM for each, session window, per-line colors, style (dotted/dashed/solid), width.
- Per-window controls : each Macro/Killzone has Enable, Session (HHMM-HHMM), Label, Fill color.
How to use (quick start)
- Set Timezone to your preference (default America/New_York).
- Toggle on the Macros and Killzones you trade. Adjust session times if needed.
- (Optional) Turn on Extend High/Low to project levels until crossed/day-roll.
- (Optional) Enable Next… headers to see the next upcoming window at a glance.
- (Optional) Configure Opening Prices (00:00 / 08:30 / 09:30 by default) and the session over which they appear.
Behavior & notes
- Time windows are computed by clock, not by guessing bar timestamps, making them robust across brokers and timeframes.
- With HL extension on, the current window’s levels extend until crossed or the end of the trading day (in your timezone). With it off, completed windows keep static HL markers (limited by “Sessions to show”).
- “Sessions to show” applies per Macro/Killzone to automatically prune older windows and keep charts snappy.
- Opening-price lines exist only within the chosen “Opening Prices Session” and are removed when it ends (keeps charts clean).
Defaults (color cues)
Killzones: Asia (blue), London (purple), NY AM (green), London Close (yellow), NY PM (orange).
Macros: neutral greys with Lunch and PM accents out of the box (all customizable).
Performance tips
- Reduce “Sessions to show” if you scroll far back in history.
- Disable “Next…” previews and/or extension labels on very slow machines.
- Narrow the “Opening Prices Session” window to exactly when you need those lines.
Changelog highlights
- v1.1.5 : Internal refinements and stability.
- v1.1.3 : Live High/Low lines for current windows + optional extension.
- v1.1.2 : Added “next Killzone” preview (to match “next Macro”).
- v1.1.0 : Defaults updated (5 KZ, 8 Macros). Removed “snap-to-killzone” behavior.
- v1.0.0 : Independent Macro vs. Killzone rendering; cleaner header logic.
- Known limitations
If your chart warns about drawings, trim “Sessions to show”.
If your broker session times differ from NY hours, adjust the sessions or change the indicator timezone.
Credits & intent
Inspired by ICT timing concepts; provided for education/mark-up, not financial advice.
Built to be flexible so you can mirror your personal playbook and journaling workflow.

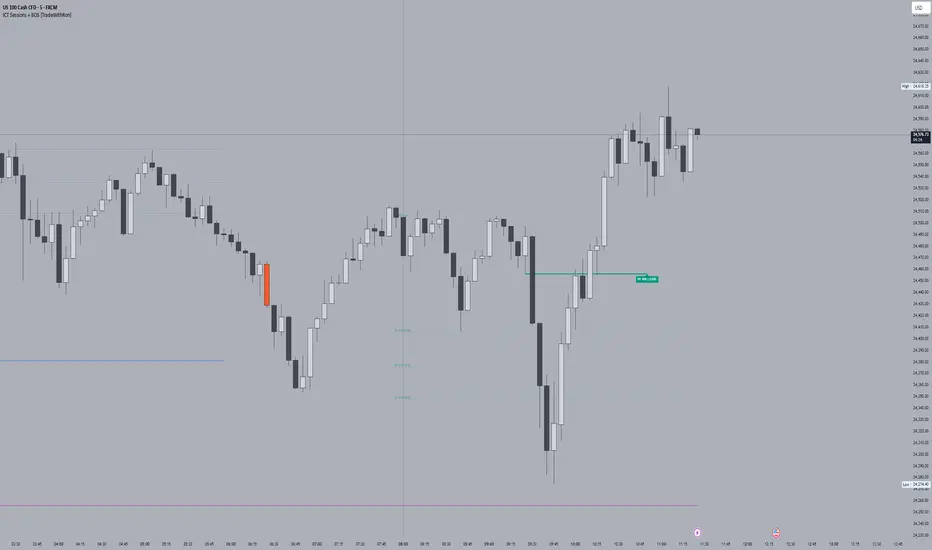
ICT Sessions With BOS [TradeWithRon]
WITH BOS
This version includes BOS with filter for each session.
NONE,FVG,CISD Filter preset
you can choose how many BOS per session, style etc.
ICT Sessions and killzones maps three intraday sessions on your chart (Asia, London, NY), tracks each session’s live high/low, draws optional session range boxes, and projects ICT OTE zones in real time—with granular styling, touch/mitigation logic, and alerting.
What it does
*Live Session high/low tracking.
Historical session lines:
When a session ends, its final High/Low are preserved as tracked lines (with optional labels) for a configurable number of recent sessions.
Session boxes (ranges):
Draws a shaded box from session start to end that expands with new highs/lows. Limit how many recent boxes remain on chart.
ICT OTE zones (live):
For the currently active session, projects user-defined Fibonacci OTE levels (e.g., 61.8%, 70.5%, 78.6) between the session’s running high and low. Zones update tick-by-tick and can show labels. You can retain a history of recent sessions’ OTE levels.
snapshot
Break visualization (mitigation):
Optionally color the bar when price breaks a stored session High/Low. You can:
Require a body close through the level (vs. any touch)
Auto-remove the line and/or label on touch/close
Use custom break colors per session and side (high/low)
Timestamps:
Add up to two recurring vertical timestamp markers (e.g., 08:00, 09:30), plus an opening horizontal marker (e.g., 09:30) with label that extends until the next occurrence.
Alerts:
Built-in alerts for:
Touch of Session 1/2/3 High/Low (Asia/London/NY)
Touch of OTE levels (per session)
Key inputs:
Time & Limits
Timezone (e.g., GMT-4)
Timeframe limit: hide all drawings on and above a specified TF
Sessions
Session windows (default):
Session 1 (Asia): 18:00–00:00
Session 2 (London): 00:00–06:00
Session 3 (NY): 08:00–12:00
How many to keep (lines/boxes)
Line width, colors, and label suffixes (“High”/“Low”)
Labels: toggle, text (“Asia”, “London”, “NY”), size, and colors
Boxes: toggle per session and background colors
ICT OTE Zones
Toggle per session (Asia/London/NY)
Levels (comma-separated %s, e.g., 61.8,70.5,78.6)
History: number of past sessions to retain
Opacity, line width/style, and label size
Custom label text per session (e.g., “Asia OTE”)
Break/Mitigation Behavior:
Enable Mitigated Candles (bar color on break)
Remove line on touch and/or remove label on touch
Require body close (vs. wick touch)
Custom break colors by session and side
Timestamps
Opening horizontal line (time, style, width, color, label text/size, drawing limit)
Two vertical timestamps (times, style, width, color, drawing limit)
Alerts
Master Enable Alerts
Per-session toggles for High/Low touches
OTE touch alerts
How it works (under the hood)
Detects session state via input.session() windows in the chosen timezone.
Live session High/Low lines and labels update in real time; on session end, final levels are stored with optional labels and tracked length.
OTE zones are live-computed from current session High↔Low and refreshed every bar; a compact rolling history is enforced.
Bar coloring reacts to break events (touch or body-close, per your setting) and uses session-specific colors when enabled.
Timestamp lines/labels are created on each occurrence and trimmed to a drawing limit for performance.
Tips:
To hide session lines but keep boxes, set line color opacity to 0.
Use Timeframe Limit to keep higher-TF charts clean.
Fine-tune OTE Levels and History to balance clarity and performance.
For stricter break logic, enable Require Body Close.
Note: The script reserves high limits for lines/labels/boxes to keep recent context visible while managing cleanup automatically. Adjust “Session Number” and “Number Of Boxes” to suit your workflow.
— © TradeWithRon
Fair Value Gaps by DGTFair Value Gaps
A refined, multi-timeframe Fair Value Gap (FVG) detection tool that brings institutional imbalance zones to life directly on your chart.
Designed for precision, it visualizes how price delivers into inefficiencies across chart, higher, and lower (intrabar) timeframes — offering a fluid, structural view of liquidity displacement and market flow.
The script continuously tracks unfilled, partially repaired, and fully resolved imbalances, revealing where liquidity inefficiencies concentrate and where price may seek rebalancing.
Overlapping zones naturally expose institutional footprints, potential liquidity targets, and key re-pricing regions within the broader market structure.
KEY FEATURES
⯌ Multi-Timeframe Detection
Detect and display FVGs from the current chart, higher timeframes (HTF), or lower timeframes (LTF)
⯌ Smart Fill Tracking
Automatic real-time monitoring of each FVG’s fill progress with live percentage updates
⯌ Custom Fill Logic
Choose your preferred definition of when a gap is considered filled: Any Touch
Midpoint Reached
Wick Sweep
Body Beyond
⯌ Dynamic Labels & Tooltips
Labels can be toggled on/off. Even when hidden, detailed tooltips remain available by hovering over the FVG midpoint.
⯌ Adaptive Lower-Timeframe Mode
When set to “Auto,” the script intelligently selects the optimal lower timeframe based on the chart resolution.
DISCLAIMER
This script is intended for informational and educational purposes only. It does not constitute financial, investment, or trading advice. All trading decisions made based on its output are solely the responsibility of the user.

Orderblocks & BreakersThis indicator identifies potential orderblocks and breakers based on recent swing highs and lows. It is built to offer a structured, customizable, and noise-controlled view of how price interacts with supply and demand levels.
The script applies pivot-based swing detection to identify swing highs and lows.
Bullish Orderblocks: The script Identifies and stores the last down candle before a swing high is breached and confirms and plots the orderblock with a market structure break (close above the swing high).
Bearish Orderblocks: The script Identifies and stores the last up candle before a swing low is breached and confirms and plots the orderblock with a market structure break (close below the swing low).
When price later closes through an existing orderblock, it is reclassified as a Breaker and recolored accordingly. (all colors can be changed in the settings)
What Makes It Different
Unlike most orderblock tools that simply mark every swing-based block, this version introduces:
1. Chop Control – automatically hides breakers that price repeatedly closes through (2 closes after the orderblock becomes a breaker), keeping only relevant zones visible.
2. Recent Block Filtering – limits how many of the recent orderblocks or breakers are displayed, preventing chart clutter.
3. Dynamic Updating – orderblocks automatically convert to breakers when price closes beyond them, with clear color changes.
These features make it easier to study cleaner price structure without manually managing old or invalid zones. The optional Chop Control filter can reduce overlapping or repeatedly invalidated zones to keep the chart clearer.
Customizable Parameters
- Swing detection length (shorter means more aggressive pivot detection, longer means less aggressive so less highs/lows detected)
- Number of recent blocks to display
- Visibility toggles for orderblocks or breakers
- Color and transparency controls for each type
Alerts
Alerts can be set to trigger when price tests any defined zone.
Purpose
This indicator is designed as a price structure visualization and study tool.
It may assist in understanding how price interacts with previously active regions, but it does not produce signals or trade recommendations.

FVG Volume Profile [ChartPrime]⯁ OVERVIEW
FVG Volume Profile is a smart volume analysis tool that identifies Fair Value Gaps (FVGs) and overlays a volume profile inside each gap using data from lower timeframes. The indicator automatically selects the best time resolution or allows for manual control, giving traders deeper insight into the volume structure within each imbalance. POC levels and total volumes gives a full microstructure view inside every FVG.
⯁ KEY FEATURES
Fair Value Gap Detection (Bullish & Bearish)
Detects price gaps where inefficiency exists using a 3-bar structure.
-Bullish Gaps: Low > High with confirming middle bar.
-Bearish Gaps: High < Low with confirming middle bar.
Only significant gaps (filtered by standard deviation) are plotted to avoid noise.
Multi-Timeframe Volume Profiling
Pulls granular candle and volume data from a lower timeframe —
In Auto Mode, uses a resolution ~10x lower than the current chart.
In Manual Mode, lets the user select a custom timeframe.
This ensures accurate intra-gap volume distribution.
Dynamic Volume Binning
Each FVG is divided into vertical volume bins based on the Resolution input.
Each bin displays relative volume intensity as a horizontal box, scaled by percentage of the max bin volume.
Point of Control (PoC) Line & Label
The bin with the maximum volume inside each FVG is marked with:
A horizontal line (PoC) extending from the left to right side.
A label showing the absolute volume of that bin.
Color-coded to match bullish or bearish FVGs.
Total Volume Label Inside FVG
Each FVG displays the total volume sum from its profile:
For bullish FVGs , shown in the bottom-right corner.
For bearish FVGs , shown in the top-right corner.
Auto-Removal of Invalid Gaps
If price fully closes the gap (crosses its bounds), the FVG, profile, and PoC are deleted automatically.
This keeps the chart clean and focused only on active zones.
Toggleable Volume Profile Display
User can show or hide the volume profiles within FVGs using the "Display" toggle under the "FVG Volume Profile" group.
Only the PoC and FVG boxes remain visible if toggled off.
Volume Resolution Customization
Control the number of bins used for each FVG profile.
Higher resolution = more bins and finer volume analysis. (default 15)
Auto Timeframe Validation Warning
If the selected lower timeframe isn’t actually lower than the chart's, the script shows a visible warning label prompting adjustment.
Helps prevent calculation errors.
⯁ USAGE
Use this tool to identify active imbalance zones (FVGs) with embedded volume context.
Look for PoC positioning inside gaps — near top may indicate absorption or reversal zones.
Combine with price action at the PoC level for precision entries.
Hide volume profile for a cleaner view while retaining key POC and FVG boxes.
Use resolution controls to zoom into fine-grained profiles inside large gaps.
Consider Auto mode for seamless multi-timeframe analysis, or switch to Manual for full control.
⯁ CONCLUSION
FVG Volume Profile transforms raw imbalance detection into actionable insight by embedding lower-timeframe volume structure inside each Fair Value Gap. With PoC highlights, total volume labels, and customizable bin resolution, this indicator is essential for traders who want to understand not just where the gap is — but what volume did inside it .

SMC Structures and Multi-Timeframe FVG PYSMC Structures and Multi-Timeframe FVG Indicator
Tip: For optimal performance, adjust the number of FVGs displayed per timeframe in the settings. On high-performance devices, up to 8 FVGs per timeframe can be used without issues. If you experience slowdowns, reduce to 3 or 4 FVGs per timeframe. If the chart flashes, disable indicators one by one to identify conflicts, or try using the TradingView Mobile or Windows App for a smoother experience.
Overview
This Pine Script indicator enhances market analysis by integrating Smart Money Concepts (SMC) with Fair Value Gaps (FVG) across multiple timeframes. It identifies trend continuations (Break of Structure, BOS) and trend reversals (Change of Character, CHoCH) while highlighting liquidity zones through FVG detection. The indicator includes eight customizable Moving Average (MA) curve templates, disabled by default, to complement SMC and FVG analysis. Its originality lies in combining multi-timeframe FVG detection with SMC structure analysis, providing traders with a cohesive tool to visualize price action patterns and liquidity zones efficiently.
Features and Functionality
1. Fair Value Gaps (FVG)
The indicator detects and displays bullish, bearish, and mitigated FVGs, representing liquidity zones where price inefficiencies occur. These gaps are dynamically updated based on price action:
Bullish FVG: Displayed in green when unmitigated, indicating potential upward liquidity zones.
Bearish FVG: Displayed in red when unmitigated, signaling potential downward liquidity zones.
Mitigated FVG: Shown in gray once the gap is partially filled by price action.
Fully Mitigated FVG: Automatically removed from the chart when the gap is fully filled, reducing visual clutter.
Users can customize the number of historical FVGs displayed via the settings, allowing focus on recent liquidity zones for targeted analysis.
2. SMC Structures
The indicator identifies key SMC price action patterns:
Break of Structure (BOS): Marked with gray lines, indicating trend continuation when price breaks a significant high or low.
Change of Character (CHoCH): Highlighted with yellow lines, signaling potential trend reversals when price fails to maintain the current structure.
High/Low Values: Blue lines denote the highest high and lowest low of the current structure, providing reference points for market context.
3. Multi-Timeframe FVG Analysis
A standout feature is the ability to analyze FVGs across multiple timeframes simultaneously. This allows traders to align higher-timeframe liquidity zones with lower-timeframe entries, improving trade precision. The indicator fetches FVG data from user-selected timeframes, displaying them cohesively on the chart.
4. Moving Average (MA) Templates
The indicator includes eight customizable MA curve templates in the Settings > Template section, disabled by default. These templates allow users to overlay MAs (e.g., SMA, EMA, WMA) to complement SMC and FVG analysis. Each template is pre-configured with different periods and types, enabling quick adaptation to various trading strategies, such as trend confirmation or dynamic support/resistance.
How It Works
The script processes price action to detect FVGs by analyzing three-candle patterns where a gap forms between the high/low of the first and third candles. Multi-timeframe data is retrieved using Pine Script’s request.security() function, ensuring accurate FVG plotting across user-defined timeframes. BOS and CHoCH are identified by tracking swing highs and lows, with logic to differentiate trend continuation from reversals. The MA templates are computed using standard Pine Script TA functions, with user inputs controlling visibility and parameters.
How to Use
Add to Chart: Apply the indicator to any TradingView chart.
Configure Settings:
FVG Settings: Adjust the number of historical FVGs to display (default: 10). Enable/disable specific FVG types (bullish, bearish, mitigated).
Timeframe Selection: Choose up to three timeframes for FVG analysis (e.g., 1H, 4H, 1D) to align with your trading strategy.
Structure Settings: Toggle BOS (gray lines) and CHoCH (yellow lines) visibility. Adjust sensitivity for structure detection if needed.
MA Templates: Enable MA curves via the Template section. Select from eight pre-configured MA types and periods to suit your analysis.
Interpret Signals:
Use green/red FVGs for potential entry points targeting liquidity zones.
Monitor gray lines (BOS) for trend continuation and yellow lines (CHoCH) for reversal signals.
Align multi-timeframe FVGs with BOS/CHoCH for high-probability setups.
Optionally, use MA curves for trend confirmation or dynamic levels.
Clean Chart Usage: The indicator is designed to work standalone. Ensure no conflicting scripts are applied unless explicitly needed for your strategy.
Why This Indicator Is Unique
Unlike standalone FVG or SMC indicators, this script combines both concepts with multi-timeframe analysis, offering a comprehensive view of market structure and liquidity. The addition of customizable MA templates enhances flexibility, while the dynamic removal of mitigated FVGs keeps the chart clean. This mashup is purposeful, as it integrates complementary tools to streamline decision-making for traders using SMC strategies.
Credits
This indicator builds on foundational SMC and FVG concepts from the TradingView community. Some open-source code was reused, and do performance enhancement as you guys can read the code. This type of indicators has inspiration was drawn from public domain SMC methodologies. All code is partly original with manual work on performance optimization in Pine Script.
Notes
Ensure your chart is clean (no unnecessary drawings or indicators) to maximize clarity.
The indicator is open-source, and traders are encouraged to review the code for deeper understanding.
For optimal use, test the indicator on a demo account to familiarize yourself with its signals.

ICT Daily Levels & Liquidity Zones [HatefBW]ICT Daily Levels & Liquidity Zones
This indicator automatically detects and plots the daily high and low levels for the current day and the two previous days.
Each level dynamically tracks the exact candle that created it, allowing traders to identify where short-term liquidity pools form across multiple timeframes.
What makes this tool unique:
• Three-day structure: Displays current, previous, and 2-day-old highs/lows for contextual price action.
• Dynamic mapping: On lower timeframes, each level aligns precisely with the candle that created the daily high or low.
• Full customization: Traders can toggle each day’s levels, colors, label size, and extension behavior independently.
• Adaptive logic: Lines automatically extend or stay fixed depending on the chosen setting, avoiding chart clutter.
This tool helps ICT traders and smart money practitioners visualize daily liquidity zones — potential areas of stop hunts or institutional targeting.
The script is originally coded by @HatefBW from scratch, with no reused or modified open-source code

FVG +Displcement/ATR/3thClosedBody [hatefbw]Overview
This indicator is a modified version of the LuxAlgo group’s FVG indicator. It now includes three advanced optional filters that help traders identify only the strongest and most reliable Fair Value Gaps (FVGs), aligned with Smart Money Concepts (SMC) and ICT methodology.
How it works
We’ve added the following new configurable options to the indicator:
✅ Confirm Third Closed Body
When enabled, ensures the third candle (right after the gap) closes beyond the wick of the second candle.
✔️ Adds extra validation to price direction and filters out weaker FVGs.
✅ Confirm Displacement Candle
Validates that the second candle (the one forming the FVG) is a strong displacement candle. This condition checks for:
📏 Large body relative to total range (customizable %, default: 70%)
📈 High volume above 20-period moving average
🔺 Break of Structure (BOS) in the direction of the FVG
Bullish FVG: breaks above recent highs
Bearish FVG: breaks below recent lows
✅ ATR-Based Validation (optional)
Adds an additional filter where the second candle’s body or range must exceed the ATR (default: ATR 14, configurable).
✔️ Further confirms that the displacement candle has significant market movement.
Usage
All features are 100% optional and can be toggled in the settings.
Use them to filter out weak FVGs and align trades with institutional-grade setups.

CISD & OB [BLAZ]Version 1.0 – Published October 2025: Initial release
1. Overview & Purpose
The CISD & OB indicator identifies and plots Order Blocks (OB) and Changes in State of Delivery (CISD) on price charts using a strict rule-based approach designed to highlight structural turning points and continuation zones in price action. It automatically detects these formations when price creates confirmed swing highs or lows, followed by opposing directional moves that break predefined structural levels.
Detection logic is consistently applied across all market conditions, allowing the indicator to identify areas where notable price reactions or liquidity shifts have occurred. These levels are plotted as horizontal lines on the chart and are updated in real time to reflect the latest structural developments, helping traders visualise potential reversal or continuation zones.
The methodology used in this indicator represents the author's specific approach to Order Block and CISD identification, incorporating custom criteria for swing validation and confirmation logic that differ from standard implementations. Detection operates entirely mechanically, without discretionary intervention, to ensure consistency and objectivity across use cases. This indicator functions on all standard timeframes and supports multiple asset classes, including Forex, Stocks, Cryptocurrencies, Futures, and Commodities.
The indicator is unique in its ability to apply detection logic to a custom timeframe, enabling multi-timeframe structural analysis without switching charts. Let’s begin by explaining key terminologies based on the author’s perception to aid in understanding the functionality of the indicator.
2. Order Block (OB)
An Order Block is identified when price creates a swing high or swing low followed by a directional move that closes beyond the open of the opposing candle(s) structure.
2.1. For bearish Order Blocks:
Price must form a confirmed swing high (higher than surrounding candles).
A subsequent bearish candle must close below the open of the bullish candle(s) that created the swing high.
2.2. For bullish Order Blocks:
Price must form a confirmed swing low (lower than surrounding candles).
A subsequent bullish candle must close above the open of the bearish candle(s) that created the swing low.
The indicator only validates Order Blocks where the structural formation meets minimum swing criteria and the confirming move demonstrates sufficient momentum beyond the identified level.
3. Change in State of Delivery (CISD)
A CISD occurs when a valid Order Block forms in the opposite direction to the previously confirmed Order Block, indicating a potential shift in market structure.
3.1. Formation criteria:
A bullish CISD forms when a valid bullish Order Block is detected after the most recent confirmed structure was a bearish Order Block.
A bearish CISD forms when a valid bearish Order Block is detected after the most recent confirmed structure was a bullish Order Block.
Each CISD represents the first opposing Order Block in a sequence, distinguishing it from continuation Order Blocks that follow in the same direction.
The indicator tracks the sequence of Order Block formations to automatically classify each new structure as either a CISD (directional change) or continuation Order Block based on the preceding confirmed structure.
4. Detection Logic & Visual Management
The indicator continuously scans price action in real time, validating only those patterns that meet predefined technical thresholds. Once a structure is confirmed, it is plotted as a horizontal line extending from the origin candle’s open to the confirming close.
To maintain chart clarity, the script integrates automatic display management, limiting the number of plotted lines according to user-defined settings. Independent styling options are available for bullish and bearish structures, including colour, width, and line thickness. CISD and OB structures are styled separately to provide a clear distinction between reversal and continuation events.
Developing structures appear as dotted potential horizontal lines until they are validated, at which point they transition to solid lines. The indicator also allows users to restrict visibility of plotted lines above a selected timeframe, ensuring that higher timeframe charts remain clean and readable.
If configuration settings conflict, such as incompatible timeframe or visibility filters, the indicator displays on-chart warning messages to guide users in adjusting their setup appropriately.
The indicator supports multi-timeframe plotting capability, allowing structures identified on higher timeframes to be visualised directly on the active lower timeframe chart. This feature allows traders to observe how market structures align across multiple timeframes, providing greater confirmation of overall trend direction, reinforcing analytical confidence through cross‑timeframe confluence, and ensuring short‑term decisions remain aligned with the prevailing market context.
Traders can configure alerts to receive notifications when new CISD or OB structures are confirmed. Alerts are fully customisable via the indicator input settings and can be defined by direction (bullish/bearish) and pattern type (OB or CISD).
5. Usage Instructions
5.1. Alert Setup:
Enable "Set Alert?" toggle in indicator settings.
Configure alert preferences for specific pattern types.
On the chart, click the three dots menu beside the indicator's name or press Alt + A.
Select "Add Alert" and click “Create” to activate the alert.
Alerts trigger when new patterns are confirmed.
5.2. Display Controls:
Use "Bullish Lines" and "Bearish Lines" toggles to show/hide patterns by direction.
Adjust line quantity settings (1-25) to control how many patterns display simultaneously.
Enable “Timeframe” to apply detection logic to a higher timeframe of choice, displaying CISD and OB patterns directly on the active chart.
5.3. Visibility Filter:
Use “Show below” to limit indicator visibility to specific timeframes. When enabled, the indicator hides automatically on any timeframe equal to or higher than the selected setting.
5.4. Appearance Customisation:
Toggle “CISD” or “OB” on/off to show or hide individual pattern types.
Modify colours and line widths independently for bullish and bearish structures.
The “Show potential line” option displays developing patterns as dotted horizontal lines until confirmed.
5.5. Warning Message:
Enable “Show warning messages” to display on‑chart guidance for conflicting or invalid configurations.
Choose the preferred message box position and colour styling for readability.
6. Protected Logic & Original Design
This indicator has been developed from the ground up using proprietary algorithms and a custom structural classification logic derived from original research into Order Block and CISD identification methods. The internal mechanics, including real-time pre-confirmation logic, multi-timeframe adaptation, directional classification sequencing, and automated display management, are not based on any publicly available script or third-party resource.
7. Disclaimer
This indicator is provided for educational and analytical purposes only. It does not constitute financial advice, investment recommendations, or trading signals. All trading and investment decisions remain solely the responsibility of the user.
Trading financial instruments involves substantial risk of loss. Past performance of any trading methodology or indicator does not guarantee future results. Users should conduct their own research and consider consulting with qualified financial professionals before making trading decisions.
The indicator's pattern detection is based on technical analysis principles and should be used as part of a comprehensive trading approach. No trading tool can guarantee profitable outcomes or eliminate market risk.
By using this indicator, users acknowledge they understand these risks and accept full responsibility for their trading decisions and outcomes.

ICT Essentials [LDT]ICT Essentials
Overview
ICT Essentials is an all-in-one trading utility built to create a natural and efficient workflow for ICT-based traders.
Every component has been designed to integrate seamlessly and update dynamically across timeframes.
The indicator focuses on clarity, performance and customization, allowing traders to tailor every part of their trading experience.
Equal Highs & Lows
This feature automatically detects and marks Equal Highs (EQH) and Equal Lows (EQL) with full control over visuals and behavior.
Users can customize line colors, widths, and styles, label size, color, background transparency and text offset.
The logic uses an optimized scanning and caching system that maintains smooth performance even on higher timeframes.
It provides a precise and adaptive way to identify structural liquidity points whilst keeping the chart clean and readable.
Killzones & Session Pivots
Plots the main trading sessions such as Asia, London and New York (AM, Lunch, PM) with full flexibility and styling options.
Each session can be enabled or disabled individually, with its own color, transparency and label preferences.
Session highs and lows are automatically tracked and plotted as pivots with extension modes like Until Mitigated or Past Mitigation.
This system gives traders the ability to organize market sessions exactly how they prefer whilst keeping the chart consistent and efficient.
Daily Pivots and Tier System
Alongside session pivots, the script tracks daily highs and lows to provide a broader structural view of price. These pivots are stored and displayed on the chart with their appearance updating automatically when price interacts with them.
The system includes a unique tier-based visibility filter that maintains a clean chart by preventing duplicate or overlapping pivots. Recent daily pivots are cached and compared to session pivots and when two levels fall within a defined proximity, the redundant one is automatically hidden. This creates a clear hierarchy of daily and session levels, keeping the most relevant structure visible whilst removing noise.
All aspects of the daily pivot system are fully customizable, including the number of tracked pivots, color, style settings and how mitigated levels are handled. The caching and filtering logic ensures smooth performance and a visually organized workspace even as the data updates in real time.
Key Times
Allows up to five custom key time markers such as the Midnight Open, 6:00 AM or 10:00 AM.
Each marker can be fully customized with its own text, color, line style and thickness.
This makes it simple to visualize key reaction points that align with each traders timing model.
Higher Timeframe Candles
Displays higher timeframe candles such as 1H, 4H or Daily directly on the active chart to provide context without switching views.
Users can customize body, wick and border colors, along with adding optional trace lines for the open, close, high and low and can also show the countdown timers for remaining candle time.
Adjustable spacing, positioning and label visibility makes the display blend naturally with any trading setup.
This module helps traders connect multiple timeframes visually in a clean and intuitive way.
Watermark
Adds a customizable watermark with title, subtitle and symbol or timeframe information.
Every element can be adjusted for color, size, transparency, alignment and position.
The result is a polished, professional chart layout that adapts to the user's personal style.
Optimization and Design
ICT Essentials is built for performance, using cached arrays and lightweight calculations to maintain responsiveness on all timeframes.
Each feature can be toggled individually to suit the traders focus or system performance.
The script delivers a fluid, customizable and highly optimized trading experience designed to feel natural and effortless in day-to-day use.
Credits
This script takes reference and inspiration from several open-source indicators:
Equal Highs and Lows by jzstur
ICT HTF Candles (fadi) by fadizeidan
ICT Killzones + Pivots EP by tradeforopp
AG FX - Watermark by AGFXTRADING
All components have been refactored, optimized and unified into a single framework for a smoother and more efficient workflow.

Market Structure ICT Screener [TradingFinder] BoS ChoCh🔵 Introduction
Market Structure is the foundation of every Smart Money and ICT based trading model. It describes how price moves through a sequence of highs and lows, forming clear phases of expansion, retracement and reversal. Understanding this structure allows traders to read institutional order flow and align their positions with the true direction of liquidity.
Two of the most critical components in Market Structure are the Break of Structure (BOS) and Change of Character (CHOCH). A BOS represents trend continuation, confirming strength within the current direction. In contrast, CHOCH also known as a Market Structure Shift (MSS) signals the first sign of a trend reversal or liquidity shift where order flow begins to change from bullish to bearish or vice versa.
Because the market is fractal, structure can exist at multiple levels known as Major (External) and Minor (Internal). Major structure defines the overall trend on higher timeframes while minor or internal structure reveals short term swings and early reversals within that larger move.
🔵 How to Use
Understanding Market Structure starts with identifying how price interacts with previous swing highs and swing lows. Every trend in the market, whether bullish or bearish, is built from a sequence of impulsive and corrective moves. Impulsive legs show strong displacement in the direction of liquidity flow, while corrective legs represent temporary pullbacks as the market rebalances before the next expansion. Recognizing these sequences is essential for reading the story of price and anticipating what may happen next.
A Break of Structure (BOS) occurs when price decisively moves beyond a previous structural point by breaking above the last high in an uptrend or falling below the last low in a downtrend. This event confirms that the current trend remains intact and that liquidity has been successfully taken from one side of the market. A BOS acts as confirmation of continuation and reflects strength within the existing directional bias.
A Change of Character (CHOCH) appears when price violates structure in the opposite direction of the prevailing trend. This is the first signal that market sentiment and order flow may be shifting. For example, during a downtrend if price breaks above a previous high, it indicates that sellers are losing control and a potential bullish reversal may be developing. In an uptrend, when price drops below a recent low, it suggests a possible bearish transition.
Because the market is fractal, structure exists across multiple layers. Major structure reflects the dominant movement visible on higher timeframes and defines the broader directional bias. Minor or internal structure represents smaller swings within that move and helps identify early transitions before they appear on the higher timeframe. When internal and external structures align, they offer a high probability signal for trend continuation or reversal.
By observing BOS and CHOCH across both internal and external structures, traders can clearly visualize when the market is expanding, contracting or preparing to shift direction. This structured understanding of price movement forms the foundation for precise trend analysis and high quality decision making in any Smart Money or ICT based trading approach.
🔵 Settings
🟣 Display Settings
Table on Chart : Allows users to choose the position of the signal dashboard either directly on the chart or below it, depending on their layout preference.
Number of Symbols : Enables users to control how many symbols are displayed in the screener table, from 10 to 20, adjustable in increments of 2 symbols for flexible screening depth.
Table Mode : This setting offers two layout styles for the signal table :
Basic : Mode displays symbols in a single column, using more vertical space.
Extended : Mode arranges symbols in pairs side-by-side, optimizing screen space with a more compact view.
Table Size : Lets you adjust the table’s visual size with options such as: auto, tiny, small, normal, large, huge.
Table Position : Sets the screen location of the table. Choose from 9 possible positions, combining vertical (top, middle, bottom) and horizontal (left, center, right) alignments.
🟣 Symbol Settings
Each of the 20 symbol slots comes with a full set of customizable parameters :
Symbol : Define or select the asset (e.g., XAUUSD, BTCUSD, EURUSD, etc.).
Timeframe : Set your desired timeframe for each symbol (e.g., 15, 60, 240, 1D).
Pivot Period : Set the length used to detect swing highs and lows. Shorter values increase sensitivity, longer ones focus on major structures.
🔵 Conclusion
Mastering Market Structure and understanding the relationship between BOS and CHOCH allows traders to see the market with greater clarity and confidence. These two elements reveal how liquidity moves through different phases of expansion and retracement and how institutional order flow shifts between accumulation and distribution.
By analyzing both internal and external structures, traders can align short term and long term perspectives and anticipate where price is most likely to react. The ability to read these structural shifts helps identify continuation points, reversals and areas where liquidity is engineered or collected.
Incorporating Market Structure into a consistent trading process transforms the way a trader views the chart. Instead of reacting to random movements, each swing, break and shift becomes part of a logical framework that reflects the true behavior of the market. Understanding BOS and CHOCH is not just a concept but a complete language of price that guides every professional decision in Smart Money and ICT based trading.

ICT Suspension Block HTF [Herman]ICT Suspension Block HTF — auto-marking +SB / –SB with MTF
ICT Suspension Block HTF automatically detects and plots Suspension Blocks (SB ) on your chart and optionally pulls them from higher timeframes. It’s built for traders who want precise, visual SB zones with mitigation/entry alerts and a compact stats panel.
What’s a Suspension Block (SB) ?
-A Suspension Block is a body-to-body price imbalance formed by three consecutive candles in the same direction where the bodies create sequential “gaps” (a brief pause in price efficiency).
-Bullish +SB: three bullish candles with body-to-body gaps stepping up.
-Bearish –SB: three bearish candles with body-to-body gaps stepping down.
This script highlights the actionable block zone (between the body levels of the middle candle) and lets you extend it forward for reaction tests.
Note: This tool implements a widely discussed definition of Suspension Blocks for educational/analytical use.
Key features
-Auto detection: Plots +SB/–SB the moment a valid 3-candle structure forms.
-Multi-Timeframe (MTF):
-Current timeframe detection (toggle).
-MTF1 & MTF2 pulls (e.g., 5m and 15m by default) to show HTF SBs directly on your LTF chart.
-Smart de-duplication: Avoids drawing near-identical blocks (tick-aware tolerance).
-Midpoint line (optional): Draws the 50% of the block for refined confluence.
-Forward extension: Choose how far to extend the zone in bars.
Alerts:
-New +SB/–SB formed
-Price enters a block
-Block mitigated
-Stats table: Lightweight panel showing active +SB / –SB counts and average detected gap size.
Theme aware : Light/Dark table themes matched to Herman Trading visuals.
Inputs (quick guide)
-Multi-Timeframe
-Enable Current Timeframe
-Enable MTF1 (timeframe input)
-Enable MTF2 (timeframe input)
Core
-Show Bullish / Bearish
-Show Labels
-Show 50% Midpoint
-Min Gap Size (% of candle body) — filters out weak structures
-Extension Length (bars) — how far to project the zone
-Max Number of Blocks — auto-prunes oldest drawings
-Label Size & Colors
-Alerts
-New Block Formation
-Price Entered Block
-Block Mitigation
-Table
-Show / Position
-Theme (Light / Dark)
How mitigation & entry work
-Entry alert: Fires when price crosses into a block (from outside).
-Mitigation: When price tags the block boundaries (top/bottom), the zone is marked mitigated (faded, no further extension).
-The stats panel updates counts in real time.
Practical tips
-Use HTF SBs (e.g., 15m/1h) on your execution timeframe for higher-quality reaction zones.
-Combine with your existing framework (session timing, liquidity sweeps, iFVG/MSS, etc.).
-Tighten/loosen Min Gap Size to match instrument volatility.
-Keep Max Blocks reasonable for performance on very low timeframes.
Disclaimer
This indicator is for education and analysis. It does not constitute financial advice. Trading involves risk; always do your own research and manage risk appropriately.
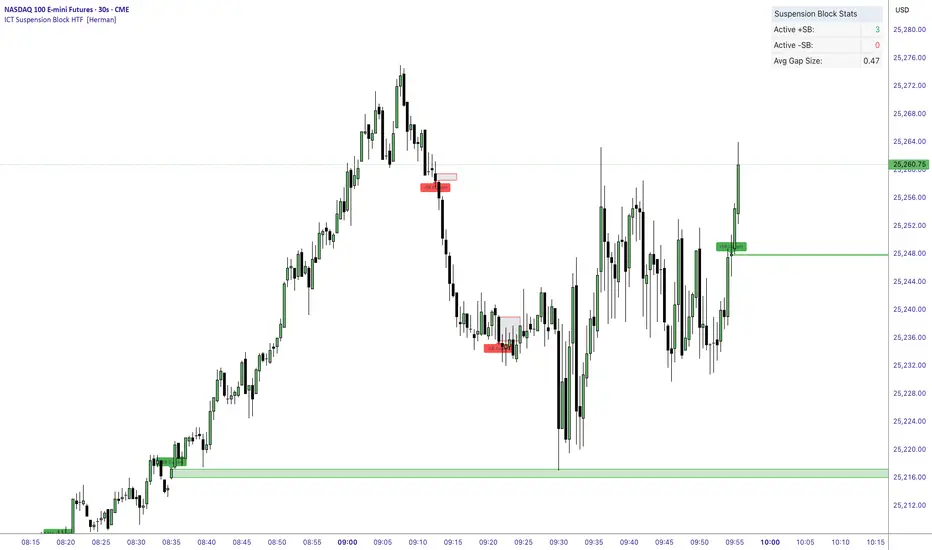
Market Structure Report Library [TradingFinder]🔵 Introduction
Market Structure is one of the most fundamental concepts in Price Action and Smart Money theory. In simple terms, it represents how price moves between highs and lows and reveals which phase of the market cycle we are currently in uptrend, downtrend, or transition.
Each structure in the market is formed by a combination of Breaks of Structure (BoS) and Changes of Character (CHoCH) :
BoS occurs when the market breaks a previous high or low, confirming the continuation of the current trend.
CHoCH occurs when price breaks in the opposite direction for the first time, signaling a potential trend reversal.
Since price movement is inherently fractal, market structure can be analyzed on two distinct levels :
Major / External Structure: represents the dominant macro trend.
Minor / Internal Structure: represents corrective or smaller-scale movements within the larger trend.
🔵 Library Purpose
The “Market Structure Report Library” is designed to automatically detect the current market structure type in real time.
Without drawing or displaying any visuals, it analyzes raw price data and returns a series of logical and textual outputs (Return Values) that describe the current structural state of the market.
It provides the following information :
Trend Type :
External Trend (Major): Up Trend, Down Trend, No Trend
Internal Trend (Minor): Up Trend, Down Trend, No Trend
Structure Type :
BoS : Confirms trend continuation
CHoCH : Indicates a potential trend reversal
Consecutive BoS Counter : Measures trend strength on both Major and Minor levels.
Candle Type : Returns the current candle’s condition(Bullish, Bearish, Doji)
This library is specifically designed for use in Smart Money–based screeners, indicators, and algorithmic strategies.
It can analyze multiple symbols and timeframes simultaneously and return the exact structure type (BoS or CHoCH) and trend direction for each.
🔵 Function Outputs
The function MS() processes the price data and returns seven key outputs,
each representing a distinct structural state of the market. These values can be used in indicators, strategies, or multi-symbol screeners.
🟣 ExternalTrend
Type : string
Description : Represents the direction of the Major (External) market structure.
Possible values :
Up Trend
Down Trend
No Trend
This is determined based on the behavior of Major Pivots (swing highs/lows).
🟣 InternalTrend
Type : string
Description : Represents the direction of the Minor (Internal) market structure.
Possible values :
Up Trend
Down Trend
No Trend
🟣 M_State
Type : string
Description : Specifies the type of the latest Major Structure event.
Possible values :
BoS
CHoCH
🟣 m_State
Type : string
Description : Specifies the type of the latest Minor Structure event.
Possible values :
BoS
CHoCH
🟣 MBoS_Counter
Type : integer
Description : Counts the number of consecutive structural breaks (BoS) in the Major structure.
Useful for evaluating trend strength :
Increasing count: indicates trend continuation.
Reset to zero: typically occurs after a CHoCH.
🟣 mBoS_Counter
Type : integer
Description : Counts the number of consecutive structural breaks in the Minor structure.
Helps analyze the micro structure of the market on lower timeframes.
Higher value : strong internal trend.
Reset : indicates a minor pullback or reversal.
🟣 Candle_Type
Type : string
Description : Represents the type of the current candle.
Possible values :
Bullish
Bearish
Doji
import TFlab/Market_Structure_Report_Library_TradingFinder/1 as MSS
PP = input.int (5 , 'Market Structure Pivot Period' , group = 'Symbol 1' )
= MSS.MS(PP)

Fair Value Gap + VI + FP_FVGThe Ultimate Fair Value Gap Indicator that you need.
Based on ICT's updated definition post 2022, if volume imbalances exists, we have to include the VI as part of the FVG.
As of 2025, ICT has introduced the suspension block - which is a FVG that has VI on both sides of the candle. This indicator shows the suspension block via the border.
Inclusive of HTF and current TF.
First Presented FVG is also included with the option to toggle current day and historical days.

Quarterly Theory [@kaleboraciy]🧠 Daye Quarterly Theory is based on the idea that markets often move in repeating cycles. Each part of the cycle reflects a stage of the market
Consolidation
Manipulation
Distribution
Reversal/Continuation
This is a classic AMD-X pattern, which is widely used in SMC & ICT concepts. By spotting these phases, traders can better understand where the market might be heading next.
⭐ An important feature of this indicator is the Fibonacci levels, which are calculated in a clever way on the Q1 part of each cycle. You can use this levels for precise entries on manipulation in Q2
📖 Now I want to give brief description of each cycle:
Daily Cycle - the day can be broken down into 6 hour quarters
Q1 - 18:00 - 00:00 Asia.
Q2 - 00:00 - 06:00 London (True Open).
Q3 - 06:00 - 12:00 NY AM.
Q4 - 12:00 - 18:00 NY PM.
Pro tips:
Q2 often lines up with the session’s True Open - a key reference for directional bias.
Q3 tends to show the most directional momentum during the trading day.
Q4 is a critical zone for judging whether the day will extend the move or retrace.
Weekly Cycle - Daye determined that although the trading week is composed of 5 trading days, we should ignore Friday, and the small portion of Sunday’s price action:
Q1 - Monday
Q2 - Tuesday (True Open, Daily Candle Open Price).
Q3 - Wednesday.
Q4 - Thursday.
Pro tips:
Wednesday (Q3) often provides the week’s strongest directional movement - many trades target this zone.
Tuesday’s manipulation (Q2) may shake out weak positions or set up the directional swing - be careful
Thursday (Q4) helps confirm whether the weekly trend continues or reverses.
Monthly Cycle - considering that we have four weeks in a month, we start the cycle on the first Monday of the month (regardless of the calendar Day):
Q1 - Week 1: first Monday of the month.
Q2 - Week 2: second Monday of the month (True Open, Daily Candle Open Price).
Q3 - Week 3: third Monday of the month.
Q4 - Week 4: fourth Monday of the month.
I hope, that this awesome tool will boost your trading 💰

ICT Macros - CorrigéThis indicator is designed to help traders apply the concepts of ICT (Inner Circle Trader) by providing a clear and accurate visualization of market macros directly on the chart. Instead of manually drawing levels or constantly switching between timeframes, the indicator automatically highlights the key reference points that form the backbone of ICT analysis.
Key Features:
Automatic Macro Visualization: identifies and displays market macros as defined in ICT concepts, making it easier to recognize institutional levels.
Timeframe Flexibility: adapts to different chart periods, allowing traders to align intraday setups with higher timeframe structures.
Clean and Efficient Display: focuses only on the most relevant information, avoiding clutter and making the chart more readable.
Strategic Decision Support: provides essential context for ICT-based strategies, including identifying market direction, liquidity pools, and potential reversal zones.
Why Use It?
This indicator is built for traders who follow ICT methodology and want a reliable tool to instantly spot macro structure without wasting time on repetitive manual work. By combining precision with clarity, it enhances situational awareness and supports better decision-making in both intraday and swing trading.
