SETUP XANDAO ETFEste setap é usado para operar nos futuros, usamos essas métricas para poder achar entradas
المؤشرات والاستراتيجيات


3 EMA IndicatorThis indicator is a combination og three EMA's
This indicator is a combination og three EMA's
This indicator is a combination og three EMA's
This indicator is a combination og three EMA's
This indicator is a combination og three EMA's

50SMA bounceScans stocks that closed above Weekly 10SMA and previous week closing below the weekly 10SMA

XAU Seasonality + Setup Quality + Month Strength | WarRoomXYZXAU Seasonality Engine is a technical analysis indicator developed for the study of recurring, calendar-based behavior on XAUUSD (Gold).
The tool blends month-of-year seasonality statistics with higher-timeframe context and a setup-quality gate to help users observe when market conditions historically lean strong, weak, or neutral — and how strict trade selection should be during each regime.
Indicator Concept
An indicator for XAUUSD that combines:
1. Seasonality Regime (Month-of-Year Bias)
► Classifies the current month as Strong / Weak / Neutral based on either:
• Preset months (user-defined)
or
• Auto mode (computed from historical monthly performance)
► Strong months suggest a bullish tailwind (not a signal).
► Weak months suggest headwind / caution and require stricter setup quality.
2. Monthly Performance Engine (Under the Hood)
► Uses the symbol’s monthly timeframe data to compute, per calendar month:
• Average monthly return (%)
• Win rate (%) — how often that month closes positive
• Month Strength Score (0–100) — a blended score derived from performance data
► The score is designed to provide a relative strength snapshot of seasonality by month.
3. Month Strength Histogram
► Plots a histogram (0–100) of the current month’s strength score.
• Higher bars = historically stronger month tendency
• Lower bars = historically weaker month tendency
► Optional horizontal reference lines mark “strong” and “weak” zones to make regimes obvious at a glance.
4. Setup Quality Meter (Confluence Filter)
► The indicator calculates a Setup Quality Score (0–100) using market structure and momentum components, such as:
• EMA trend alignment
• Momentum confirmation (EMA fast vs slow)
• Structure break confirmation (BOS)
• Liquidity sweep behavior
• Candle confirmation logic
► This score is intended as a trade-selectivity filter , not a trade executor.
5. Adaptive Rules for Weak Months (Strict Mode)
► When the indicator detects a weak seasonal regime, conditions automatically tighten:
• The A+ threshold increases (adaptive thresholding)
• Optional rule: Weak months require BOS + Sweep + FVG simultaneously before any A+ condition is considered valid
This forces the user into “higher-quality-only” behavior during historically weaker seasonal periods.
🔹1 Visual Components Included
• Seasonality regime label (Strong / Weak / Neutral)
• Optional background shading based on regime
• Month Strength Score histogram (0–100)
• Current month stats: Avg return + win rate
• Setup Quality Meter value (0–100)
• Adaptive A+ threshold display
• Weak-month confluence gate status (BOS / Sweep / FVG pass/fail)
• Optional alerts when strict criteria are met
➣What Means in the XAU Indicator
🔹 Definition (in THIS indicator)
Win Rate = the percentage of historical months that closed positive for the same calendar month.
It is NOT:
trade win rate ❌
signal accuracy ❌
It is a s tatistical seasonality metric .
How It’s Calculated
For each calendar month (January, February, etc.), the indicator:
1.Looks at historical monthly candles (Monthly timeframe).
2. Counts how many times that month:
•Closed higher than it opened (or higher than previous month close).
3. Divides:
Number of positive months
÷
Total number of observed months
× 100
Example: September
If over the last 20 years:
September closed green 14 times
September closed red 6 times
Then:
Win Rate = (14 / 20) × 100 = 70%
That’s what you see as in the dashboard.
What the Win Rate Is Used For
1️⃣ Part of the Month Strength Score
The indicator blends:
•Average Monthly Return (%) → measures magnitude
•Win Rate (%) → measures consistency
Combined into:
Month Strength Score (0–100)
This avoids a common trap:
•A month with 1 huge rally but many losses ≠ reliable
•A month with steady positive closes = higher quality environment
What Win Rate Tells You
High Win Rate (e.g. 65–75%)
•Gold more often closes higher in this month
•Continuation is statistically more likely
•Pullbacks are more likely to resolve in trend direction
Low Win Rate (e.g. 35–45%)
•Gold more often fails to close higher
•More chop, deeper retracements, false breakouts
•Continuation trades statistically struggle
What It Does NOT Tell You
🚫 It does NOT mean:
•“You will win 70% of your trades”
•“Every setup in this month works”
•“Direction is guaranteed”
Seasonality is context, not prediction.
Why This Is Powerful When Combined With Your System
On its own, win rate is just data.
But in your indicator, it’s used to:
•🔒 Raise the A+ threshold in weak months
•🧠 Force BOS + Sweep + FVG confluence
•❌ Block marginal setups automatically
So instead of guessing:
-“Why is gold so choppy this month?”
You know:
-“This month historically underperforms SO I must be stricter.”
➣What Means in the XAU Seasonality Indicator
🔹 Definition (in THIS indicator)
Avg Monthly Return = the average percentage gain or loss of XAUUSD for a specific calendar month, calculated across many years.
It measures magnitude , not frequency.
It is NOT:
•trade profit ❌
•expected return for the next month ❌
•guaranteed performance ❌
It is a historical seasonality tendency.
How It’s Calculated
For each calendar month (January, February, etc.), the indicator:
1.Takes every historical occurrence of that month.
2.Calculates the percentage change of the monthly candle:
(Monthly Close − Previous Monthly Close)
÷ Previous Monthly Close × 100
3. Adds all those percentage changes together.
4. Divides by the total number of observations.
Example: September
Assume over 20 years:
+2.4%, +1.1%, −0.6%, +3.0%, +1.8%, ...
If the sum of all September returns = +28% across 20 years:
Avg Monthly Return = +1.40%
That’s the number displayed in the indicator.
What Avg Monthly Return Is Used For
1️⃣ Measuring Strength of Movement
•Win Rate → “How often does it close green?”
•Avg Monthly Return → “How big are the moves when it works?”
Both are needed.
A month can:
•Win often but move very little
•Move a lot but only occasionally
The indicator combines both to avoid misleading conclusions.
How to Interpret Avg Monthly Return
Positive Avg Return (e.g. +0.8% to +2.0%)
•Gold tends to expand during this month
•Continuation phases are more likely
•Pullbacks are often absorbed
Near-Zero Avg Return (e.g. −0.2% to +0.2%)
•Market is statistically balanced
•Expect chop, rotations, false breaks
•Continuation is less reliable
Negative Avg Return (e.g. −0.5% or worse)
•Downward pressure or heavy mean reversion
•Rallies often fade
•Risk of aggressive stop hunts
What Avg Monthly Return Does NOT Mean
🚫 It does NOT mean:
•“Price will move +1.4% this month”
•“You should buy because the number is positive”
•“This is a guaranteed edge”
It describes historical behavior, not future certainty.
Why Avg Monthly Return Matters More Than People Think
Two months can have the same win rate but behave very differently:
Example:
Month Win Rate Avg Return Reality
Month A 65% +0.2% Small, choppy wins
Month B 55% +1.6% Fewer wins, but strong expansions
Your indicator would rank Month B as stronger, which is correct for continuation-based strategies.
How It Feeds the Month Strength Score
The indicator blends:
•60% Avg Monthly Return (normalized)
•40% Win Rate
This means:
•Big moves matter more than small consistency
•But consistency still matters enough to prevent distortion
Result:
Month Strength Score (0–100)
Which is then used to:
•tighten or relax A+ thresholds
•activate weak-month strict rules
•control trade frequency
🔹2. Intended Use
The indicator is designed as a discretionary analysis tool to support study of:
• seasonal bias and calendar tendencies
• relative strength/weakness across months
• how strict trade selection should be across different regimes
• confluence behavior when seasonal conditions are unfavorable
The tool does not generate forecasts, does not guarantee outcomes, and should not be relied upon as a stand-alone decision mechanism.
🔹3.How to Use XAU Seasonality Engine
Recommended charts: XAUUSD, intraday (5m–15m) with a HTF context (1H–4H).
1. Identify the Seasonal Regime
• Strong month → you can allow more continuation bias (still require structure).
• Neutral month → trade normally, standard criteria.
• Weak month → tighten selection, demand clean A+ conditions only.
2. Read the Month Strength Histogram
• If the score is high (e.g., 70+), the month has historically shown stronger tendency.
• If the score is low (e.g., 40 and below), expect slower conditions, deeper pullbacks, or more chop — and reduce marginal trades.
3. Use the Setup Quality Meter as the Gate
► In normal/strong months:
• A+ threshold is moderate (e.g., 70)
► In weak months:
• A+ threshold is higher (e.g., 80+)
• Optional strict mode: must also pass BOS + Sweep + FVG alignment
4. Example Trade Logic (Framework, Not Signals)
► Bullish framework in a Strong Month:
• Seasonal regime = Strong (tailwind)
• Structure supports bullish continuation (trend alignment)
• Sweep occurs into demand / liquidity grab
• Setup Quality reaches A+ threshold
• Entry: confirmation candle or retrace to key level
• SL: beyond sweep low / invalidation
• TP: nearest liquidity / prior highs / HTF level
► Weak Month rule-set (Strict Mode):
• Seasonal regime = Weak (headwind)
• Only consider trades if:
✅ BOS confirms direction
✅ Sweep occurs and rejects cleanly
✅ FVG exists recently (or is mitigated if you choose that model)
✅ Setup Quality exceeds the elevated adaptive threshold
If any one is missing → no trade
This is not meant to “predict” gold — it’s meant to enforce discipline when seasonality historically underperforms.
🔹4.Limitations and User Responsibility
► The indicator does not represent financial advice or imply performance expectations.
► Seasonality is statistical tendency, not certainty — macro conditions can override it.
► Results vary by broker feed, timeframe, and settings.
► Users should test thoroughly in simulation before applying to live markets.
► All trading decisions, risk management, and execution remain solely the responsibility of the user.
🔹5. Alerts
Optional alerts can notify when:
• a new month begins and the seasonal regime changes
• A+ criteria are met
• weak-month strict conditions pass (BOS + Sweep + FVG)
Alerts are informational only and do not constitute actionable recommendations.
Disclaimer
This script is provided for informational and educational purposes only . It does not provide financial, investment, or trading advice, and it does not guarantee profits or future performance. All decisions made based on this script are solely the responsibility of the user.
This script does not execute trades, manage risk, or replace the need for trader discretion. Market behavior can change quickly, and past behavior detected by the script does not ensure similar future outcomes.
Users should test the script on demo or simulation environments before applying it to live markets and must maintain full responsibility for their own risk management, position sizing, and trade execution.
Trading involves risk, and losses can exceed deposits. By using this script, you acknowledge that you understand and accept all associated risks.

Print Bar DataThis script print out the recent bar data. You can configure the position, bar numbers, of the data

ProTradersNetwork-inefficiencyInefficiency Candles Colored, No matter the timeframe, ensures clear visibility of which candles had the most momentum.


Fixed Time Frame EMA [TickDaddy]Show a 50 period EMA on the 15 minute timeframe on any other timeframe like 5 min, 1 min, 1 hour, etc.. etc..
it's all customizable, you choose the timeframe, ema, color, all that good stuff.

3 Trading Sessions [TickDaddy]Customizable 3 trading session indicator. Asia, Longdon, New York. Adjust times for each session, color, opacity. toggle if you want to see future sessions coming up.

High Vol Big Move (Up or Down)Nine million EP with 4% stock moved up or down, and today's volume is more than yesterday's volume.

ORB 2R Retest Volume Entry (1m) - v6gJdsfjs kdfg s jdslzi gdsjzg SJFds SJKdls dsjzgfjdkzl GDMKls gndsmzgSfgndmsKF fdnsioGLfs

Gold DropGold Drop – Intraday Trading System (India Markets)
Gold Drop is a rule-based intraday trading strategy designed specifically for Indian index trading (BANKNIFTY / NIFTY), combining trend, momentum, strength, and fixed reference levels to deliver consistent and disciplined trade execution.
The system is built to avoid emotional trading, over-trading, and shifting levels during the session

Sessions + EMAS + Nube (Mini Table)This indicator is designed to help traders analyze market trends and identify potential trading opportunities.
It provides clear visual signals based on price behavior and technical calculations, allowing traders to better understand market structure, momentum, and direction.
The indicator can be used on any market and timeframe, making it suitable for both intraday and swing trading.
It is intended as a decision-support tool and should be used in combination with proper risk management and other forms of analysis.

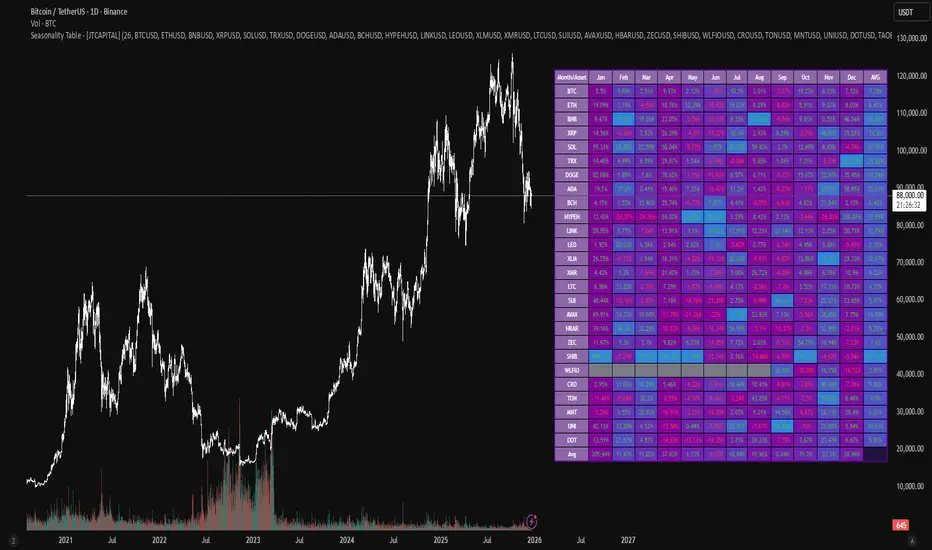
Seasonality Table - [JTCAPITAL]Seasonality Table - is a modified way to use monthly return aggregation across multiple assets to identify seasonal trends in cryptocurrencies and indices.
The indicator works by calculating in the following steps:
Asset Selection
The user defines a list of assets to include in the seasonality table. By default, the script allows up to 32 assets, including popular cryptocurrencies like BTC, ETH, BNB, XRP, and others. Each asset is identified by its symbol (e.g., "CRYPTO:BTCUSD").
Monthly Return Calculation
For each asset, the script requests monthly price data using request.security. Specifically, it retrieves the monthly open, close, and month number. The monthly return is calculated as:
Return = (Close - Open) / Open
This step provides a normalized measure of performance for each asset per month.
Data Aggregation
The script stores two key arrays for each asset and month combination:
sumReturns: The cumulative sum of monthly returns
countReturns: The number of months with valid data
This allows averaging returns later while handling months with missing data gracefully.
Table Construction
Rows representing months (January–December)
Columns representing each asset
An additional column showing the average return for all assets per month
A final row showing the yearly average return for each asset
Filling the Table
The table cells are filled as follows:
Monthly returns are averaged for each asset and displayed as a percentage.
Positive returns are colored green, negative returns red.
Missing data is displayed as a gray “—” placeholder.
Each row’s values are normalized for the color gradient to show relative performance.
Averages Computation
The script calculates two types of averages:
Monthly Average Across Assets : Sum of all asset returns for a month divided by the number of valid data points.
Yearly Average Per Asset : Sum of all monthly returns for an asset divided by the number of months with valid data.
These averages are displayed in the last column and last row respectively, with gradient coloring for visual comparison.
Buy and Sell Conditions
This indicator does not generate explicit buy or sell signals. Instead, it provides a visual heatmap of historical seasonality, allowing traders to:
Identify months where an asset historically outperforms (bullish bias)
Identify months with weak historical performance (bearish caution)
Compare seasonal patterns across multiple assets for portfolio allocation
Filters can be applied by adjusting the asset list, changing the color mapping, or focusing on specific months to highlight seasonal anomalies.
Features and Parameters
Number of assets: Set how many assets are included in the table (1–32).
Assets: Input symbols for the assets you want to analyze.
Low % Color: Defines the color for the lowest monthly returns in the gradient.
High % Color: Defines the color for the highest monthly returns in the gradient.
Cleaned asset names for concise display.
Gradient-based visualization for easier pattern recognition.
Monthly and yearly averages for comparative analysis.
Specifications
Monthly Return Calculation
Uses the formula (Close - Open) / Open for each asset per month. This standardizes performance across different price scales and ensures comparability between assets.
Arrays for Storage
sumReturns: Float array storing cumulative monthly returns.
countReturns: Integer array storing the number of valid data points per month.
These arrays allow efficient aggregation and average calculations without overwriting previous values.
Data Retrieval via Security Calls
Requests monthly OHLC data for each asset using request.security.
Ensures calculations reflect the correct timeframe and allow for historical comparison.
Color and Text Assignment
Green text for positive returns, red for negative returns.
Gray cells indicate missing data.
Gradient background shows relative magnitude within the month.
Seasonality Analysis
The table visually encodes which months historically produce stronger returns.
Useful for portfolio rotation, risk management, and identifying cyclical trends.
Scalability
Supports up to 32 assets.
Dynamically adapts to the number of assets and data availability.
Gradient scales automatically per row for consistent comparison.
Maestro 4hThis indicator is designed to help traders analyze market trends and identify potential trading opportunities.
It provides clear visual signals based on price behavior and technical calculations, allowing traders to better understand market structure, momentum, and direction.
The indicator can be used on any market and timeframe, making it suitable for both intraday and swing trading.
It is intended as a decision-support tool and should be used in combination with proper risk management and other forms of analysis.

Muros Multi-TF Pro Dashboard v2fwrvw w fw wf fs rf wf wf jni hb hu huhb yhi ib i ibb uoobu ic biicb ibc bic k

SFI Follow Trend Level 1 ( SFI Academy )“SFI Trading Level 1 Indicator is a proprietary indicator used by SFI Academy for its students, in combination with SFI Academy’s exclusive capital management toolset.”

XAUUSD M15 FINALDetects when xausd enters a healthy directional phase during the NY session, and only flags entries with real momentum and controlled volatility.

XAUUSD M15 momentum realDetects when xausd enters a healthy directional phase during the NY session, and only flags entries with real momentum and controlled volatility.

XAUUSD M15 momentum real Detects when xausd enters a healthy directional phase during the NY session, and only flags entries with real momentum and controlled volatility.

Iridescent Liquidity Prism [JOAT]Iridescent Liquidity Prism | Peer Momentum HUD
A multi-layered order-flow indicator that combines microstructure analysis, smart-money footprint detection, and intermarket momentum signals. The script uses dynamic color-shifting themes to visualize liquidity patterns, structure, and peer momentum data directly on the chart.
There is so much to choose from inside the settings, if you think it's a mess on the chart it's because you have to personally customize it based on your needs...
Core Functionality
The indicator calculates and displays several analytical layers simultaneously:
Order-Flow Imbalance (OFI): Calculates buy vs. sell volume pressure using volume-weighted price distribution within each bar. Uses an EMA filter (default: 55 periods) to smooth the signal. Values are normalized using standard deviation to identify significant imbalances.
Smart Money Footprints: Detects accumulation and distribution zones by comparing volume rate of change (ROC) against price ROC. When volume ROC exceeds a threshold (default: 65%) and price ROC is positive, accumulation is detected. When volume ROC is high but price ROC is negative, distribution is detected.
Fractal Structure Mapping: Identifies pivot highs and lows using a fractal detection algorithm (default: 5-bar period). Maintains a rolling window of recent structure points (default: 4 levels) and draws connecting lines to show trend structure.
Fair Value Gap (FVG) Detection: Automatically detects price gaps where three consecutive candles create an imbalance. Bullish FVGs occur when the current low exceeds the high two bars ago. Bearish FVGs occur when the current high is below the low two bars ago. Gaps persist for a configurable duration (default: 320 bars) and fade when price fills the gap.
Liquidity Void Detection: Identifies candles where the high-low range exceeds an ATR threshold (default: 1.7x ATR) while volume is below average (default: 65% of 20-bar average). These conditions suggest areas where liquidity may be thin.
Price/Volume Divergence: Uses linear regression to detect when price trend direction disagrees with volume trend direction. A divergence alert appears when price is trending up while volume is trending down, or vice versa.
Peer Momentum Heatmap (PMH): Calculates composite momentum scores for up to 6 symbols across 4 timeframes. Each score combines RSI (default: 14 periods) and StochRSI (default: 14 periods, 3-bar smooth) to create a momentum composite between -1 and +1. The highest absolute momentum score across all combinations is displayed in the HUD.
Custom settings using Fractal Pivots, Skeleton Structure, Pulse Liquidity Voids, Bottom Colorful HeatMaps, and Iridescent Field.
---
Visual Components
Spectrum Aura Glow: ATR-weighted bands (default: 0.25x ATR) that expand and contract around price action, indicating volatility conditions. The thickness adapts to market volatility.
Chromatic Flow Trail: A blended line combining EMA and WMA of price (default: 8-period EMA blended with WMA at 65% ratio). The trail uses gradient colors that shift based on a phase oscillator, creating an iridescent effect.
Volume Heat Projection: Creates horizontal volume profile bands at price levels (default: 14 levels). Scans recent bars (default: 150 bars) to calculate volume concentration. Each level is colored based on its volume density relative to the maximum volume level.
Structure Skeleton: Dashed lines connecting fractal pivot points. Uses two layers: a primary line (2-3px width) and an optional glow overlay (4-5px width) for enhanced visibility.
Fractal Markers: Diamond shapes placed at pivot high and low points. Color-coded: primary color for highs, secondary color for lows.
Iridescent Color Themes: Five color themes available: Iridescent (default), Pearlescent, Prismatic, ColorShift, and Metallic. Colors shift dynamically using a phase oscillator that cycles through the color spectrum based on bar index and a speed multiplier (default: 0.35).
---
HUD Console Metrics
The right-side HUD displays seven key metrics:
Flow: Shows OFI status: ▲ FLOW BUY when normalized OFI exceeds imbalance threshold (default: 2.2), ▼ FLOW SELL when below -2.2, or ◆ FLOW BAL when balanced.
Struct: Structure trend bias: ▲ STRUCT BULL when microtrend > 2, ▼ STRUCT BEAR when < -2, or ◆ STRUCT RANGE when neutral.
Smart$: Institutional activity: ◈ ACCUM when smart money index = 1, ◈ DISTRIB when = -1, or ○ IDLE when inactive.
Liquid: Liquidity state: ⚡ VOID when a liquidity void is detected, or ● NORMAL otherwise.
Diverg: Divergence status: ⚠ ALERT when price/volume divergence detected, or ✓ CLEAR when aligned.
PMH: Peer Momentum Heatmap status: Shows dominant timeframe and momentum score. Displays 🪩 for bull surge (above 0.55 threshold) or 🧨 for bear surge (below -0.55).
FVG: Fair Value Gap status: Shows active gap count or CLEAR when no gaps exist. Displays GAP LONG when bullish gap detected, GAP SHORT when bearish gap detected.
Pearlscent Color with Volume Heatmap.
Parameters and Settings
Microstructure Engine:
Analysis Depth: 20-250 bars (default: 55) - Controls OFI smoothing period
Liquidity Threshold ATR: 1.0-4.0 (default: 1.7) - Multiplier for void detection
Imbalance Ratio: 1.5-6.0 (default: 2.2) - Standard deviations for OFI significance
Smart Money Layer:
Smart Money Window: 10-150 bars (default: 24) - Period for ROC calculations
Accumulation Threshold: 40-95% (default: 65%) - Volume ROC threshold
Structural Mapping:
Fractal Pivot Period: 3-15 bars (default: 5) - Period for pivot detection
Structure Memory: 2-8 levels (default: 4) - Number of structure points to track
Volume Heat Projection:
Heat Map Lookback: 60-400 bars (default: 150) - Bars to analyze for volume profile
Heat Map Levels: 5-30 levels (default: 14) - Number of price level bands
Heat Map Opacity: 40-100% (default: 92%) - Transparency of heat map boxes
Heat Map Width Limit: 6-80 bars (default: 26) - Maximum width of heat map boxes
Heat Map Visibility Threshold: 0.0-0.5 (default: 0.08) - Minimum density to display
Iridescent Enhancements:
Visual Theme: Iridescent, Pearlescent, Prismatic, ColorShift, or Metallic
Color Shift Speed: 0.05-1.00 (default: 0.35) - Speed of color phase oscillation
Aura Thickness (ATR): 0.05-1.0 (default: 0.25) - Multiplier for aura band width
Chromatic Trail Length: 2-50 bars (default: 8) - Period for trail calculation
Trail Blend Ratio: 0.1-0.95 (default: 0.65) - EMA/WMA blend percentage
FVG Persistence: 50-600 bars (default: 320) - Bars to keep FVG boxes active
Max Active FVG Boxes: 10-200 (default: 40) - Maximum boxes on chart
FVG Base Opacity: 20-95% (default: 80%) - Transparency of FVG boxes
Peer Momentum Heatmap:
Peer Symbols: Comma-separated list of up to 6 symbols (e.g., "BTCUSD,ETHUSD")
Peer Timeframes: Comma-separated list of up to 4 timeframes (default: "60,240,D")
PMH RSI Length: 5-50 periods (default: 14)
PMH StochRSI Length: 5-50 periods (default: 14)
PMH StochRSI Smooth: 1-10 periods (default: 3)
Super Momentum Threshold: 0.2-0.95 (default: 0.55) - Threshold for surge detection
Clarity & Readability:
Liquidity Void Opacity: 5-90% (default: 30%)
Smart Money Footprint Opacity: 5-90% (default: 35%)
HUD Background Opacity: 40-95% (default: 70%)
Iridescent Field:
Field Opacity: 20-100% (default: 86%) - Background color intensity
Field Smooth Length: 10-200 bars (default: 34) - Smoothing for background gradient
---
Alerts
The indicator provides seven alert conditions:
Liquidity Void Detected - Triggers when void conditions are met
Strong Order Flow - Triggers when normalized OFI exceeds imbalance ratio
Smart Money Activity - Triggers when accumulation or distribution detected
Price/Volume Divergence - Triggers when divergence conditions occur
Structure Shift - Triggers when structure polarity changes significantly
PMH Bull Surge - Triggers when PMH exceeds positive threshold (if enabled)
PMH Bear Surge - Triggers when PMH exceeds negative threshold (if enabled)
Bull/Bear Prismatic FVG - Triggers when new FVG is detected (if FVG display enabled)
---
Usage Considerations
Performance may vary on lower timeframes due to the volume heat map calculations scanning multiple bars. Consider reducing heat map lookback or levels if experiencing slowdowns.
The PMH feature requires data requests to other symbols/timeframes, which may impact performance. Limit the number of peer symbols and timeframes for optimal performance.
FVG boxes automatically expire after the persistence period to prevent chart clutter. The maximum box limit (default: 40) prevents excessive memory usage.
Color themes affect all visual elements. Choose a theme that provides good contrast with your chart background.
The indicator is designed for overlay display. All visual elements are positioned relative to price action.
Structure lines are drawn dynamically as new pivots form. On fast-moving markets, structure may update frequently.
Volume calculations assume typical volume data availability. Symbols without volume may show incomplete data for volume-dependent features.
---
Technical Notes
Built on Pine Script v6 with dynamic request capability for PMH functionality.
Uses exponential moving averages (EMA) and weighted moving averages (WMA) for trail calculations to balance responsiveness and smoothness.
Volume profile calculation uses price level buckets. Higher levels provide finer granularity but require more computation.
Iridescent color engine uses a phase oscillator with sine wave calculations for smooth color transitions.
Box management includes automatic cleanup of expired boxes to maintain performance.
All visual elements use color gradients and transparency for smooth blending with price action.
---
Customization Examples
Intraday Scalping Setup:
Analysis Depth: 30 bars
Heat Map Lookback: 100 bars
FVG Persistence: 150 bars
PMH Window: 15 bars
Fast color shift speed: 0.5+
Macro Structure Tracking:
Analysis Depth: 100+ bars
Heat Map Lookback: 300+ bars
FVG Persistence: 500+ bars
Structure Memory: 6-8 levels
Slower color shift speed: 0.2
---
Limitations
Volume heat map calculations may be computationally intensive on lower timeframes with high lookback values.
PMH requires valid symbol names and accessible timeframes. Invalid symbols or timeframes will return no data.
FVG detection requires at least 3 bars of history. Early bars may not show FVG boxes.
Structure lines connect points but do not predict future structure. They reflect historical pivot relationships.
Color themes are aesthetic choices and do not affect calculation logic.
The indicator does not provide trading signals. All visual elements are analytical tools that require interpretation in context of market conditions.
Open Source
This indicator is open source and available for modification and distribution. The code is published with Pine Script v6 compliance. Users are free to customize parameters, modify calculations, and adapt the visual elements to their trading needs.
For questions, suggestions, or anything please talk to me in private messages or comments below!
Would love to help!
- officialjackofalltrades

Order Flow: Structural Sniper [Profile + Signals]Overview
This script is a comprehensive tool designed to bridge the gap between Market Structure and Order Flow analysis. It aims to eliminate the subjectivity of static support and resistance lines by focusing on dynamic liquidity and the behavior of aggressive versus passive market participants.
Unlike traditional indicators that plot static data, the Structural Delta Map dynamically anchors its analysis to the start of the current trend (Pivots), providing a clear "X-Ray" view of how volume was distributed during the current price swing.
How it Works
The indicator combines three distinct technical concepts into a single system:
1. Market Structure (Pivots):
It uses a pivot detection algorithm to identify significant Swing Highs and Swing Lows. This determines the market bias and anchors the analysis to the origin of the movement.
2. Anchored VWAP (Fair Price):
It automatically calculates the Volume Weighted Average Price (VWAP) starting from the last confirmed pivot. This yellow line acts as the "spine" of the trend, serving as dynamic institutional support/resistance.
3. Delta Profile & Heatmap:
A Volume Profile is plotted on the left side, anchored to the pivot.
Split Delta: Instead of a single color, bars are split into Green (Buying Volume) and Red (Selling Volume) based on price action estimation.
Heatmap Logic: The opacity of the bars adjusts automatically. Bright/Solid bars represent High Volume Nodes (HVN), while transparent bars represent Low Volume Nodes (LVN) or liquidity voids.
How to Use (Strategy)
The indicator provides both visual context and specific entry signals:
1. Visual Context:
Profile: Look for reactions at bright, wide bars (High Volume Nodes). These act as magnets or barriers.
Yellow Line (VWAP): In an uptrend, look for buy opportunities when price retraces to this line. In a downtrend, look for shorts on the retest.
2. Aggression Signals (Triangle "AGR"):
Type: Trend Continuation / Pullback.
Logic: Triggers when price retraces to the structural value zone (near VWAP), rejects it with higher-than-average volume, and closes in the direction of the trend.
3. Absorption Signals (Cross "ABS"):
Type: Reversal / Trap.
Logic:
Bullish Absorption: Price makes a new local low with high volume (selling pressure), but the candle closes bullish (leaving a long bottom wick). Passive buyers absorbed the aggression.
Bearish Absorption: Price makes a new local high with high volume, but closes bearish. Passive sellers absorbed the buying pressure.
Settings
Pivot Sensitivity: Adjusts how the script detects trend changes.
Profile Resolution: Controls the number of rows in the histogram.
Signal Filters: Enable/Disable signals and adjust the Volume Multiplier threshold.
Technical Disclaimer
This indicator estimates "Delta" (Buy vs. Sell volume) based on OHLC price action and bar volume, as Pine Script does not grant access to historical tick-by-tick data. While this approximation is highly effective for identifying aggression and absorption, it differs slightly from Level 2 footprint data found on platforms like Sierra Chart. Accuracy depends on the volume data provided by your exchange.
