Camarilla Pivot Points V2 Strategy Camarilla pivot point formula is the refined form of existing classic pivot point formula.
The Camarilla method was developed by Nick Stott who was a very successful bond trader.
What makes it better is the use of Fibonacci numbers in calculation of levels.
Camarilla equations are used to calculate intraday support and resistance levels using
the previous days volatility spread. Camarilla equations take previous day’s high, low and
close as input and generates 8 levels of intraday support and resistance based on pivot points.
There are 4 levels above pivot point and 4 levels below pivot points. The most important levels
are L3 L4 and H3 H4. H3 and L3 are the levels to go against the trend with stop loss around H4 or L4 .
While L4 and H4 are considered as breakout levels when these levels are breached its time to
trade with the trend.
WARNING:
- For purpose educate only
- This script to change bars colors.
ابحث في النصوص البرمجية عن "pivot"
Camarilla Pivot Points V2 Camarilla pivot point formula is the refined form of existing classic pivot point formula.
The Camarilla method was developed by Nick Stott who was a very successful bond trader.
What makes it better is the use of Fibonacci numbers in calculation of levels.
Camarilla equations are used to calculate intraday support and resistance levels using
the previous days volatility spread. Camarilla equations take previous day’s high, low and
close as input and generates 8 levels of intraday support and resistance based on pivot points.
There are 4 levels above pivot point and 4 levels below pivot points. The most important levels
are L3 L4 and H3 H4. H3 and L3 are the levels to go against the trend with stop loss around H4 or L4 .
While L4 and H4 are considered as breakout levels when these levels are breached its time to
trade with the trend.
WARNING:
- For purpose educate only

Scalper Pro Pivot - Scalpers WeaponToday I feel good to share with my all pals a new "Pivot Point" indicator which I never thought that it could be that easily done. I have been trading for years but I am, to be honest, new to pine script. I used to code other programming languages in the past like HTML, CSS, javascript, PHP, etc web-based programming language which luckily helped me to understand pinescript. It was a bit of my history about coding now talking to the main reason why I created this script in the first place? The answer is simple "I mean who the hell don't want to make their own indicators which work to accomplish own goals". There are lots of indicators which I saw in the public library as well as inside build in but, to be honest, I didn't found any pivot point indicator which calculates the "Fibonacci" method. Even if there are hundreds of pivot point indicators out there in public and built-in but they were either in higher timeframe (daily or above resolution) and weren't on a lower timeframe like starting from 1-minute resolution. There are some lower timeframe pivot point indicators but they aren't using the same method of calculation which I wished and if I ever figure out one then they just end up being repaints which didn't work properly as I wanted. The last but not least reason to create this indicator was obviously for all those short term traders (Scalpers) which I believe this indicator will be a game-changer by adding more support on their current trading strategies. It is so flexible that we can change the resolution from 1min to 1month and, to be honest with you all Fibonacci method used pivot points works most of the time with my own years of personal experience using them in higher timeframes and that is mainly one reason why I was eager to make one which can be used in lower timeframes. It will be useful for all types of traders (short-mid-long). The indicator was specially created for my own scalping purposes and indeed at the end, the creation of this indicator became like if I was mean to dedicate this to my fellow scalper's out there who value the pivot point! Lastly, I would like to give credit to pine script who gave support and knowledge for pine script as well as 'LonesomeTheBlue ' my friend who fixed some issue within the code and without him, my imagination wouldn't have been a reality. Inbox me if you are interested in it. Cheers!

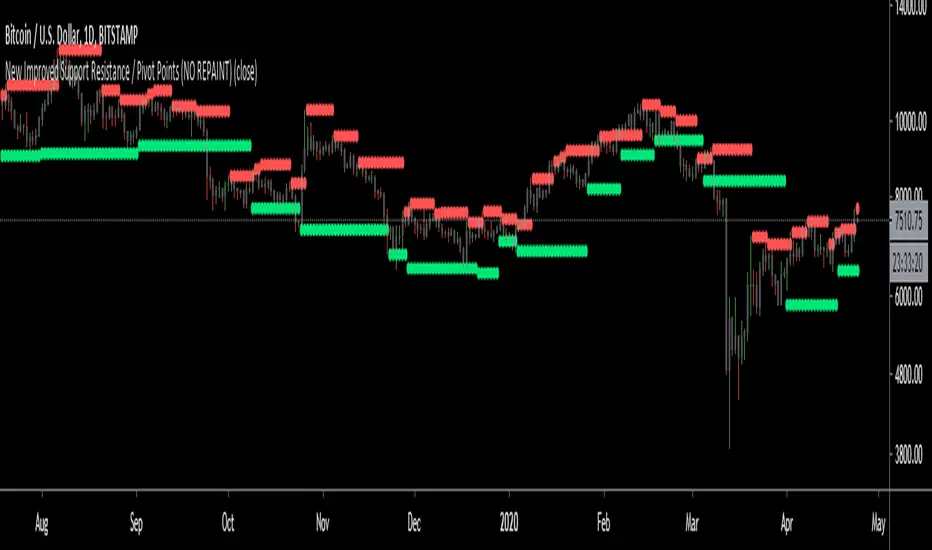
New Improved Support Resistance / Pivot Points (NO REPAINT)This indicator plots local pivot points / support resistance levels in real time (No Repaint). I created this indicator based on my own research and testing (i.e. it is not just a a Pinescript adaptation of some other indicator available online).
The Problem with Similar Indicators Which Are Currently Available On TradingView:
Inaccurate placement of swing/pivot/SR points (making your screen cluttered with meaningless levels).
Repainting (meaning the historical values change as new data becomes available; this is misleading and not very useful when trading in real time).
Have a long delay before confirming/plotting the new pivot points (20/20 hindsight...).
Require you to specify a lookback period and simply looks for the highest or lowest value over that time frame (which isn't very useful since it disregards all of the swings in between).
Do not show all of the historical swing levels, only the most recent ones.
My Solution:
Accurately places swing/pivot/SR points on local highs and lows once a short term trend is over (allowing you to easily identify reversal points).
Does not repaint (the historic values shown are exactly what would have been seen upon the close of the given candles in live trading; this means you can use this indicator for live trading).
Has minimal lag. New swing lows/highs are typically identified by this indicator on the candle which immediately following the swing point (this allows for better entries/exits rather than waiting for the price to run too far in the wrong direction before confirmation).
No lookback period required. The indicator will automatically identify new swings regardless how long the run lasts.
Allows you to adjust for more/less sensitivity.
P.S.: Future developments will be using these levels to create an automatic plot of fibonacci retracement levels.
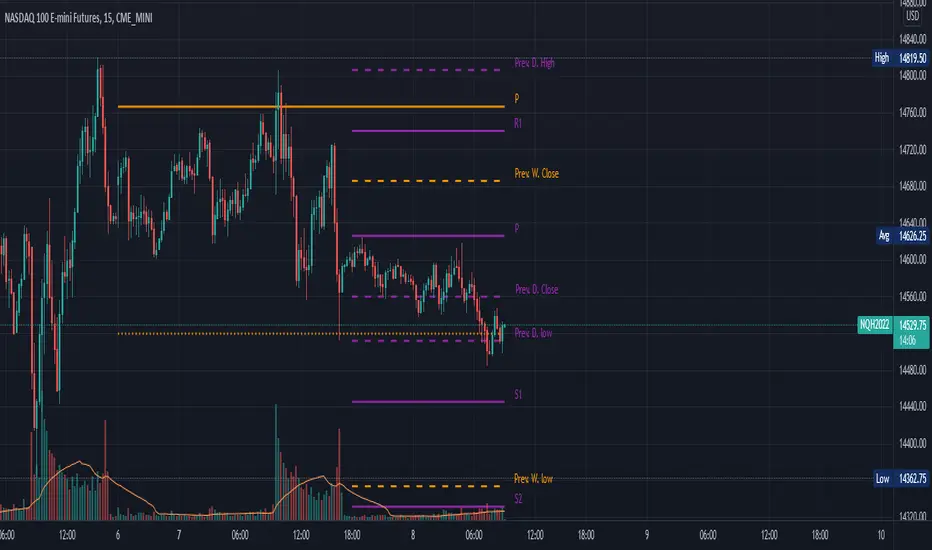
Pivot Points, Daily, Weekly, Open and Close lines What is a Pivot Point?
A pivot point is a technical analysis indicator, or calculations, used to determine the overall trend of the market over different time frames. The pivot point itself is simply the average of the high, low and closing prices from the previous trading day. On the subsequent day, trading above the pivot point is thought to indicate ongoing bullish sentiment, while trading below the pivot point indicates bearish sentiment.
The pivot point is the basis for the indicator, but it also includes other support and resistance levels that are projected based on the pivot point calculation. All these levels help traders see where the price could experience support or resistance. Similarly, if the price moves through these levels it lets the trader know the price is trending in that direction.
When the price of an asset is trading above the pivot point, it indicates the day is bullish or positive.
When the price of an asset is trading below the pivot point, it indicates the day is bearish or negative.
The indicator typically includes four additional levels: S1, S2, R1, and R2. These stand for support one and two, and resistance one and two.
Support and resistance one and two may cause reversals, but they may also be used to confirm the trend. For example, if the price is falling and moves below S1, it helps confirm the downtrend and indicate a possible continuation to S2.
This Script includes the Mid Pivot Points, Open and Close levels
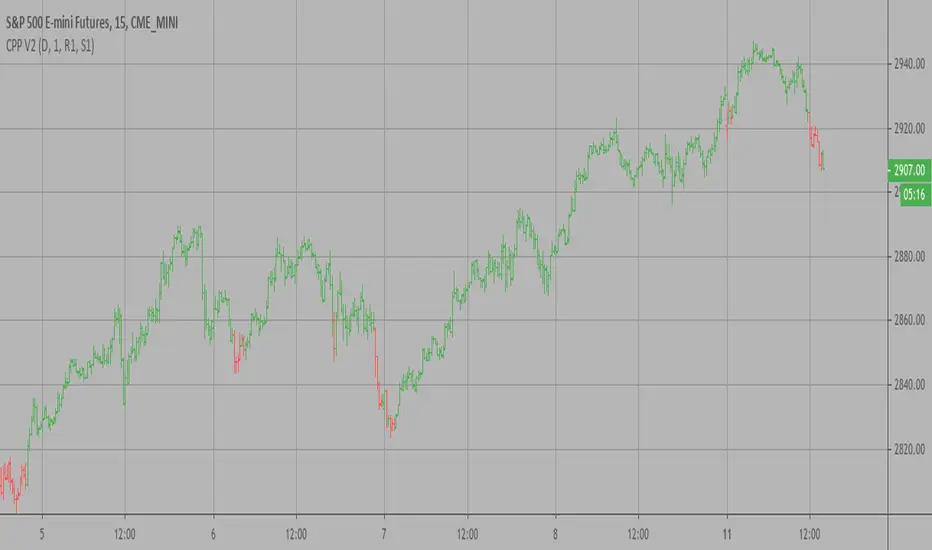
pivot point strategy(lirshah)The pivot point levels are composed of a pivot point, two higher resistance levels known as R1 and R2, and two lower pivot point supports known as S1 and S2.
Each resistance level is considered a pivot point.
this strategy gives signals based on valid pivot points( reactionary price level) and it has a good results on the variety of pairs in different markets.

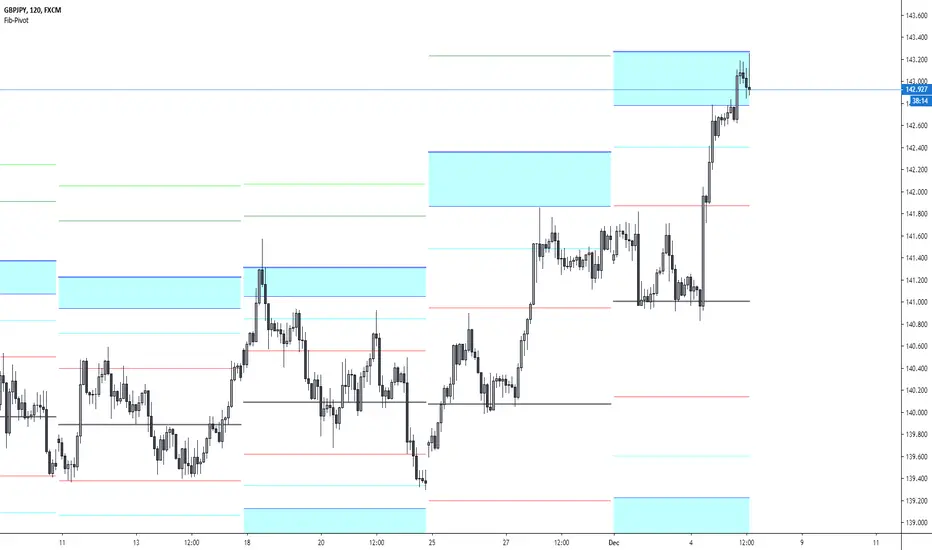
Fibonacci-Pivot PointFibonacci Pivot Point Indicator
Default Time Frame = Weekly
Buy Sell zones
Pivot Levels
PP 0.00% white line = Pivot point
SR red lines = Support Resistance Level 1, Fibonacci 38.2
SR aqua zones = Support Resistance Trading zone, Fibonacci 61.8~78.6
SR blue lines = Support Resistance Level 4, Fibonacci 100

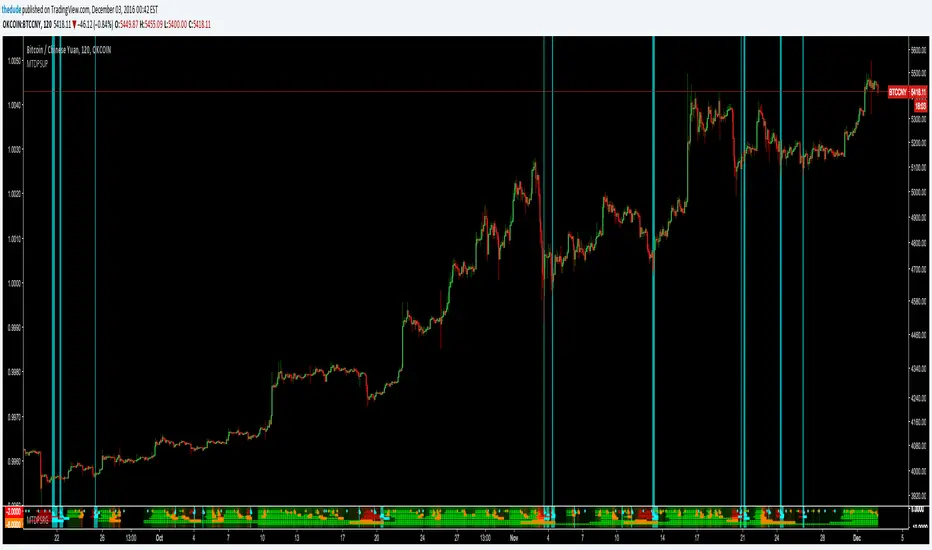
Dudes Multi Time-Frame Pivot System [[Up Only]]Dudes Multi Time-Frame Pivot System [ ]
This is the first public beta of a new "ribbon" type of indicator which shows trend information and pivot candle information for 8 different timeframes, all within a very compact and visually appealing space.
It is extremely useful for pinpointing trend changes or current trend by giving you information from 8 different timeframes on one chart. The idea is if multiple time-frames are in sync with each other, the stronger the signal will be. You can easily set alarms on pivot points to trigger Tradingview to send an email or SMS when an important signal appears on the chart. To trigger the alarm, set the indicator to "Cross Up" on the value 0.5. The value of the variable holding candle data is a binary 0 or 1.
The ribbon strategy is split into 3 different indicators because of the large amount of code required to calculate everything. Please contact me if you are interested in purchasing a subscription to the strategy or want more information. The current subscription price is starting at $50USD on a monthly basis. There will be 2 other shared scripts for the other 2 parts of this indicator; Down and Red/Green. Contact me here on tradingview via PM, or via email thedudeontv@gmail.com if you are interested
[RS][IL]Median Pivots V0EXPERIMENTAL: median pivots calculated from open to extremes.
original idea from Ivan Labrie.

Arbitrary Price Pivots;Coondawg71Custom tool for establishing Price Pivots based on a Arbitrary price set by the user. Plug in any price in the input such as a daily open, weekly open, All Time High/Low, Big Round Number, I like using Fix Rates which can be difficult to establish but hidden support and resistance levels are established by central banks based on their respective trading bands. Great tool to use on Forex pairs under going heavy handed Central Bank intervention....ala USDRUB

Pivotal Point Detection
The indicator highlights price gaps (overnight gaps) with significantly increased volume in the daily chart only. These price jumps can occur after earnings reports or other significant news and often point to an important event (e.g., a new product or business model). According to Jesse Livermore, these are called Pivotal Points.
The price jumps displayed by the indicator are not a guarantee that they represent a true Pivotal Point, but they provide a hint of a significant business development - especially when they occur repeatedly alongside revenue growth. This can help identify potentially strong growth stocks and high-performing investments. However, the underlying events and connections must be investigated through additional research.
make posible to find stocks like:
NYSE:PLTR NASDAQ:ROOT NASDAQ:NVDA NYSE:CVNA NYSE:LRN
A "pivotal price line" is drawn at the opening price of the Pivotal Point. This line is considered a support level. If the price falls below this line, the Pivotal Point loses its validity.

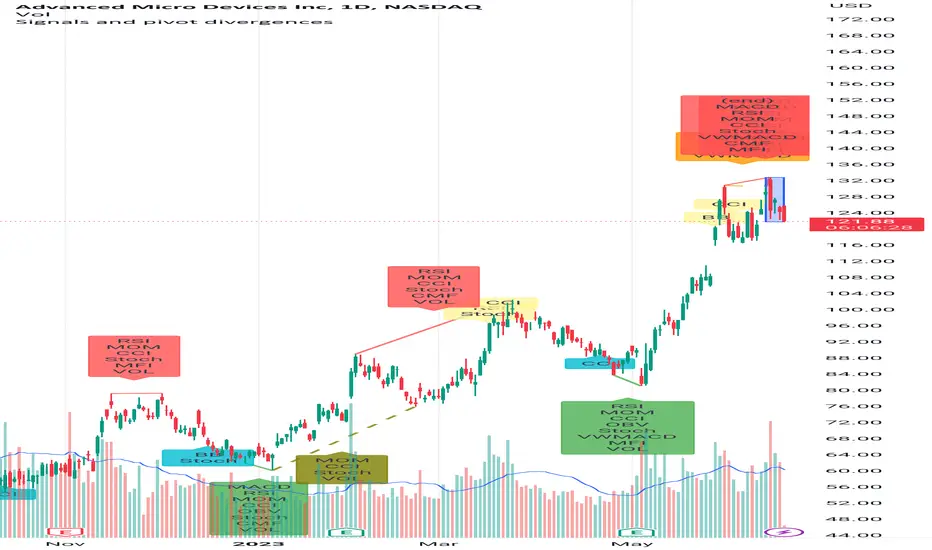
Signals and pivot divergencesScript that shows buy and sell signals for multiple indicators and divergences when there's a pivot in the price chart. The defaults are from my own laboration and don't hesitate to share your settings!
Best of trading luck!
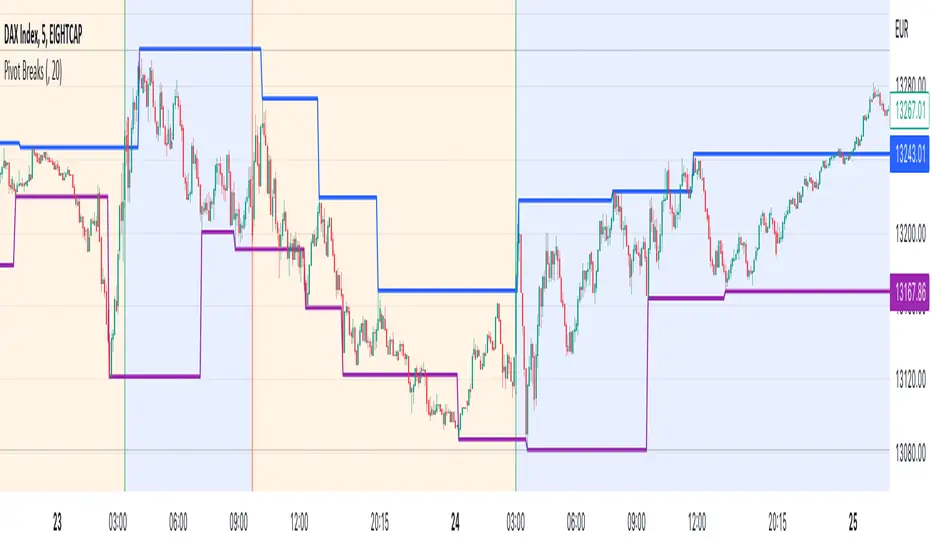
Pivot BreaksThere are built-in and published Pivot Point High Low indicators in Public Library. As far as I see none of them show the breaking candles or the trend.
with the closing price crossing over the previous / current pivot high A bearish breakOut can either indicate the progression of a lower high pattern or a trend reversal
with the closing price crossing under the previous / current pivot low A bullish breakOut can either indicate the progression of a higher low pattern or a trend reversal
This indicator can show the first breaking candle or all breaking candles . It Can also show The Breaking state (Trend) based on the last break.
Alert Mode is included, colour can be customised, Higher TimeFrame can be requested (it Can also cause repainting)
Inputs are optional as possible so have fun with it
Disclaimer: Scripts that I post publicly are experimental. They are not financial advices. Always backtest your ideas using your own methodologies.
Pivot Based Trailing Maxima & Minima [LuxAlgo]This indicator returns trailing maximums/minimums and the resulting average, each resetting on the occurrence of a pivot point high/low, thus allowing to highlight past and current support and resistance levels.
Note that the user has the option to make the indicator subject to backpainting or not. Backpainting would offset the indicator output to the past and as such would be less suited for real-time applications.
🔶 USAGE
🔹 Non Backpainting
The indicator can highlight points of support and resistance given by the trailing maximum/minimum average.
An uptrend is indicated when the trailing maximum is making a new higher high, while a downtrend is indicated when the trailing minimum makes a new lower low.
🔹 Backpainting
When backpainting is enabled the historical trailing maximum/minimum and their resulting average are offset to the past. However, we extend these to the most recent bar, allowing for real-time applications of the indicator.
Users can easily analyze past trends and determine their type by observing the trailing maximum/minimum behavior. For example, trailing maximums/minimums not making new higher high/lower low would indicate a ranging market.
The frequency of new higher high/lower low can also help determine how bullish/bearish a trend was.
🔶 SETTINGS
Length: Determines the pivot high/low lookback, with higher values allowing to detect longer-term tops and bottoms.
Backpaint: Determine if the indicator is subject to backpainting. Enabling this setting would offset the returned results in the past.

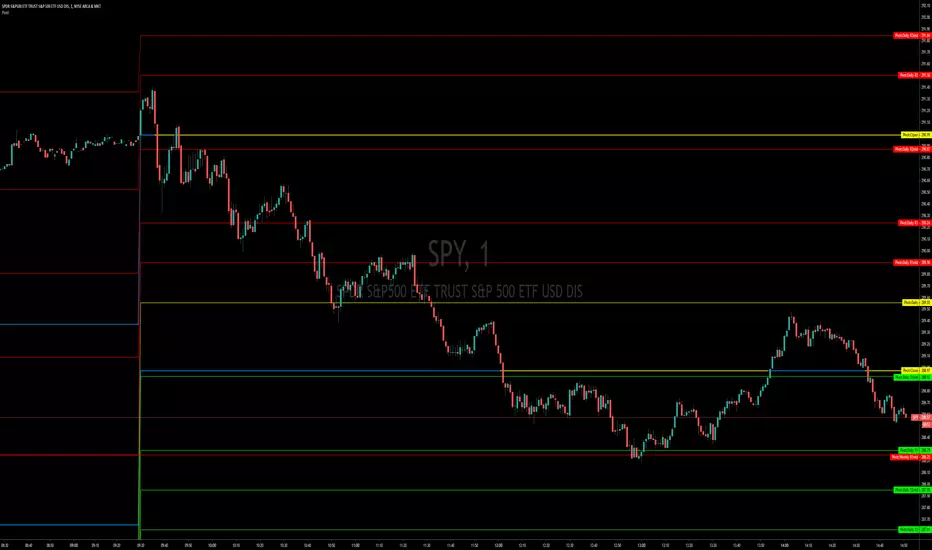
Daily, Weekly, Monthly Pivot Points StandardShow Higher timeframe Pivot Point along with 3 support/Resistance and mid line between them
Option to show the Monthly lines, with or without mid line, and can select the color
Option to show the Weekly lines, with or without mid line, and can select the color
Option to show the Daily lines, with or without mid line, and can select the color
Option to show a tables with the previous Open, High, Low, Close for these higher timeframe
NSDT Pivot ZonesThis is a new take on Traditional Pivot Points. By modifying the calculations, we were able to create "pivot zones" with a decent degree of accuracy.

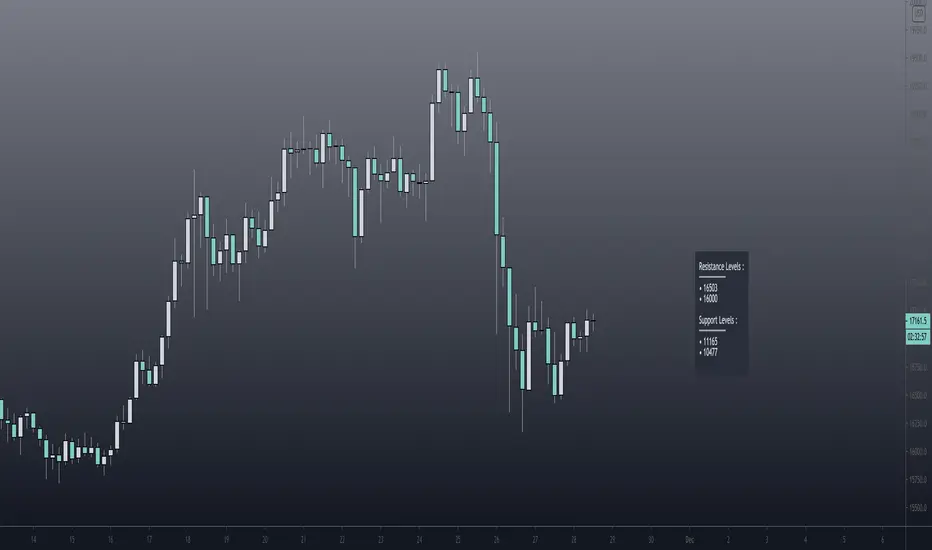
Pivot Support / Resistance Panel [JV]Hello Traders,
First all of thanks to LonesomeTheBlue for making me grasp arrays, a wonderful addition to Pine Script.
This indicator uses arrays to find Pivot Points and mark them as Support / Resistance.
It displays an info panel with the latest values.
This code was written using the following standards:
• PineCoders Coding Conventions for Pine: www.pinecoders.com
Configurable options:
Up to 6 Support / Resistance Levels.
Pivot Lookback Period.
Panel Color.
Text Color.
Panel Offset.
Panel Size.
Enjoy!
Daily Pivot Alarmdefault Pivot
green line is the pivot Point, orange the daily open price.
You can use plots for alarm.

Ultimate Pivot PointsLately, there are a plethora of Pivot scripts on TV, I'll be adding one more :3
This is a combination that I use for my personal use so I've coded accordingly. Its the best combination of the regular pivot, woodie pivot, fib, and cams, in my humble opinion. Also added previous day high and low as those are the key levels for intraday traders.
Also, this is a multi-timeframe version.
Enjoy~

DanielTools Pivot with momentum [ DN_PivotM ]This indicator shows pivot with momentum and signals which tell you when trend changed.
especially you could use pivot term like 1D(a day), 1W(a week), 720(12 hours), same with time period which trading view.
このインジケーターはピボットとモメンタムを描きます。またトレンドが変化した際にシグナルを描くこともできます。

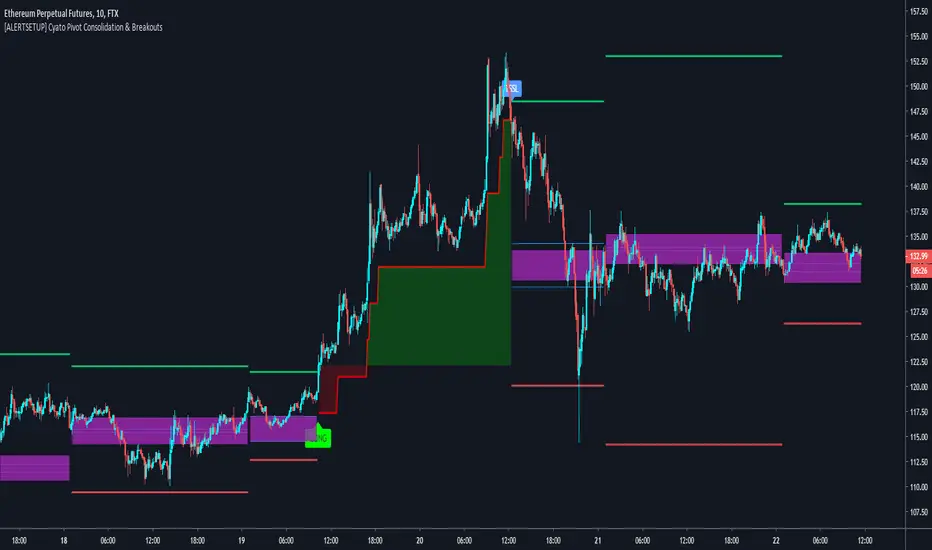
Cyatophilum Pivot Consolidation & Breakouts [ALERTSETUP]Intraday Strategy built on Pivot Points Standard and Pivot Range.
The idea is to wait for a consolidation period AND a breakout. This really strong condition allows to set a 1/1 Risk/Reward ratio.
Starting from there we secure the profits with a Trailing Stop loss and/or Take Profit system integrated in the script.
This is the Alert version and you can see the backtest results below. Default settings work great on the 15m chart.
You can change the timeframe of the pivot points as well as the consolidation band in the settings. The SL/TP system is also configurable. This script includes a DCA feature.
To get the indicator, please use the link below, thanks!
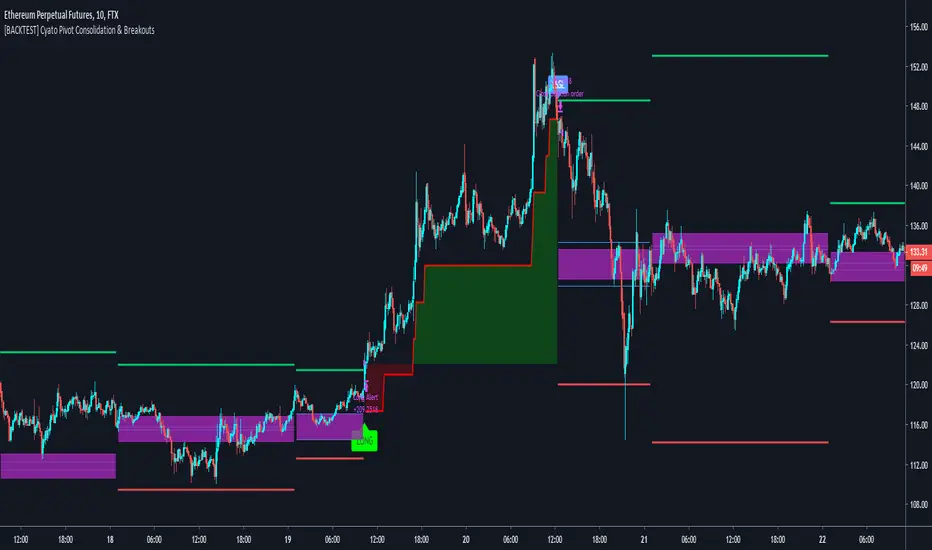
Cyatophilum Pivot Consolidation & Breakouts [BACKTEST]Intraday Strategy built on Pivot Points Standard and Pivot Range.
The idea is to wait for a consolidation period AND a breakout. This really strong condition allows to set a 1/1 Risk/Reward ratio.
Starting from there we secure the profits with a Trailing Stop loss and/or Take Profit system integrated in the script.
This is the Backtest version and you can see the results below. Default settings work great on the 15m chart.
You can change the timeframe of the pivot points as well as the consolidation band in the settings. The SL/TP system is also configurable. This script includes a DCA feature.
To get the indicator, please use the link below, thanks!