Pivot Percentile Trend - Strategy [presentTrading]
█ Introduction and How it is Different
The "Pivot Percentile Trend - Strategy" from PresentTrading represents a paradigm shift in technical trading strategies. What sets this strategy apart is its innovative use of pivot percentiles, a method that goes beyond traditional indicator-based analyses. Unlike standard strategies that might depend on single-dimensional signals, this approach takes a multi-layered view of market movements, blending percentile calculations with SuperTrend indicators for a more nuanced and dynamic market analysis.
This strategy stands out for its ability to process multiple data points across various timeframes and pivot lengths, thereby capturing a broader and more detailed picture of market trends. It's not just about following the price; it's about understanding its position in the context of recent historical highs and lows, offering a more profound insight into potential market movements.
BTC 6h L/S
Where traditional methods might react to market changes, the Pivot Percentile Trend strategy anticipates them, using a calculated approach to identify trend strengths and weaknesses. This foresight gives traders a significant advantage, allowing for more strategic decision-making and potentially increasing the chances of successful trades.
In essence, this strategy introduces a more comprehensive and proactive approach to trading, harnessing the power of advanced percentile calculations combined with the robustness of SuperTrend indicators. It's a strategy designed for traders who seek a deeper understanding of market dynamics and a more calculated approach to their trading decisions.
Local picture
█ Strategy, How It Works: Detailed Explanation
🔶 Percentile Calculations
- The strategy employs percentile calculations to assess the relative position of current market prices against historical data.
- For a set of lengths (e.g., `length * 1`, `length * 2`, up to `length * 7`), it calculates the 75th percentile for high values (`percentilesHigh`) and the 25th percentile for low values (`percentilesLow`).
- These percentiles provide a sense of where the current price stands compared to recent price ranges.
Length - 10
Length - 15
🔶 SuperTrend Indicator
- The SuperTrend indicator is a key component, providing trend direction signals.
- It uses the `currentTrendValue`, derived from the difference between bull and bear strengths calculated from the percentile data.
* used the Supertrend toolkit by @EliCobra
🔶 Trend Strength Counts
- The strategy calculates counts of bullish and bearish indicators based on comparisons between the current high and low against high and low percentiles.
- `countBull` and `countBear` track the number of times the current high is above the high percentiles and the current low is below the low percentiles, respectively.
- Weak bullish (`weakBullCount`) and bearish (`weakBearCount`) counts are also determined by how often the current lows and highs fall within the percentile range.
*The idea of this strength counts mainly comes from 'Trend Strength Over Time' @federalTacos5392b
🔶 Trend Value Calculation
- The `currentTrendValue` is a crucial metric, computed as `bullStrength - bearStrength`.
- It indicates the market's trend direction, where a positive value suggests a bullish trend and a negative value indicates a bearish trend.
🔶 Trade Entry and Exit Logic
- The entry points for trades are determined by the combination of the trend value and the direction indicated by the SuperTrend indicator.
- For a long entry (`shouldEnterLong`), the `currentTrendValue` must be positive and the SuperTrend indicator should show a downtrend.
- Conversely, for a short entry (`shouldEnterShort`), the `currentTrendValue` should be negative with the SuperTrend indicating an uptrend.
- The strategy closes positions when these conditions reverse.
█ Trade Direction
The strategy is versatile, allowing traders to choose their preferred trading direction: long, short, or both. This flexibility enables traders to tailor their strategies to their market outlook and risk appetite.
█ Default Settings and Customization
1. Trade Direction: Selectable as Long, Short, or Both, affecting the type of trades executed.
2. Indicator Source: Pivot Percentile Calculations, key for identifying market trends and reversals.
3. Lengths for Percentile Calculation: Various configurable lengths, influencing the scope of trend analysis.
4. SuperTrend Settings: ATR Length 20, Multiplier 18, affecting indicator sensitivity and trend detection.
5. Style Options: Custom colors for bullish (green) and bearish (red) trends, aiding visual interpretation.
6. Additional Settings: Includes contrarian signals and UI enhancements, offering strategic and visual flexibility.
ابحث في النصوص البرمجية عن "pivot"

Pivot-Based Channels & Bands [Misu]█ This Indicator is based on Pivot detection to show bands and channels.
The pivot price is similar to a resistance or support level. If the pivot level is breached, the price should continue in that direction. Or the price could reverse at or near this level.
█ Usages:
Use channels as a support & resistance zone.
Use bands as a support & resistance zone. It is also very powerfull to use it as a breakout.
Use mid bands & mid channels as a trend direction or trade filter as a more usual moving average.
█ Parameters:
Show Pivot Bands: show bands.
Show Pivot Mid Band: show mid bands.
Show Pivot Channels: show channels.
Show Pivot Mid Channel: show mid channels.
Deviation: deviation used to calculate pivot points.
Depth: depth used to calculate pivot points.

Pivot Trend LevelsYou can use this indicator to detect the levels and trend.
I used the highest of the two last highest pivots and the lowest of the two last lowest pivots to calculate "max" and "min" or high level or low level.
I also calculate the average of the 4 values to reach the average line which could be a trend detector in higher lengths.
Default length is 3 but using 10 or 20 as length is really good as trending detector.
I need help to upgrade a trend detector system. please read the script for more information.
Thank you so much.

Pivot ProbabilitiesThis indicator gives traders historical probabilities based on how often price closed between any two pivot points.
What are the features? (as of release)
Get the historical statistics of how often price closed between any two pivot points.
Manually set your own pivot point resolution to any higher timeframe. So get the historical statistics from any pivot point you'd like.
Why would someone use this?
Reversion: We can more clearly see between which pivots price has highest probability of mean reversion towards.
Risk Management: By adding the statistics between groups of pivots, we can have a better idea of what the normal trading range for pivot points on any given asset should be. Making it easier to identify which pivot points are more likely to have extreme price movements go past.
Could you add an option to show probabilities for "x" style of pivot points?
I plan on adding more types of pivot points in the future. Check out if there are any updates to this indicator that include the pivots you're looking for. Otherwise, tell me what you're looking for in the comments here.
Why don't I see any pivot points on my chart when I apply this indicator?
This indicator does not draw pivot points on your chart. It strictly draws probabilities. So feel free to use it in combination with your favorite one.

Pivots (CPR) - Daily, Weekly & Monthly (only for Indraday) Hi all Dear users,
Here, I have shared my CPR script on Daily, Weekly & Monthly basis. which will only works on intraday time frames. Best time frames recommended are 3,5 &15.
This will be very useful for intraday trades. And also it has more customizing options.
The features are:-
================
- Have an option to use only Daily pivots.
- Have an option to check tomorrow pivot ( After day closing).
- You can customize each and every style and colors.
- It also contains Previous day High, Previous Week High & Previous Month High.
- You can Show or Hide daily weekly Monthly and highs too.
Please share this AMAZING INDICATORS others.

Pivot Hilo Support n Resistance Levels R3-3 by JustUncleLThis is an update to the "Pivot HiLo Support n Resistance Levels" indicator, important updates are no re-painting; and different lengths available for each side of Pivot.
Description:
The Pivot Points are marked with "star" and with Optional Support and Resistance extension Levels shown.
Options:
Show Pivot Points (default true)
Pivot Length Left Side (default 7), the number of bars left hand side of the Pivot candle.
Pivot Length Right Side (default 3), the number of bars right hand side of the Pivot candle.
Show S/R Extension Levels (default true)
Maximum S/R Extension Length (default 0, no limit)
Show Pivot Labels (instead of "star") " " and " "
Revisions this release:
Added code to force Pivot to be always complete before drawing.
Added option for different length test for each side of Pivot.
Pivot Point TrendOverview
A trend-following trailing line built from confirmed pivot highs/lows and ATR bands. The line turns green in uptrends and red in downtrends. A flip happens only when price closes on the other side of the opposite trail, helping filter noise.
How it works:
Finds confirmed swing points (pivots) and builds a smoothed center from them.
From that center, creates ATR-based bands.
The active trail “locks” in the trend: in uptrends it never moves down; in downtrends it never moves up.
Close above the prior upper trail → bullish; close below the prior lower trail → bearish.
Inputs
Pivot Point Period (prd) – strictness of pivot confirmation (delay = prd bars).
ATR Period (pd) and ATR Factor (factor) – band width; higher values = fewer flips.
Calculation timeframe (calcTF) – leave empty to use chart TF, or set a hard TF like 1D, 4H.
Show Center Line – optional central guide.
Line Width – trail thickness.
Alerts
Bullish Flip – trend turns bullish.
Bearish Flip – trend turns bearish.
Trend Changed – any flip event.
Usage tips
Typical crypto intraday starters: prd 2–5, pd 10–14, factor 2.5–3.5.
For smoother signals, compute on a higher TF (e.g., calcTF = 1D) and time entries on your lower TF.
Prefer actions on bar close of the calculation TF to avoid intrabar whipsaw.
Notes on repainting
The script uses request.security(..., lookahead_off). Pivots confirm after prd bars by design; once confirmed, the center and trails do not use future data. Evaluate flips on bar close for consistency, especially when calcTF > chart TF.
Disclaimer
Educational use only. Not financial advice. Trading involves risk.

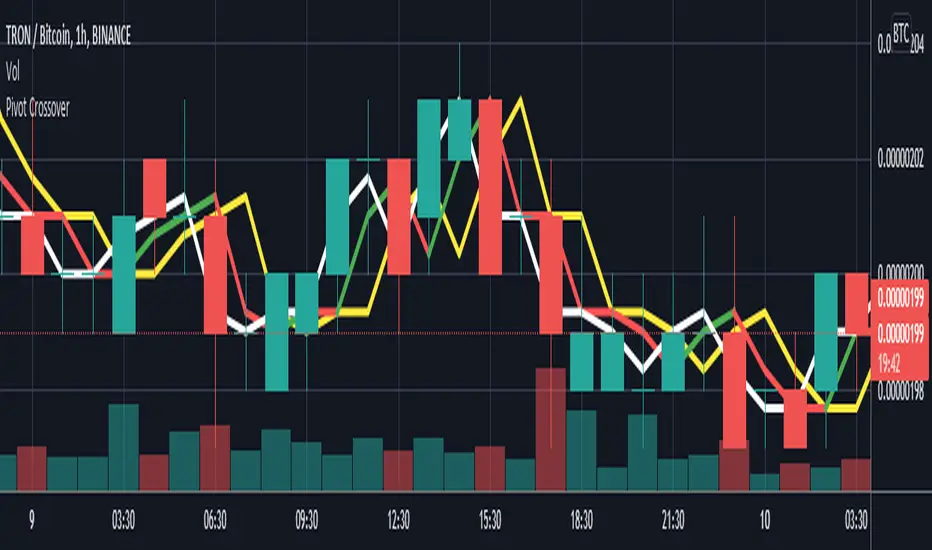
Pivot CrossoverThis indicator work on pivot point crossover. In this indicator use three pivot point
White color line is Pivot point for current bar.
Green/Red color line is Pivot point for last bar.
Yellow color line is Pivot point for 2nd last bar.
For long
if last pivot crossover above 2nd last pivot then go long
if current pivot crossover below last pivot then exit long
For short
if last pivot crossover below 2nd last pivot then go short
if last pivot crossover above last pivot then exit short
Pivot boxes [LM]Hello traders,
let me intoduce you pivot boxes. New features of pinescript that allows to render boxes enabled to highlight pivot zone. Range high or low is defined by pivot high or low and rangeLow and RangeHigh are defined by close of following candle.
It has two settings that you can change at your will, it also enables hide/show particular pivot setting
Hope you will enjoy as I enjoyed to write it.
Lukas

Pivot Points & Midlines with color selectorAdapted from Pinescript Manual's "Pivot Points Standard". Added extra levels and midlines as well as user inputs for color and a "show labels" on/off switch.
So this will show the Pivot level, the resulting levels R1,R2,R3,S1,S2,S3 and the midpoint lines between these.
User can choose the Higher timeframe period from which to calculate these pivot levels, as per the original script.
I like to add two of these to a chart, one for daily and one for weekly pivot levels.
If you don't need any particular level, just comment out the appropriate lines (one from each of the second last and third last blocks in the script).

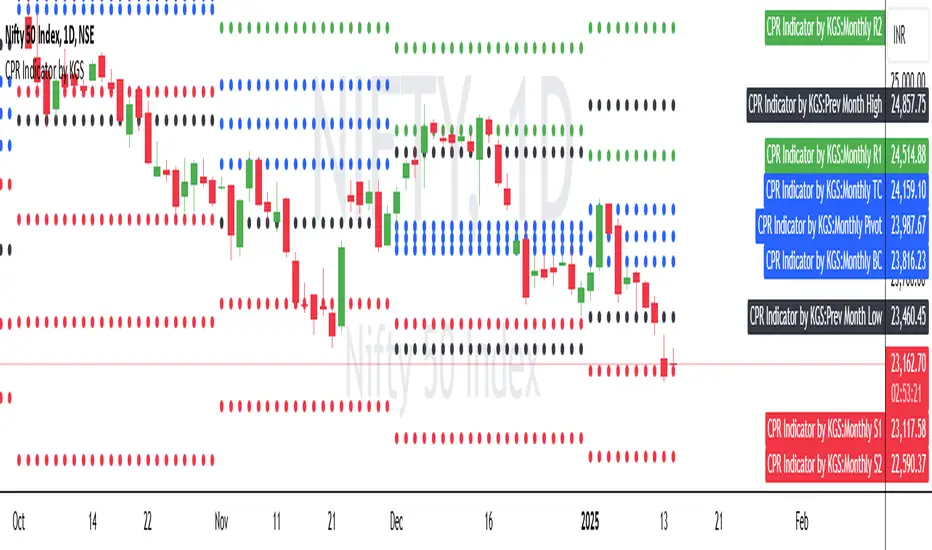
Pivot Points CPR with M,W,D High/lowThis script is based on Secret of Pivot Boss book by Frank Ochoa. Suitable for Intraday Trading.
You can view Daily timeframe cpr/support/resistance.
You can view Weekly timeframe cpr/support/resistance.
You can view Monthly timeframe cpr/support/resistance.
You can also view Previous Day High/Low.
You can also view Previous Week High/Low.
You can also view Previous Month High/Low.
You can also turn on/off as per your wish.
Pivot + Stochastic Filter Signals (Balanced)Pivot + Stochastic Filter Signals (Balanced)
This indicator combines Pivot Highs/Lows with the Stochastic Oscillator to generate accurate BUY and SELL signals.
A BUY signal appears when a Pivot Low forms and the Stochastic %K crosses above %D (optionally filtered by oversold conditions).
A SELL signal appears when a Pivot High forms and the Stochastic %K crosses below %D (optionally filtered by overbought conditions).
Key Features:
Clear BUY (green) and SELL (red) signals plotted directly on the chart.
Optional filter: only trigger signals in overbought/oversold zones.
Labels display pivot value with the corresponding signal.
Stochastic oscillator plotted for confirmation.
This tool is useful for traders who want to combine price action (pivots) with momentum confirmation (Stochastic crossovers) for higher accuracy in trend reversals and entry timing.

Pivot Bollinger BandThis is a special kind of Bollinger Bands indicator that adapts to the market's pivot points. Instead of using regular price data, it first finds important swing highs and lows in the market (called pivot points). It then uses these pivot points to create a center line, which is like a moving average of where the market is pivoting.
Around this center line, it draws the classic Bollinger Bands - an upper and lower band that show where prices might find resistance or support. The distance between these bands changes based on market volatility, just like regular Bollinger Bands. You can adjust how sensitive it is to pivot points and how wide the bands should be.
By using pivot point based Bollinger Bands, we expect band breakout can be captured more effectively.

Pivots Benchmark For Indicators (MA / OSC) This measures the pivot of your source. the peaks and valleys. and, shows ou some neat statistics if you were to use those as your entry/exit points. I consider it a purist MA designers Acid Test. if you can get good numbers on this, (remember to deduct fees), you probably should feel confident in your indicator's quality. it isn't very forgiving.
170 themes Dark/Light
your choice of highlight colour for Best/Worst achievement values.
compare to open/close average, or a 3 length EMA on close.
display solo bench of your source.
help popup for indicator values, (hideable)
show/hide individual pivot distances, which source to measure as pivot
time to measure historical setting
number of pivots to keep in buffer
it does back test and runs live!
Closed Source for now, as it is a demo version i've made with partial capabilities.
it's part of a set of performance benchmarks i hope to have finished soon.
when i release the major components i've been building up to for 2 years,
this and everything else will be open sourced.

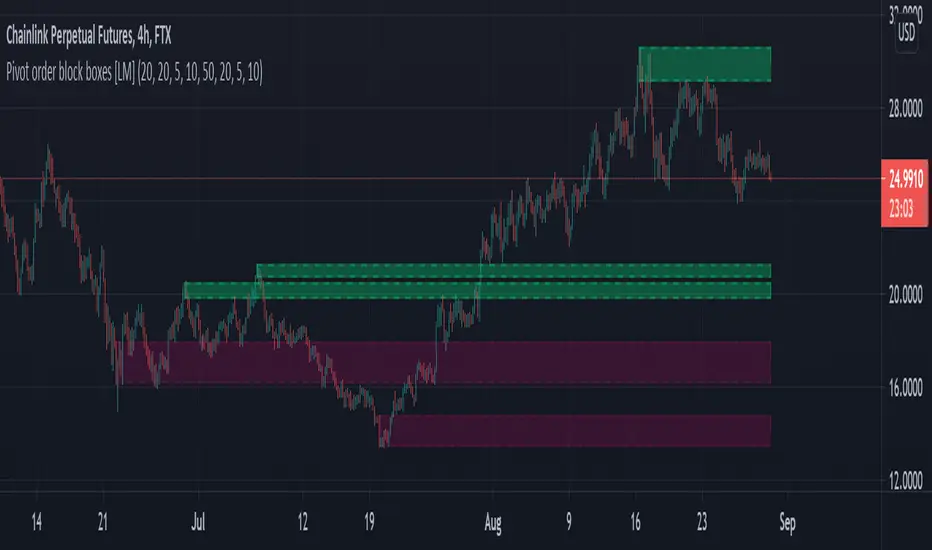
Pivot order block boxes [LM]Hello traders,
let me intoduce you pivot order block boxes. The idea is find the pivot point that within the right side count of candles achieved some percentage change and in that way filter out important pivots. Once the pivot point is found and matches the volatility condition then from the left side of pivot first candle that is up candle for pivot high and down candle for pivot low, could be also the pivot candle itself is selected and rendered high and low of that candle. The premise behind is that those are the levels profesional traders are buying.
It has two settings that you can change at your will, it also enables hide/show particular pivot setting
Hope you will enjoy as I enjoyed to write it.
Lukas
Pivot Points (with Mid-Pivots)Brief Description
Pivot points are horizontal support and resistance lines placed on a price chart. They make strong levels of support and resistance because banks, financial institutions and many traders use them.
The indicator is set to the Daily Pivot Range by default (no support for weekly, monthly, quarterly, or yearly Pivots).
Indicator Settings
Show Mid-Pivots?
Show R3 and S3 levels?
Pivot JunkieThis new pivot detector indicator does an amazing job at helping you play the breaks of floors and ceilings.
Can be used by both standard and margin traders for great results.
Built in alerts so this will also work for those automating their trades via AutoView or Gunbot etc
Customize the indicator so it runs exactly how you want it to with a solid list of options
-------------------------------------
Pivot Lookback
Max Length
Show High Pivots?
Show Low Pivots?
Bullish : Alert Only If Broken Above By x%
Bearish : Alert Only If Broken Below By x%
Wait x Bars Before Showing Another Bullish Break
Wait X Bars Before Showing Another Bearish Break
Show Bullish Breaks Of High?
Min Bars After Break For Signal To Trigger
Max Bars After Break For Signal To Trigger
Show Bearish Breaks Of Low?
Min Bars After Break For Signal To Trigger
Max Bars After Break For Signal To Trigger
Show Bullish Breaks Of Low?
Min Bars After Break For Signal To Trigger
Max Bars After Break For Signal To Trigger
Show Bearish Breaks Of High?
Min Bars After Break For Signal To Trigger
Max Bars After Break For Signal To Trigger
-------------------------------------
Just message if you have any questions!

Pivoted EMAThis strategy checks if we have a low pivot above the EMA (48) line. If so it enters a long trade with a stop loss set to EMA - an additional gap.
This is reversed for Short trades: high pivot bellow the EMA, and SL set to EMA + gap.
The EMA gap for SL can be set individually for Short and Long positions. Backtests reveal that short positions need higher EMA SL gap that long positions.
The red lines above/bellow the candles during open trades are SL prices. The lines are invisible and the prices are gray in the list above the chart when not in active Trade. If the SL line is set equal to the EMA price the line appears as purple because they are both semi transparent. (this is the case for long trades in the current settings used in displaying this strategy).

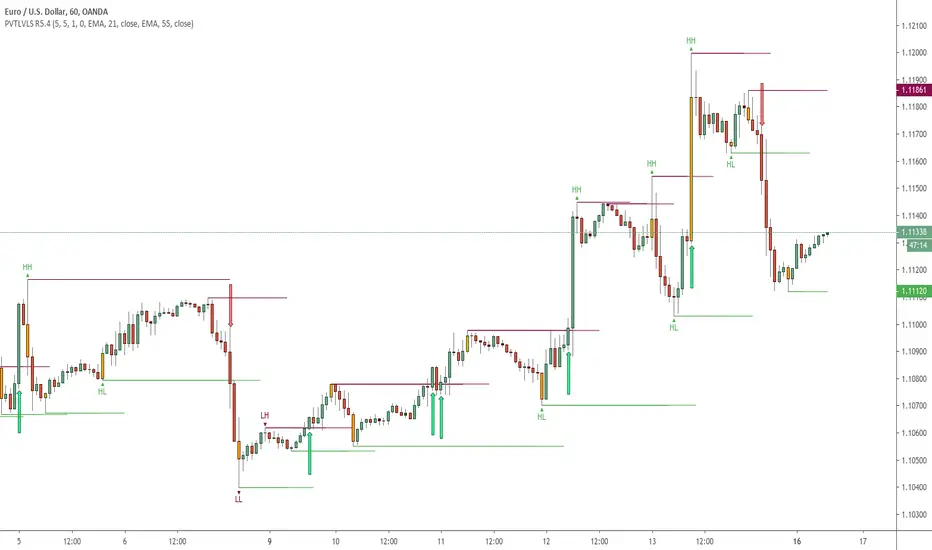
Pivot Levels with EMA Trend📌 Trend Change Levels with EMA Trend
✨ Description:
This TradingView script identifies clean trend change levels based on 1-hour structure shifts and filters them to keep only those not invalidated. It follows the "Jake Ricci" method, each level is printed at the beginning of the candle that changes the trend, on a 1 hour chart. For precision, make sure to exclude after/pre market and only use the levels on regular hours charts.
It includes dynamic EMAs (9, 50, 200), intraday VWAP, the daily open level printed, and a visual trend label based on EMA(9) slope.
Designed for intermediate traders, it helps build bias, manage entries, and avoid false setups by focusing on clean, reactive levels that the market respects.
🔧 Core Logic:
On the 1H chart, the script compares current and previous closes to detect trend direction. If the trend flips (e.g., up to down), the open of the candle that caused the flip becomes a candidate level.
Only levels that remain untouched by future candle closes are plotted — this filters out “weak” levels that price already violated (which means, a candle closes after passing through the level).
These levels become key S/R zones and often act as reaction points during pullbacks, traps, and liquidity sweeps.
The idea is to check how the price reacts to those levels. Usually there's a clean retest of the level. After that, if the price continues in that direction, it tends to reach the following level.
🔹 Included Tools:
🟣 Trend Change Levels (1H):
Fixed horizontal lines based on confirmed shifts in trend, shown only when not broken.
📉 EMAs (9 / 50 / 200):
Visibility can be set per timeframe. Use for trend context.
📍 EMA Trend Label:
Shows \"UP\", \"DOWN\", or \"RANGE\" based on EMA(9) slope.
🔵 VWAP (Intraday Reset):
Real-time volume-weighted average price that resets daily. Useful for fair value zones and reversion plays.
🟠 Daily Open Line:
Plot of the current day’s open. Used for intraday directional bias. Usually: DO NOT take longs below the Open Print, DO NOT take shorts above it.
📊 ATR Table:
Displays current ATR multiplier on the chart. It's useful to understand if the market is expanding or not.
📈 How to Use It (Strategy):
1. Start on the 1H chart to generate levels.
Only the open of candles that reversed trend are considered — and only if future candles didn’t close through them. I suggest manually adding horizontal lines to mark again the levels, so that they stick to all the timeframes.
2. Use the trend label to decide your bias — \"UP\" for long setups, \"DOWN\" for shorts. Avoid trading against the slope.
3. Switch to the 5m chart and wait for price to approach a plotted level. These are often used for manipulation, retests, or clean reversals.
4. Look for confirmation: rejection candles, break-and-retest, strong engulfing candles, or traps above/below the level. ALWAYS check the price action around the level, along with the volume.
5. Check if VWAP or an EMA is near the level. If yes, the confluence strengthens the trade idea.
6. Use the ATR value to understand if the market is expanding (candles are bigger than the ATR). You don't want to stay in a slow and ranging trade.
✅ Example Entry Flow:
1. On the 1H chart, note a trend change level printed recently.
2. Check the current trend label — if it says \"UP,\" prefer longs.
3. Wait for price to retrace toward the level.
4. On the 5m, look for a bullish engulfing candle or trap setup at the level.
5. Check if VWAP and EMA(50) are near. If yes, execute the trade.
6. Set stop just under the low of the candle prior to your entry. Ideally, a retracing candle.
To be clear: imaging to be LONG, you wait for a retracement that should touch your level. You wait for a candle that resumes the LONG trend, enter when it breaks the high of the previous candle (sill in retracement), you place your stop under the candle prior to your entry.
Notes:
No repainting — levels only show up after confirmed shifts.
Removes broken levels for chart clarity and reliability.
Helps spot high-probability pullback zones and fakeouts.
Perfect confluence tool to support price action, SMC, or EMA strategies.
Works across multiple timeframes with customizable inputs.
👤 Ideal For:
Intraday traders looking for reactive entry points and direction confirmation.
Swing traders wanting to pinpoint continuation zones or reversal pivots.
🚨 Final Note: This indicator doesn’t generate buy/sell signals. It improves your trade filtering by identifying areas the market already respected and reacting to them with price action. Combine it with your own system , test it in replay, and use screenshots to document setups.
📌 If used with discipline, this becomes a precision tool — not a signal generator.

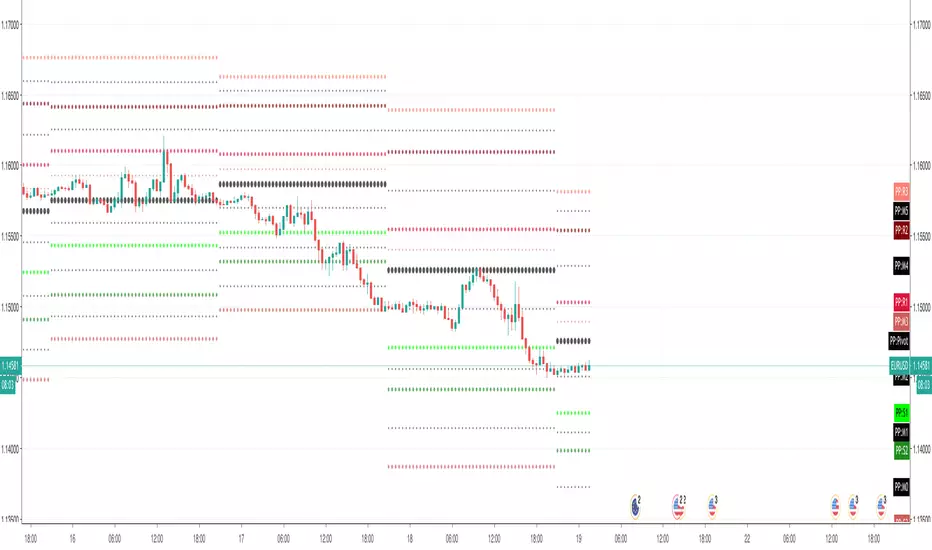
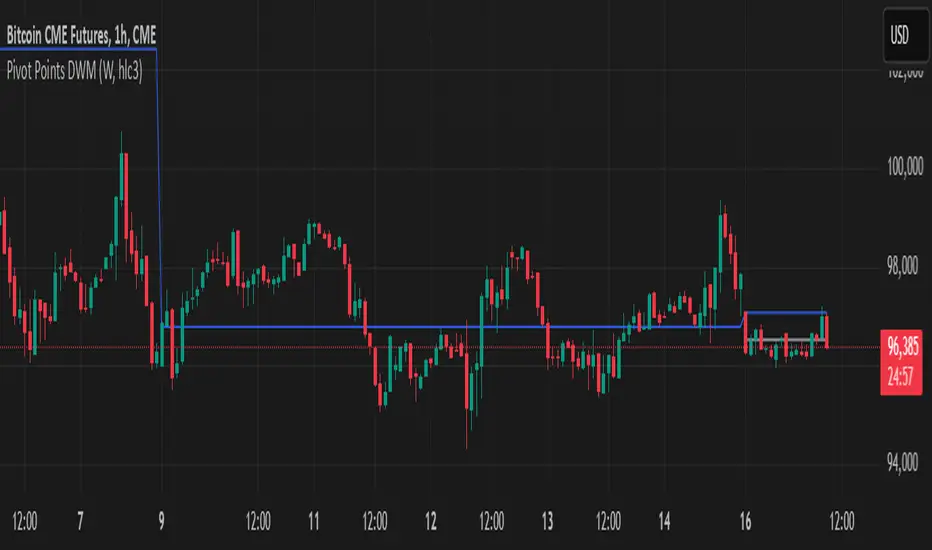
Pivot Points DWMWhat Is a Pivot Point?
A pivot point is a price level calculated from previous prices. It's used to indicate potential areas of support or resistance that offer attractive reward-to-risk setups for trades. The pivot point itself is simply the average of the intraday high and low and the closing price from the previous trading day. Trading above the pivot point on the subsequent day is thought to indicate ongoing bullish sentiment. Trading below the pivot point indicates bearish sentiment.
Non-Repainting
Pivot Point SuperTrend Strategy +TrendFilterIn the dynamic world of financial markets, traders are always on the lookout for innovative strategies to identify trends and make timely trades. The "Pivot Point SuperTrend strategy +TrendFilter" has emerged as an intriguing approach, combining two popular indicators - Pivot Points and SuperTrend, while introducing an additional trend filter for added precision. This strategy draws inspiration from Lonesome TheBlue's "Pivot Point SuperTrend" script, aiming to provide traders with a reliable tool for trend following while minimizing false signals.
The Core Concept:
The strategy's foundation lies in the fusion of Pivot Points and SuperTrend indicators, and the addition of a robust trend filter. It begins by calculating Pivot Highs and Lows over a specified period, serving as crucial reference points for trend analysis. Through a weighted average calculation, these Pivot Points create a center line, refining the overall indicator.
Next, based on the center line and the Average True Range (ATR) with a user-defined Factor, upper and lower bands are generated. These bands adapt to market volatility, adding flexibility to the strategy. The heart of the "Pivot Point SuperTrend" strategy lies in accurately identifying the prevailing trend, with the indicator smoothly transitioning between bullish and bearish signals as the price interacts with the SuperTrend bands.
The additional trend filter introduced into the strategy further enhances its capabilities. This filter is based on a moving average, providing a dynamic assessment of the trend's strength and direction. By combining this trend filter with the original Pivot Point SuperTrend signals, the strategy aims to make more informed and reliable trading decisions.
Advantages of "Pivot Point SuperTrend" with Trend Filter:
1. Enhanced Precision: The incorporation of a trend filter improves the strategy's accuracy by confirming the overall trend direction before generating signals.
2. Trend Continuation: The integration of Pivot Points and SuperTrend, along with the trend filter, aims to prolong trades during strong market trends, potentially maximizing profit opportunities.
3. Reduced Whipsaws: The strategy's weighted average calculation, coupled with the trend filter, helps minimize false signals and reduces whipsaws during uncertain or sideways market conditions.
4. Support and Resistance Insights: The strategy continues to provide additional support and resistance levels based on the Pivot Points, offering valuable contextual information to traders.

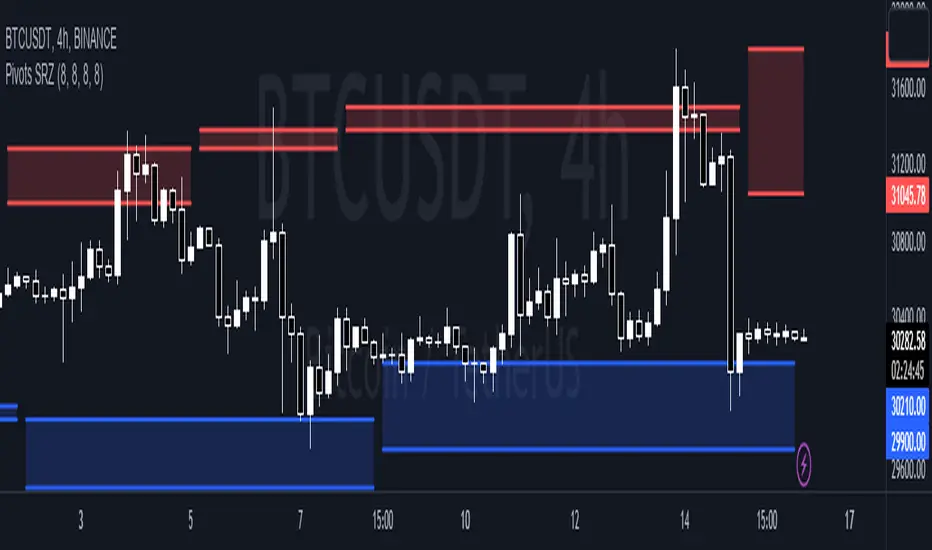
Pivots Support Resistance ZoneThis simple script base on function of Pivot High Low to plot Support and Resistance Zone on chart with detail as below:
1. Support Zone
+ New Pivot Low is plotted
+ New Pivot Low lower previous Pivot Low
+ Upper Line of Support Zone is previous Pivot Low
+ Lower Line of Support Zone is new Pivot Low
2. Resistance Zone
+ New Pivot High is plotted
+ New Pivot High higher previous Pivot High
+ Upper Line of Resistance Zone is new Pivot High
+ Lower Line of Resistance Zone is previous Pivot High
Pivot Breaches by nnamdertWhat does this Indicator do?
This Pivot Point Line Breach Indicator is a simple yet powerful tool that automatically plots lines at the high and low pivot point levels and extends the lines forward to the most recent real-time bar. When the price breaches a line, the line stops at that breach point. The unbreached lines, however, continue on until they are eventually breached or the indictor reaches the maximum number of lines set by the user.
How is this Indicator helpful?
The pivot point lines plotted on the chart show areas where the price may eventually revert to. By knowing whether or not these lines have been breached, traders can easily identify potential entry points or support lines that are likely to be breached, especially when used with other indicators.
As shown in the screenshot below, some lines have been breached, while several others remain. Once the lines were breached, we could clearly see that the price moved quickly to the next level.
The indicator user inputs enable the plotting of up to 500 lines on the chart, if the user chooses to set the limit to 500. However, the default setting is currently set to a lower number, allowing traders to easily view the most recent unbreached pivot points.
The plotted lines are located at the close and high or low of the bar that generated the line. When there is a long wick, the two lines are plotted far from each other. A breach of both lines, particularly in the case of a long wick, indicates strong movement in the direction of the breach.
Thank you for using my indicator, and I hope it helps you make profitable trading decisions.
