ابحث في النصوص البرمجية عن "pivot"


PivotsLibrary "Pivots"
This Library focuses in functions related to pivot highs and lows and some of their applications (i.e. divergences, zigzag, harmonics, support and resistance...)
pivots(srcH, srcL, length) Delivers series of pivot highs, lows and zigzag.
Parameters:
srcH : Source series to look for pivot highs. Stricter applications might source from 'close' prices. Oscillators are also another possible source to look for pivot highs and lows. By default 'high'
srcL : Source series to look for pivot lows. By default 'low'
length : This value represents the minimum number of candles between pivots. The lower the number, the more detailed the pivot profile. The higher the number, the more relevant the pivots. By default 10
Returns:
zigzagArray(pivotHigh, pivotLow) Delivers a Zigzag series based on alternating pivots. Ocasionally this line could paint a few consecutive lows or highs without alternating. That happens because it's finding a few consecutive Higher Highs or Lower Lows. If to use lines entities instead of series, that could be easily avoided. But in this one, I'm more interested outputting series rather than painting/deleting line entities.
Parameters:
pivotHigh : Pivot high series
pivotLow : Pivot low series
Returns:
zigzagLine(srcH, srcL, colorLine, widthLine) Delivers a Zigzag based on line entities.
Parameters:
srcH : Source series to look for pivot highs. Stricter applications might source from 'close' prices. Oscillators are also another possible source to look for pivot highs and lows. By default 'high'
srcL : Source series to look for pivot lows. By default 'low'
colorLine : Color of the Zigzag Line. By default Fuchsia
widthLine : Width of the Zigzag Line. By default 4
Returns: Zigzag printed on screen
divergence(h2, l2, h1, l1, length) Calculates divergences between 2 series
Parameters:
h2 : Series in which to locate divs: Highs
l2 : Series in which to locate divs: Lows
h1 : Series in which to locate pivots: Highs. By default high
l1 : Series in which to locate pivots: Lows. By default low
length : Length used to calculate Pivots: By default 10
Returns:

Range Trading StrategyOVERVIEW
The Range Trading Strategy is a systematic trading approach that identifies price ranges
from higher timeframe candles or trading sessions, tracks pivot points, and generates
trading signals when range extremes are mitigated and confirmed by pivot levels.
CORE CONCEPT
The strategy is based on the principle that when a candle (or session) closes within the
range of the previous candle (or session), that previous candle becomes a "range" with
identifiable high and low extremes. When price breaks through these extremes, it creates
trading opportunities that are confirmed by pivot levels.
RANGE DETECTION MODES
1. HTF (Higher Timeframe) Mode:
Automatically selects a higher timeframe based on the current chart timeframe
Uses request.security() to fetch HTF candle data
Range is created when an HTF candle closes within the previous HTF candle's range
The previous HTF candle's high and low become the range extremes
2. Sessions Mode:
- Divides the trading day into 4 sessions (UTC):
* Session 1: 00:00 - 06:00 (6 hours)
* Session 2: 06:00 - 12:00 (6 hours)
* Session 3: 12:00 - 20:00 (8 hours)
* Session 4: 20:00 - 00:00 (4 hours, spans midnight)
- Tracks high, low, and close for each session
- Range is created when a session closes within the previous session's range
- The previous session's high and low become the range extremes
PIVOT DETECTION
Pivots are detected based on candle color changes (bullish/bearish transitions):
1. Pivot Low:
Created when a bullish candle appears after a bearish candle
Pivot low = minimum of the current candle's low and previous candle's low
The pivot bar is the actual bar where the low was formed (current or previous bar)
2. Pivot High:
Created when a bearish candle appears after a bullish candle
Pivot high = maximum of the current candle's high and previous candle's high
The pivot bar is the actual bar where the high was formed (current or previous bar)
IMPORTANT: There is always only ONE active pivot high and ONE active pivot low at any
given time. When a new pivot is created, it replaces the previous one.
RANGE CREATION
A range is created when:
(HTF Mode) An HTF candle closes within the previous HTF candle's range AND a new HTF
candle has just started
(Sessions Mode) A session closes within the previous session's range AND a new session
has just started
Or Range Can Be Created when the Extreme of Another Range Gets Mitigated and We Have a Pivot low Just Above the Range Low or Pivot High just Below the Range High
Range Properties:
rangeHigh: The high extreme of the range
rangeLow: The low extreme of the range
highStartTime: The timestamp when the range high was actually formed (found by looping
backwards through bars)
lowStartTime: The timestamp when the range low was actually formed (found by looping
backwards through bars)
highMitigated / lowMitigated: Flags tracking whether each extreme has been broken
isSpecial: Flag indicating if this is a "special range" (see Special Ranges section)
RANGE MITIGATION
A range extreme is considered "mitigated" when price interacts with it:
High is mitigated when: high >= rangeHigh (any interaction at or above the level)
Low is mitigated when: low <= rangeLow (any interaction at or below the level)
Mitigation can happen:
At the moment of range creation (if price is already beyond the extreme)
At any point after range creation when price touches the extreme
SIGNAL GENERATION
1. Pending Signals:
When a range extreme is mitigated, a pending signal is created:
a) BEARISH Pending Signal:
- Triggered when: rangeHigh is mitigated
- Confirmation Level: Current pivotLow
- Signal is confirmed when: close < pivotLow
- Stop Loss: Current pivotHigh (at time of confirmation)
- Entry: Short position
Signal Confirmation
b) BULLISH Pending Signal:
- Triggered when: rangeLow is mitigated
- Confirmation Level: Current pivotHigh
- Signal is confirmed when: close > pivotHigh
- Stop Loss: Current pivotLow (at time of confirmation)
- Entry: Long position
IMPORTANT: There is only ever ONE pending bearish signal and ONE pending bullish signal
at any given time. When a new pending signal is created, it replaces the previous one
of the same type.
2. Signal Confirmation:
- Bearish: Confirmed when price closes below the pivot low (confirmation level)
- Bullish: Confirmed when price closes above the pivot high (confirmation level)
- Upon confirmation, a trade is entered immediately
- The confirmation line is drawn from the pivot bar to the confirmation bar
TRADE EXECUTION
When a signal is confirmed:
1. Position Management:
- Any existing position in the opposite direction is closed first
- Then the new position is entered
2. Stop Loss:
- Bearish (Short): Stop at pivotHigh
- Bullish (Long): Stop at pivotLow
3. Take Profit:
- Calculated using Risk:Reward Ratio (default 2:1)
- Risk = Distance from entry to stop loss
- Target = Entry ± (Risk × R:R Ratio)
- Can be disabled with "Stop Loss Only" toggle
4. Trade Comments:
- "Range Bear" for short trades
- "Range Bull" for long trades
SPECIAL RANGES
Special ranges are created when:
- A range high is mitigated AND the current pivotHigh is below the range high
- A range low is mitigated AND the current pivotLow is above the range low
In these cases:
- The pivot value is stored in an array (storedPivotHighs or storedPivotLows)
- A "special range" is created with only ONE extreme:
* If pivotHigh < rangeHigh: Creates a range with rangeHigh = pivotLow, rangeLow = na
* If pivotLow > rangeLow: Creates a range with rangeLow = pivotHigh, rangeHigh = na
- Special ranges can generate signals just like normal ranges
- If a special range is mitigated on the creation bar or the next bar, it is removed
entirely without generating signals (prevents false signals)
Special Ranges
REVERSE ON STOP LOSS
When enabled, if a stop loss is hit, the strategy automatically opens a trade in the
opposite direction:
1. Long Stop Loss Hit:
- Detects when: position_size > 0 AND position_size <= 0 AND low <= longStopLoss
- Action: Opens a SHORT position
- Stop Loss: Current pivotHigh
- Trade Comment: "Reverse on Stop"
2. Short Stop Loss Hit:
- Detects when: position_size < 0 AND position_size >= 0 AND high >= shortStopLoss
- Action: Opens a LONG position
- Stop Loss: Current pivotLow
- Trade Comment: "Reverse on Stop"
The reverse trade uses the same R:R ratio and respects the "Stop Loss Only" setting.
VISUAL ELEMENTS
1. Range Lines:
- Drawn from the time when the extreme was formed to the mitigation point (or current
time if not mitigated)
- High lines: Blue (or mitigated color if mitigated)
- Low lines: Red (or mitigated color if mitigated)
- Style: SOLID
- Width: 1
2. Confirmation Lines:
- Drawn when a signal is confirmed
- Extends from the pivot bar to the confirmation bar
- Bearish: Red, solid line
- Bullish: Green, solid line
- Width: 1
- Can be toggled on/off
STRATEGY SETTINGS
1. Range Detection Mode:
- HTF: Uses higher timeframe candles
- Sessions: Uses trading session boundaries
2. Auto HTF:
- Automatically selects HTF based on current chart timeframe
- Can be disabled to use manual HTF selection
3. Risk:Reward Ratio:
- Default: 2.0 (2:1)
- Minimum: 0.5
- Step: 0.5
4. Stop Loss Only:
- When enabled: Trades only have stop loss (no take profit)
- Trades close on stop loss or when opposite signal confirms
5. Reverse on Stop Loss:
- When enabled: Hitting a stop loss opens opposite trade with stop at opposing pivot
6. Max Ranges to Display:
- Limits the number of ranges kept in memory
- Oldest ranges are purged when limit is exceeded
KEY FEATURES
1. Dynamic Pivot Tracking:
- Pivots update on every candle color change
- Always maintains one high and one low pivot
2. Range Lifecycle:
- Ranges are created when price closes within previous range
- Ranges are tracked until mitigated
- Mitigation creates pending signals
- Signals are confirmed by pivot levels
3. Signal Priority:
- Only one pending signal of each type at a time
- New signals replace old ones
- Confirmation happens on close of bar
4. Position Management:
- Closes opposite positions before entering new trades
- Tracks stop loss levels for reverse functionality
- Respects pyramiding = 1 (only one position per direction)
5. Time-Based Drawing:
- Uses time coordinates instead of bar indices for line drawing
- Prevents "too far from current bar" errors
- Lines can extend to any historical point
USAGE NOTES
- Best suited for trending and ranging markets
- Works on any timeframe, but HTF mode adapts automatically
- Sessions mode is ideal for intraday trading
- Pivot detection requires clear candle color changes
- Range detection requires price to close within previous range
- Signals are generated on bar close, not intra-bar
The strategy combines range identification, pivot tracking, and signal confirmation to
create a systematic approach to trading breakouts and reversals based on price structure, past performance does not in any way predict future performance

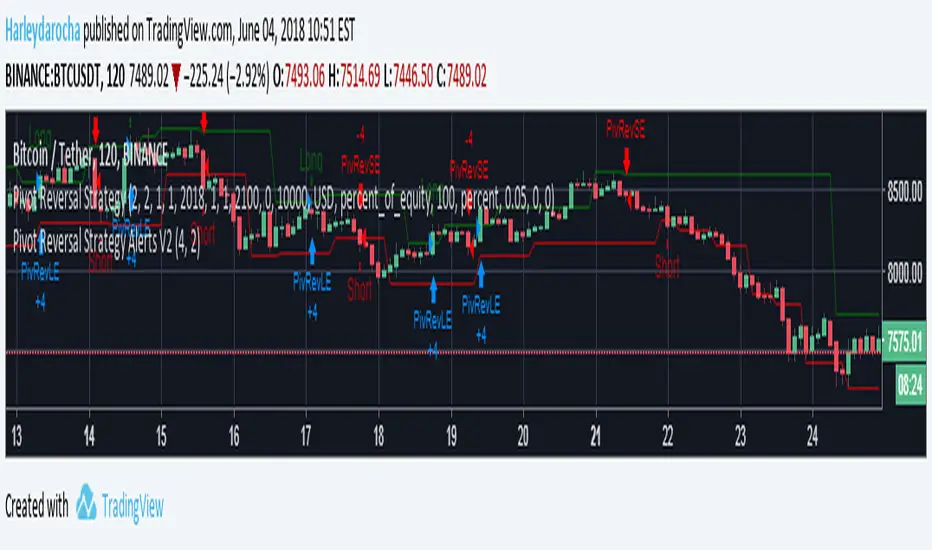
AP_NthPivotCreated by: Andrew Palladino
Date: 1/16/2017
This indicator will display ONLY unhit pivots preceded by additional consecutive unhit pivots.
A pivot is defined as unhit when price travels above or below it without ever crossing the pivot level. A pivot is hit only when prices crosses that level at any given time after the pivot is formed.
The trader can change the following settings:
Pivot Time Frame can be set to: 15, 60, 240, D, W, M or Y
Minimum number of consecutive unhit pivots to display: Default set to 1.
GBPAUD Example:
In the example above there are two AP_NthPivot indicators overlayed.
The blue pivot corresponds to the most recent unhit daily pivot preceded by a second unhit pivot. The red pivot corresponds to the most recent unhit weekly pivot preceded by a second unhit pivot.
The minimum number of consecutive unhit pivots to display, for both cases, is set to 2.
Unhit pivots can become high probability targets, especially when the count is set to 2 or more.

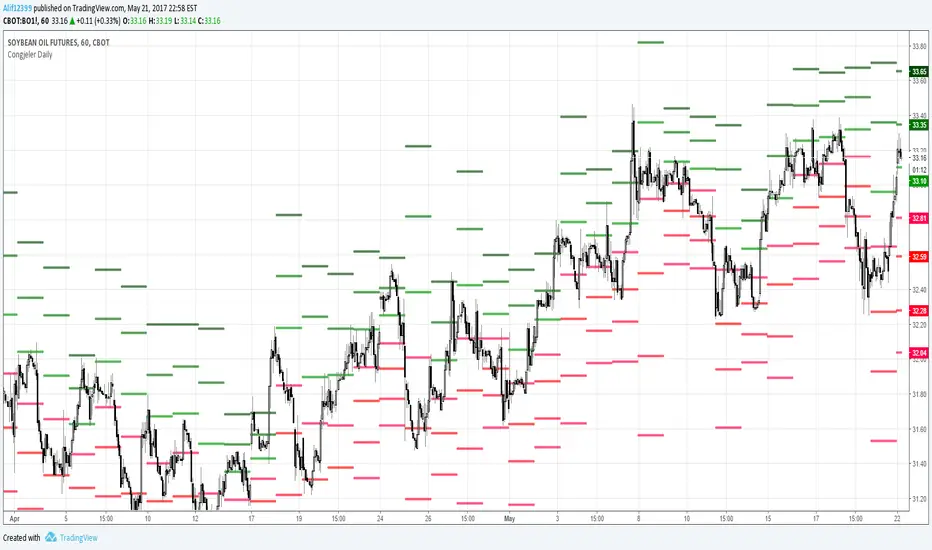
SMC Swing Lines • Core v0.2.6SMC Swing Lines • Core v0.2.6
Purpose
SMC Swing Lines • Core plots objective swing‐based levels used in Smart Money Concepts. The script identifies recent swing highs/lows and projects them as horizontal “liquidity lines” that persist until invalidation (break) or mitigation (touch/retest). It is designed to give a clean structural map for EQH/EQL clusters, sweeps, and level-to-level delivery, without signals or forecasting.
What it plots
Swing High / Swing Low lines – drawn from confirmed pivots.
Status-aware styling – fresh (active) vs mitigated levels can use different line styles/widths/colors.
Optional zones – lines may be displayed as narrow boxes (wick or full range) to reflect the chosen swing area.
Lookback control – limit historical levels by days/bars to keep charts readable.
Notes
• Pivots confirm only after the selected lookback completes; lines are created on confirmation.
• Lines extend to the right until a mitigation/invalidating close, according to your settings.
How it detects swings
Pivot length (L/R): a symmetric left/right bar count forms a pivot.
Area mode:
Wick Extremity – uses absolute high/low (best for liquidity sweeps).
Full Range – uses the candle’s full range/body (stricter structure).
Inputs (key settings)
Pivot Lookback – bars left/right to confirm a swing.
Swing Area – Wick Extremity or Full Range.
Extend Until Fill – keep a level alive until price trades through/taps it (mitigation).
Hide Filled – remove lines once mitigated to reduce clutter.
Line Style & Width – separate styles for highs/lows and for fresh vs mitigated.
Colors – independent high/low/zone colors.
Labels (optional) – minimal markers for visual anchoring.
Lookback Window – limit by bars or days (performance & clarity).
(Exact control names in the panel may use concise variants of the labels above.)
Alerts (optional)
Mitigation / Touch – alert when price interacts with an active line.
Confirmation timing – alerts are designed to evaluate on bar close for reliability.
TradingView Alerts → “Create Alert” → condition: SMC Swing Lines • Core → choose the relevant event and your timeframe.
Recommended use
Timeframes: works from intraday to HTF. Typical ranges:
Intraday (3–15m): Pivot 3–7
Swing (30m–4h): Pivot 5–15
HTF (6h–1D+): Pivot 10–25
Area choice:
Wick Extremity to highlight liquidity grabs/sweeps.
Full Range when you want stricter structure mapping.
Chart hygiene: enable “Hide Filled” or reduce lookback to manage density.
Limitations & behavior
Pivot confirmation: swings appear only after the right-side lookback completes; this is not a “leading” signal.
No strategy component: the script does not generate entries/exits or claims of edge—use it as a structural map alongside your own trade plan (e.g., FVG/OB filters, session timing, volume context).
MTF: if you project higher-TF context via separate layouts, remember that lower-TF price can interact with HTF lines intrabar before the HTF bar closes.
Changelog (Core 0.2.6)
Stability & styling refinements for active vs mitigated levels.
Consistent alerting on bar close.
Minor UI text and default presets cleanup.
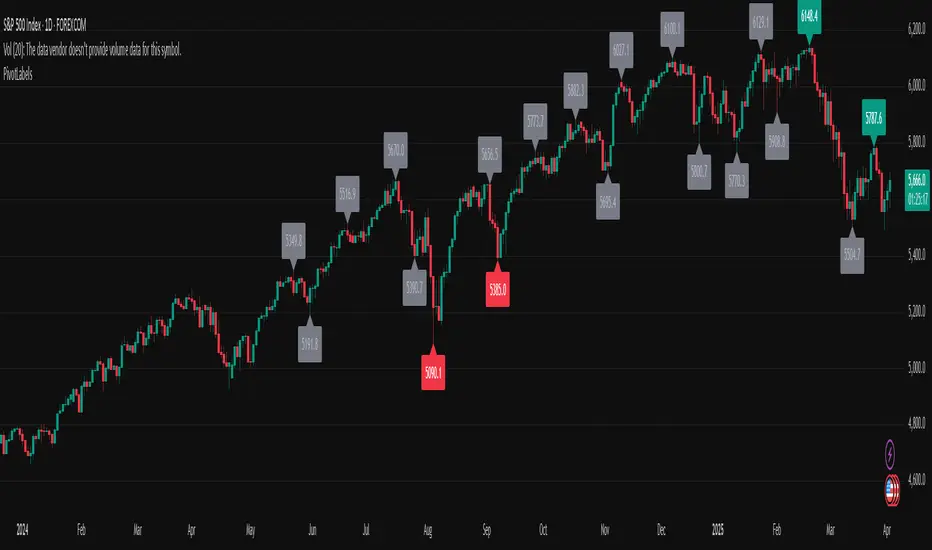
PivotLabelsLibrary "PivotLabels"
drawPivots(qtyLabels, leftLegs, rightLegs)
Displays a label for each of the last `qtyLabels` pivots.
Colors high pivots in green, low pivots in red, and breached pivots in gray.
Parameters:
qtyLabels (int) : (simple int) Quantity of last labels to display.
leftLegs (int) : (simple int) Left pivot legs.
rightLegs (int) : (simple int) Right pivot legs.
Returns: Nothing.
Order Blocks Zones with Signals█ OVERVIEW
“Order Blocks Zones with Signals” is a technical analysis tool that automatically identifies Order Blocks (OB) and optionally Fair Value Gaps (FVG) on the chart.
The script visualizes these zones as colored rectangles, offering full customization of style, transparency, and signal display.
It also generates entry and exit signals (Break & Exit) that can serve as confirmations in strategies based on price action and market structure.
Thanks to flexible candle size filters and rich visual options, the indicator maintains chart clarity and readability.
█ CONCEPTS
Order Blocks (OB) are key zones on the chart where significant price movements previously occurred — areas where large market participants (institutions, so-called smart money) initiated or closed positions.
An OB is the last candle that followed the prior trend before the market reversed (e.g., for a Bullish OB: the last bearish candle before a pivot low and a strong upward impulse).
The script detects these levels using local price pivots, analyzing candle direction to filter out less significant movements.
FVG (Fair Value Gaps) represent areas of imbalance between buyers and sellers — price gaps formed by a sharp impulse where full trading did not occur due to one-sided order dominance (e.g., excess buy or sell orders).
Why combine OB and FVG in one indicator?
Combining OB and FVG analysis is essential because these phenomena often occur sequentially in the institutional market cycle:
1. Order Block — institutions enter the market in the OB zone, absorbing orders and building positions.
2. Strong impulse — after smart money entry, a rapid price move creates an FVG (imbalance gap).
3. Retest — price naturally returns to these zones (OB or FVG), drawn by unfilled orders and the search for equilibrium.
Such areas strongly attract price, as they represent not only historical institutional levels but also open “holes” in the order book. Retests of OB and FVG are ideal entry opportunities with high reaction probability (rebound or breakout). The indicator combines these two interconnected elements, enabling comprehensive market structure analysis in a single tool.
Order Blocks are labeled as:
Bullish OB – demand zones, often accumulation areas before an upmove.
Bearish OB – supply zones, signaling potential impulse end or correction start.
█ FEATURES
Order Block Detection (OB Detection):
- Automatic identification of demand and supply zones based on pivots.
- OB is the last candle aligned with the prior trend, just before the market reversal — precisely identified through candle sequence analysis around the pivot.
- OB zones appear with a delay equal to Pivot Length (default 10 bars).
- Break signals trigger when a candle’s body (close) fully pierces the zone, causing the zone to disappear immediately (e.g., close < low of Bullish OB → Break Down and zone deletion).
- Minimum size filtering via OB Size Multiplier.
- Option to create OB without wicks (Include Wicks in OB): when disabled, OB zones are based solely on candle bodies (open/close), ignoring wicks (high/low).
Fair Value Gap Detection (FVG Detection):
- Optional, with enable/disable capability.
- FVG are detected without delay — immediately upon gap occurrence.
- Size filtering via Candle Size Period and FVG Size Multiplier.
Customizable Styling:
- Separate colors and border styles (Solid / Dashed / Dotted) for each zone type.
- Adjustable transparency and border thickness.
- Unified color for box, border, and signal of the same type.
Breakout and Exit Signals:
- Break Up – triggered when a candle’s close breaks above a Bearish OB, causing the zone to disappear.
- Break Down – triggered when a candle’s close breaks below a Bullish OB, causing the zone to disappear.
- Exit Up / Exit Down – temporary exit from the zone without full breakout (price leaves the zone but doesn’t close beyond it). Signal type selection: Break, Exit, or Both.
- Alerts: built-in alerts for all signal types — triggered automatically on candle close confirming breakout or exit from OB.
█ HOW TO USE
Adding to chart: import the code into Pine Editor and run the script on TradingView.
Settings configuration:
- Pivot Length: controls swing detection sensitivity and OB display delay (default 10).
- Include Wicks in OB: enabled (default) – OB includes wicks; disabled – OB uses bodies only.
- Size Filter: adjust Candle Size Period and OB/FVG Size Multiplier to filter out small zones.
- Colors & Styles: set colors, styles, and transparency for each zone type.
- Signal Type: choose which signals to display (Break, Exit, or Both).
Signal interpretation:
- OB Break Up: price closes above Bearish OB → zone disappears → potential bullish continuation.
- OB Break Down: price closes below Bullish OB → zone disappears → potential bearish continuation.
- Exit Signals: price leaves the zone temporarily without breakout — often signals impending reversal or pullback.
Tips:
- Use OB signals alongside other indicators like RSI, MACD, SMI, or trend filters.
- Order Blocks from higher timeframes (e.g., 4H, 1D) carry greater significance and reaction strength.
- Remember: FVG are detected immediately, OB with delay — a complementary approach!
█ APPLICATIONS
- Smart Money Concepts (SMC): use OB zones as dynamic support and resistance levels. In an uptrend, look for buy opportunities in bullish OBs, which price often retests before further gains. Combining with RSI, MACD, or Fibonacci levels enhances zone significance, confirming institutional demand.
- Breakout Trading: trade based on OB breakout signals. A buy signal after breaking a bearish OB may indicate a strong upward impulse, especially if supported by rising MACD or RSI above 50. Similarly for sell signals after Break Down.
- Reversal Zones: Exit signals may indicate the end of a move or correction. Safest to use in alignment with higher-timeframe trend and confirmed by another indicator (e.g., RSI divergence, Fibonacci levels).
- Confluence Analysis: combine OB and FVG for deeper market structure and equilibrium insight. When an Order Block overlaps or borders an FVG, we get confluence of two institutional phenomena — OB (smart money entry) + FVG (imbalance) — making these areas particularly strong price magnets, increasing retest and reaction probability.
█ NOTES
- FVG can be fully disabled for a cleaner chart view.
- In consolidation periods, signals may appear more frequently — always confirm with additional trend filters.
- Works on all markets and timeframes (crypto, forex, indices, stocks).

Zigzag3 -Invincible3Description:
Zigzag3 - Invincible3 is a powerful and flexible support and resistance indicator for TradingView. Utilizing an enhanced ZigZag algorithm and Dow Theory principles, it detects price pivots, higher highs (HH), lower highs (LH), higher lows (HL), and lower lows (LL). The indicator draws lines and labels to visualize these pivots, making it easier to identify market structure, trends, and potential reversal points.
The Length input allows traders to control the sensitivity of pivot detection.
Support and Resistance Lines:
Displays dotted and solid SR lines based on significant pivots to highlight key market zones.
Option to extend support/resistance lines dynamically with real-time progression for the latest pivot.
Labels for Dow Theory Points:
Mark higher highs, lower highs, higher lows, and lower lows with customizable colors.
Identifies market direction and potential breakout levels with visual clarity.
ZigZag Line Visualization:
Toggle the ZigZag lines to connect pivots for a better understanding of price movement.
Dynamic Dotted Line Progression:
A dotted line extends in real-time from the most recent significant pivot point, aiding in quick analysis.
This indicator is ideal for traders looking to analyze market structure, identify trends, and spot potential reversals. It can be used as a standalone tool or in combination with other strategies for enhanced precision.

Uncharted Territory Fibs📘 Uncharted Territory Fibs
Advanced Fibonacci Projection & Confluence Indicator
(Protected Source)
🧭 Overview
Uncharted Territory Fibs is a next-generation Fibonacci projection system designed for identifying high-probability confluence zones when price enters uncharted territory — areas beyond previous highs or lows.
It automatically detects valid swing pivots, determines trend bias, and plots Fibonacci extensions and projections with built-in cluster logic to highlight the single most powerful confluence level.
⚙️ Core Features
Automatic Trend Bias:
Determines direction using either manual Up/Down selection or EMA-based “Auto” bias detection.
Swing-Based Anchoring:
Uses confirmed pivot highs and lows (non-repainting) to define valid swing legs for Fibonacci mapping.
Fibonacci Extensions & Projections:
Extensions: 1.272, 1.618, 2.618, 4.236
Projections (symmetry): 1.0 and 1.618
These levels map both impulse continuation and symmetry targets.
Cluster Engine:
Groups nearby Fibonacci levels within a user-defined tolerance, identifies the zone with the highest confluence, and designates it as the Prime Level.
Secondary targets are spaced apart for cleaner visualization.
Smart Visualization:
Lines are anchored directly to the last confirmed swing pivot.
Fixed-length projection (default 20 bars) ensures levels stay visually stable.
Labels display exact price and ratio type.
Optional price-scale markers and alert triggers.
Alerts Built-In:
“Near Prime Confluence” alert when price approaches key zone.
“Cross Prime Confluence” alert when price breaks through the zone.
🎯 How to Use
Apply on higher-timeframe charts (4H, Daily, or Weekly recommended).
Choose bias mode: Auto, Uptrend, or Downtrend.
Adjust swing sensitivity (pivot left/right bars).
Toggle which Fibonacci ratios to include.
Tune cluster tolerance and spacing to refine precision.
Watch for Prime Confluence zones forming above or below structure — potential reversal or breakout targets.
Set alerts for automated notifications near critical levels.
💡 Why It’s Different
Unlike basic Fibonacci tools that simply project multiple overlapping lines, Uncharted Territory Fibs performs real-time mathematical clustering to isolate the most statistically dense confluence level — simplifying complex multi-leg Fibonacci relationships into a single actionable zone.
The result: fewer lines, higher confidence, and cleaner market structure visualization when price explores new highs or lows.
🔐 Protected Source Notice
This indicator is released as a Protected Script to preserve proprietary clustering and swing-selection logic.
All calculations, alerts, and visuals are fully functional for users, while the underlying algorithm remains secured.
This complies with TradingView’s publishing standards for unique and non-trivial closed-source scripts.
⚠️ Disclaimer
This tool is for educational and analytical purposes only.
It does not provide financial advice or guarantee performance.
Always perform your own analysis and manage risk accordingly.
🏷 Credits
Concept inspired by Carolyn Boroden’s Fibonacci work and expanded with custom clustering logic and pivot-anchoring methodology for high-timeframe projection analysis.

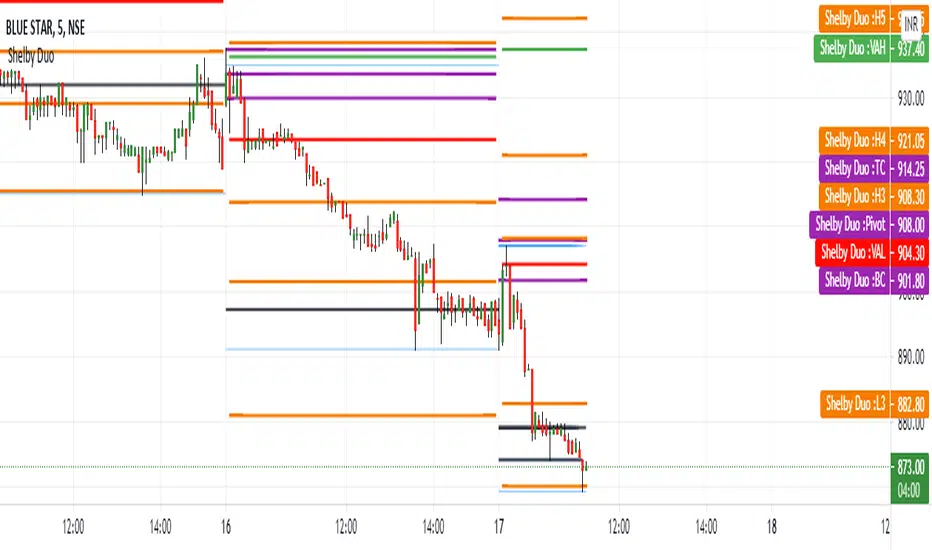
Shelby Duo Shelby Duo indicator is a combination of the following:
1. Central Pivot Range
2. Floor Pivots
3. Camarilla Pivots
4. Volume Point Of Contact
5. Value Area High and Value Area Low
All the pivot calculations are based on Secret of Pivot Boss book by Frank Ochoa .
One can also view tomorrow's central pivot range by today end of the day.
How to use it:
The Golden Pivot Zone is the method given by Frank Ochoa in his book "The Secret of Pivot Boss"
Here, he discusses its types and how to use them efficiently.
There are two types of GPZ,
1.) BEARISH GPZ
2.) BULLISH GPZ
BEARISH GPZ:
A bearish GPZ occurs when H3 of the Camarilla Equation, or any of the Money Zone levels, is mixed within the central pivot range. Therefore, a GPZ is present if any of the following pivots falls within the boundaries of the central pivot range:H3, VAL, VAH, POC, or VPOC. Any bullish advance that fails at the GPZ typically leads to a drop back toward the next area of pivot support, which is generally S1 or L3.
BULLISH GPZ:
A bullish GPZ occurs when L3 of the Camarilla Equation, or any of the Money Zone levels, is mixed within the central pivot range. Therefore, a GPZ is present if any of the following pivots falls within the boundaries of the central pivot range: L3, VAL, VAH, POC, or VPOC. A sell-off or pullback to a bullish GPZ generally leads to an advance back toward the next area of pivot resistance, which is usually R1 or H3.
Entry and Exit Conditions:
BEARISH GPZ: Entry can be taken when it touches the zone. Exit can be done when the price reaches PDL/L3.
BULLISH GPZ: Entry can be taken when it touches the zone. Exit can be done when the price reaches PDH/H3.
MTF Key Levels Pro [Confluence & Flow]MTF Key Levels Pro is an all-in-one market structure and context toolkit designed to reduce chart noise and surface the price levels that matter most. It combines multi-timeframe trend alignment, institutional-style reference levels (VWAP anchors, pivots, volume POC, prior day levels), and confluence detection so you can quickly identify where price is likely to react—and whether the broader flow supports continuation or reversal.
This script is intentionally modular: you can enable only what you trade (scalping, day trading, swing, position) while keeping the chart readable via selective plotting and a compact MTF dashboard.
What It Does
1) Key Levels Engine (Core Map)
The indicator plots a “key-level stack” from multiple methodologies so you are not relying on a single lens:
Volume Profile POC (Point of Control) over a configurable lookback (highest traded activity zone).
Daily Pivot Levels calculated from prior day H/L/C (PP, R1, S1 and extended levels in the logic).
Fibonacci Retracements from recent swing range (38.2 / 50 / 61.8).
Moving Averages (three configurable MAs for trend structure).
Previous Day High/Low (PDH/PDL) for intraday reference points.
ATH/ATL tracking (optional) for macro context.
2) Anchored VWAP Suite (Flow Anchors)
A multi-anchor VWAP system that resets and recalculates at the start of each period:
Hourly VWAP (scalping / micro-structure)
Daily VWAP (day trading standard reference)
Weekly VWAP (swing context)
Monthly VWAP (position context)
3) Multi-Timeframe Alignment Dashboard (Trend Consensus)
The dashboard pulls 5 configurable timeframes (defaults: 5m, 30m, 1h, 4h, D) and displays:
Price snapshot per timeframe
Trend direction (simple momentum/trend comparison vs lookback)
Volume
% change
Alignment status (BULL ALIGNED / BEAR ALIGNED / MIXED), including bars since alignment began
Use this to avoid trading against higher timeframe pressure and to time entries when multiple timeframes agree.
4) Order-Flow Lite (Volume & Delta)
A practical “flow confirmation” layer using candle-based volume classification:
Buy vs sell volume approximation (close vs open)
Delta strength label (Strong Buy / Strong Sell / Neutral)
Volume surge detection vs SMA(volume) with a configurable multiplier
Optional background shading on surge events
5) Confluence Zones (Signal Compression)
Confluence zones automatically form when multiple independent levels cluster together within a configurable tolerance:
You choose tolerance % and minimum levels required (e.g., 3+).
Zones are plotted as highlighted regions and listed in the dashboard with proximity markers (AT / NEAR).
This is the “decision layer”: the script doesn’t just draw levels—it tells you where multiple reasons to react overlap.
How to Use It (Practical Outline)
Typical Workflow
Check dashboard alignment: trade with alignment for continuation setups; treat MIXED as caution/mean-reversion regime.
Identify nearest confluence zones: prioritize trades at/near zones versus isolated single levels.
Use VWAP anchor + PDH/PDL + Pivot as the intraday framework, then confirm with volume surge/delta bias.
Manage risk around zones: zones are natural areas for rejection, breakout, or retest logic.
Recommended Configurations (Quick Start)
Scalping (1m–5m chart): Hourly VWAP + Daily VWAP + Daily Pivots + Confluence
Day Trading (5m–1h): Daily VWAP + Pivots + PDH/PDL + Confluence + Alignment dashboard
Swing (1h–4h): Weekly VWAP + MA50/MA200 + Confluence + Alignment
Position (D/W): Monthly VWAP + MA200 + ATH/ATL + Confluence
Alerts Included
Confluence Touch: triggers when price is within proximity of a confluence zone.
Trend Change: triggers when the alignment state changes (e.g., MIXED → BULL ALIGNED).
Volume Spike: triggers on surge events versus the configured baseline.
Notes / Intended Use
This indicator is built for context and decision support (key levels + trend consensus + flow cues). It is not a standalone “buy/sell system” by design; instead, it provides a structured map for entries, invalidation, and target planning around areas of highest market agreement.
If you want, I can also produce a TradingView-ready “Description + Feature bullets + How to trade + Settings guide + Alert guide” in the exact formatting style commonly used on public TradingView scripts (including a short disclaimer and a clean feature list).

TwistedHWAY Oracle - Intelligent Level Detection System═════════════════════════════════════════════════════════════════════════
🎯 TwistedHWAY Oracle™ - Intelligent Level Detection System
═════════════════════════════════════════════════════════════════════════
OVERVIEW
TwistedHWAY Oracle™ combines six independent calculation engines to identify high-probability support and resistance levels. The indicator uses adaptive market regime detection and confluence analysis to automatically rank levels by confidence score, helping traders identify key reaction zones where price is likely to find support or resistance.
KEY FEATURES
The indicator provides comprehensive level detection through:
Six Detection Engines — Each engine operates independently with its own alert system
Confluence Analysis — Automatically awards bonus confidence when multiple engines identify the same level
Adaptive Intelligence — Market volatility detection adjusts parameters in real-time
Confidence Scoring — Every level is ranked and displayed with a numerical confidence score
Individual Alerts — Separate alert controls for each detection method
DETECTION ENGINES
1 — Pivot Points Engine
Calculates daily pivot levels including PP, R1-R3, and S1-S3 using previous day's high, low, and close.
2 — Swing Detector
Identifies significant swing highs and lows using prominence filtering to eliminate noise.
3 — Psychological Matrix
Detects round number levels at three configurable increments (default: 10, 25, 50).
4 — Fibonacci Engine
Calculates retracement levels (23.6%, 38.2%, 50%, 61.8%, 78.6%) from major swings.
5 — VWAP System
Generates volume-weighted average price levels at three different periods.
6 — Confluence Analyzer
Awards bonus confidence points when multiple engines identify the same level.
HOW TO USE
Reading the Levels
Levels above current price = Resistance (red by default)
Levels below current price = Support (green by default)
Numbers in brackets show confidence score
Higher confidence = stronger level
Levels with score > 2.0 indicate extreme confluences
Trading Strategies
Bounce Trading — Enter positions when price approaches high-confidence levels expecting reversal
Breakout Trading — Trade breakouts through levels, using broken level as stop-loss
Confluence Zones — Focus on areas where multiple engines agree
SETTINGS GUIDE
Oracle Settings
Validation Mode — Conservative parameters for more reliable signals
Max Levels — Number of levels to display (10-50)
Level Extension — Line extension direction (None/Left/Right/Both)
Individual Engine Controls
Each engine can be toggled on/off with separate alert controls:
Pivot Engine (daily pivots)
Swing Detector (historical swings)
Psychological Matrix (round numbers)
Fibonacci Engine (retracements)
VWAP System (volume-weighted levels)
Visual Settings
Individual color selection for each level type
Label display toggle with size options
Line style preferences (Solid/Dashed/Dotted)
Alert Configuration
Alert Distance % — Proximity threshold (default: 0.5%)
Alert Cooldown — Minimum bars between alerts (default: 60)
Individual alert toggles for each engine
ADAPTIVE PARAMETERS
The indicator automatically adjusts to market conditions:
High Volatility Mode — Wider swing detection, stricter prominence filters
Normal Mode — Balanced parameters for typical market conditions
Validation Mode — Most conservative settings for reliable signals
Market regime is detected using 100-period volatility measurement with automatic threshold adjustment.
ALERTS
Five alert types plus special confluence alerts:
🎯 Pivot Alerts — Daily pivot level approaches
🌊 Swing Alerts — Historical swing level tests
🧠 Psychological Alerts — Round number approaches
🌀 Fibonacci Alerts — Retracement level tests
📉 VWAP Alerts — Volume-weighted level approaches
⚡ Critical Alerts — Ultra-high confidence levels (score ≥ 2.0)
Alerts include price level, confidence score, and source information.
BEST PRACTICES
Timeframe Selection
Works on all timeframes (optimized for 5min to Daily)
Higher timeframes = more reliable levels
Use multi-timeframe analysis for confirmation
Optimization by Instrument
Forex:
Psychological increments: 0.0010, 0.0050, 0.0100
Stocks (Low-priced):
Psychological increments: 1, 5, 10
Stocks (High-priced):
Psychological increments: 10, 25, 50
Crypto:
Adjust based on price range and volatility
LIMITATIONS
Calculation intensive on last bar (may cause slight delays)
Maximum 50 levels can be displayed simultaneously
Swing detection requires minimum 25 bars of history
VWAP calculations use price range as volume proxy when volume unavailable
NOTES
Levels are recalculated on each bar close
Confidence scores update dynamically with market conditions
Colors automatically adjust based on price position
All settings are saved with chart layout
═════════════════════════════════════════════════════════════════════════
Version: 3.0 | Build 2025.10
License: GNU GPL v3.0
© 2025 TwistedHWAY
═════════════════════════════════════════════════════════════════════════
TraderLion Price LabelsTraderLion's Price Labels Indicator identifies price pivot points for both high and low price pivots using in house TL logic. The predominant features of the indicator are highlighted below:
1. Percent change from the most recent pivot shown in parenthesis below the price label.
2. Green label if the percent change from the most recent pivot is greater than +5%.
3. Red label if the percent change from the most recent pivot is less than -5%.
4. Ability to set color scheme for light or dark these charts.
5. Ability to set label color to match the background of your chart.
Suggestions for additions or tweaks? Comment below!

Murrey Math Lines v6Murrey Math Lines v6
This is not just another Murrey Math indicator. It's a complete, ground-up modernization of the classic concept, rebuilt with the latest Pine Script features for unparalleled performance, accuracy, and usability. While preserving the core mathematical genius of T.H. Murrey's system, this version introduces a suite of modern tools designed for today's trader.
What are Murrey Math Lines?
Murrey Math Lines (MML) are a powerful system of support and resistance based on geometric formulas developed by T.H. Murrey. As a derivation of W.D. Gann's observations, Murrey's geometry simplifies Gann's theories into a more accessible application. The core principle is that price action tends to trend and retrace in 1/8th intervals.
These intervals create a "trading octave" with distinct levels, each having its own characteristic behavior:
& - Ultimate Resistance & Support: These lines are the hardest to break. They represent the top and bottom of the expected price range and are prime areas for reversals.
- Major Pivot: This is the most significant level, offering the strongest support and resistance within the octave. Price has a high probability of stopping and reversing here.
& - Strong Pivot/Reversal: These are strong, secondary pivot points where price often struggles to pass through.
& - The Trading Range: The price tends to consolidate between these two lines about 50% of the time. A decisive break outside this range often signals the start of a new trend.
& - Weak Support/Resistance: These levels are weaker, but when price moves too quickly towards them, they can act as initial stopping points or areas for a minor reversal.
& - Extended Octave: These lines show extreme overbought and oversold conditions beyond the primary 0/8 to 8/8 octave.
Modern Enhancements in This Version
Session-Locked Precision: Anchor the Murrey Lines to the start of a specific trading session (e.g., NYSE open). The levels remain constant for the entire session, providing a stable and reliable framework for your daily analysis.
Visual Trading & Reversal Zones: Instead of just lines, this indicator can fill the key trading range (3/8 to 5/8) and reversal zones (0/8-1/8 & 7/8-8/8) with color, giving you an instant visual reference of market sentiment.
Dynamic "Closest Price" Labels: Declutter your chart! The indicator can intelligently display only the label for the Murrey level closest to the current price, keeping your view clean while providing critical information at a glance.
Integrated Alert System: Never miss a key level touch again. Set up alerts for when the price approaches major lines, the trading range, or all lines, customized to your trading style.
Advanced Pine Script Engine: Built on a modern codebase using User-Defined Types and dynamic drawing objects (line, box, label). This ensures the indicator is fast, efficient, and non-repainting, even on lower timeframes.
Intuitive User Interface: Settings are neatly organized into collapsible groups with clear tooltips, making it incredibly easy to customize every aspect of the indicator, from calculation parameters to colors.
A Note on Accuracy
Some of the other Murrey Math indicators on TradingView use different formulas and therefore produce varying results. This version has been carefully checked against MML indicators on other professional platforms to ensure its calculations are accurate and reliable.
Credits
This indicator is a complete overhaul and modernization of the original "MM Lines " script. Full credit for the original calculation logic and concept goes to its author, JRL_6.
