Volume-Confirmed FTR Zones [AlgoPoint]FTR Zone Indicator — Fail To Return Zones (With Volume Confirmation)
Advanced Smart Money Zone Detection for Institutional Orderflow
The FTR Zone Indicator is a professional-grade tool designed for traders who follow Smart Money Concepts (SMC), ICT methodologies, or institutional orderflow. It automatically detects Fail To Return Zones (FTR) — high-probability supply and demand areas formed after strong displacement moves.
By combining impulse detection, base identification, and volume confirmation, this indicator highlights zones where price is most likely to react, reverse, or mitigate shortly after structure breaks.
⸻
⭐ What Are FTR Zones?
FTR zones (Fail To Return zones) are price areas where:
1. A strong displacement / impulse candle is formed
2. That impulse originates from a small consolidation (base)
3. Price moves away aggressively
4. AND fails to return immediately to the origin area
These zones often indicate:
• Institutional orders
• Imbalance
• Hidden liquidity
• Origin of a trend leg
• High-probability mitigation points
This indicator fully automates the detection and visualization of such areas.
🔍 How the Indicator Works
1. Impulse Detection
The indicator identifies a valid impulse candle using:
• ATR-based bar range filter
• Trend-aligned candle body direction
• Optional volume confirmation
Only large, meaningful institutional candles qualify — filtering out noise.
2. Base Zone Identification
Before every impulse, the tool finds the micro-consolidation base using:
• Highest high of the last X bars
• Lowest low of the last X bars
This base becomes the potential FTR zone.
3. FTR Zone Creation
When a valid impulse is detected:
• Bullish impulse → Demand FTR zone
• Bearish impulse → Supply FTR zone
The zone is immediately drawn on the chart using box.new().
4. Zone Extension
Every zone continuously extends to the right as price evolves, allowing you to track:
• Mitigation
• Retests
• Reaction points
• Liquidity sweeps
5. Invalidation Logic
Zones automatically delete when violated:
• Demand zone invalid if close < zone low
• Supply zone invalid if close > zone high
This keeps the chart clean and helps focus only on active, high-value areas.
🎛️ Key Features
✔ Automatic FTR Zone Detection
Instantly identifies institutional origin zones based on real impulse and displacement.
✔ Volume-Based Filtering
Ensures only high-volume impulses (true institutional orders) create zones.
✔ Supply & Demand Coloring
• Bullish FTR → Demand Zone (Teal tone)
• Bearish FTR → Supply Zone (Red tone)
✔ Safe Zone Storage
Fault-tolerant logic ensures no array errors, invalid zones, or broken visuals.
✔ Auto-Extending Boxes
Real-time zone updates with precise historical mapping.
✔ Smart Invalidation
Zone is removed only when fully broken, preventing false signals.
✔ Clean, Non-Repainting Logic
Impulse detection and zone placement are confirmed only on bar close.
📈 How to Use It (Example Schenarios)
For Reversals or Continuations
• Look for price reacting or mitigating inside a zone
• Use as entry confirmation in trend continuations
• Combine with FVG, BOS/CHOCH, liquidity sweeps, or premium/discount zones
For Scalping or Intraday Trading
• High-probability countertrend entries
• Reaction-based setups at institutional footprints
For Swing Traders
• Identify weekly/daily origin zones
• Plan entries around large displacement points
ابحث في النصوص البرمجية عن "zone"

EWC Zone Matrix📌 EWC Precision Blocks
🔎 Overview
EWC Precision Blocks is a professional market analysis tool designed to highlight high-probability trading zones on the chart. Instead of relying on lagging signals, this indicator maps out Alpha Zones (bullish) and Beta Zones (bearish), allowing traders to identify potential market reaction areas with clarity.
The algorithm is built to adapt across Scalp, Swing, and Position trading modes, making it flexible for short-term intraday traders as well as long-term investors.
⚡ Key Features
Multi-Mode Detection – Switch between Scalp, Swing, or Position modes depending on your trading style.
EWC Alpha Zone (Bullish Detection) – Highlights areas where the market may find strong upward momentum.
EWC Beta Zone (Bearish Detection) – Highlights areas where the market may face downward pressure.
Zone Break Tracking – Visualizes when a zone has been invalidated or broken.
Body-Based Detection – Option to base calculations on candle bodies instead of wicks for precision.
Zone Flips – Displays polarity shifts when zones transition from supportive to resistive behavior (and vice versa).
Custom Styling – Full control of zone and break colors for clear chart visualization.
🎯 How to Use
Select Your Mode
Scalp → Designed for fast intraday moves.
Swing → Medium-term setups, ideal for session trading.
Position → Long-term outlook, suitable for investors.
Watch the Alpha Zones
Highlighted bullish areas can serve as potential support or accumulation zones.
Watch the Beta Zones
Highlighted bearish areas may act as resistance or distribution zones.
Monitor Breaks & Flips
Alpha Breaks → Bullish zones failing.
Beta Breaks → Bearish zones failing.
Zone Flips → Polarity changes, often powerful signals.
🛠 Inputs & Customization
EWC Mode → Choose Scalp, Swing, or Position.
Show Last Alpha Zone → Set how many bullish zones to display.
Show Last Beta Zone → Set how many bearish zones to display.
Body-Based Detection → Toggle candle body vs. wick calculation.
EWC Alpha Zone / Beta Zone Styling → Customize zone colors.
Alpha Break / Beta Break Colors → Adjust break visuals.
Show Zone Flips → Enable/disable historical polarity labels.
Status Bar → Display inputs directly in the chart status line.
📈 Best Practices
Works across all timeframes and markets (forex, crypto, indices, stocks).
Combine with your existing strategy for confirmation.
Use in alignment with higher timeframe structure for maximum accuracy.
⚠ Disclaimer
EWC Precision Blocks is a market visualization tool provided for educational purposes only. It does not provide financial advice, signals, or guaranteed results. Always do your own research and manage risk responsibly.
🔹 About EWC
EWC (EastWave Capital) is dedicated to developing professional-grade trading tools and strategies for traders across forex, crypto, commodities, and indices. With over a decade of combined market experience, our mission is to empower traders with precision, clarity, and confidence in their decision-making.
EWC Precision Blocks is one of our flagship tools, reflecting our commitment to innovation, transparency, and trader-focused solutions.
📌 Published by Usama Manzoor — Founder of EastWave Capital (EWC)
1 minute ago
Release Notes
EWC Precision Blocks
The EWC Alpha-Beta Zone Detector is designed for traders who value clarity, precision, and flexibility in their chart analysis.
By mapping out Alpha (strength) and Beta (weakness) zones, this script provides a structured way to understand how price reacts to key levels in the market.
This indicator is built on price action principles and market structure analysis, avoiding clutter and focusing on the essentials traders need. Whether you are scalping on lower timeframes or analyzing swing opportunities, the Alpha-Beta Zone Detector adapts to your style.
🔹 Core Features
Alpha & Beta Zones → Detects bullish and bearish strength zones in real time.
Highlight Last Zone → Focus on the most recent Alpha/Beta zone for clarity.
Zone Flip Detection → Identifies polarity changes when zones shift from support to resistance or vice versa.
Body-Based Detection → Option to base calculations on candle bodies instead of wicks for more accuracy.
Flexible Timeframe Sensitivity → Switch between short, intermediate, and long-term detection modes.
Custom Zone Styling → Adjust colors, opacity, and line thickness for both Alpha and Beta zones.
Break Visualization → Display breaks of Alpha and Beta zones for additional confirmation.
Market Versatility → Works seamlessly on Forex, Crypto, Indices, Commodities, and Stocks.
🔹 Why Traders Use It
Provides a clear visual guide to market decision zones.
Helps traders refine entries, stop-loss placement, and take-profit levels.
Adapts to multiple trading styles → scalpers, intraday traders, and swing traders.
Keeps charts clean and professional without overloading with unnecessary signals.
⚠️ Disclaimer:
This script is created for educational and informational purposes only. It does not provide financial advice. Trading involves risk; always manage your risk responsibly and conduct your own analysis before entering any position.
Sunset Zones by PDVDescription
Sunset Zones by PDV is an intraday reference indicator that plots key horizontal levels based on selected “root candles” throughout the trading day. At each programmed time, the indicator identifies the high and low of the corresponding candle and projects those levels forward with extended lines, providing traders with a clean visual framework of potential intraday reaction zones.
These zones serve as reference levels for support, resistance, liquidity grabs, and session context, allowing traders to analyze how price reacts around time-specific structures. Unlike lagging indicators, Sunset Zones gives traders real-time, rule-based levels tied directly to the price action of specific moments in the session.
Key Features
Predefined Time Codes
The script comes with a curated list of intraday timestamps (in HHMM format). Each represents a “root candle” from which levels are generated. Examples include 03:12, 06:47, 07:41, 08:51, etc. These time codes can reflect historically important market moments such as session opens, liquidity sweeps, or volatility inflection points.
Automatic Zone Plotting
At each root time, the script captures the candle’s high and low and instantly extends those levels forward across the chart. This provides consistent, objective reference points for intraday trading.
Extended Lines
Levels are projected far into the future (default: 500 bars) so traders can easily track how price interacts with those zones throughout the day.
Color-Coded Levels
Each root time is assigned a distinct color for fast identification. For example:
03:12 → Fuchsia
06:47 → Purple
07:41 → Teal
08:51 → White
09:53 → White
10:20 → Orange
11:10 → Green
11:49 → Red
12:05 → White
13:05 → Teal
14:09 → Aqua
This helps traders quickly recognize which time-of-day level price is interacting with.
Lightweight & Visual
The indicator focuses purely on price and time, avoiding complexity or lagging signals. It can be layered with other analysis tools, order flow charts, or session-based studies.
Practical Use Cases
Intraday Bias:
Observe whether price respects, rejects, or consolidates around these reference levels to form a bias.
Liquidity Zones:
High/low sweeps of the root candle can act as liquidity pools where institutions might trigger stops or reversals.
Support & Resistance:
Extended lines create intraday S/R zones without the need to manually draw levels.
Confluence Finder:
Combine Sunset Zones with VWAP, session ranges, Fibonacci levels, or higher-timeframe structure for layered confluence.
Important Notes
This is a visual reference tool only. It does not generate buy or sell signals.
Default times are provided, but the concept is flexible — traders can adapt it by modifying or expanding the list of time codes.
Works best on intraday timeframes where session structure is most relevant (e.g., 1-minute to 15-minute charts).
✅ In short: Sunset Zones by PDV gives intraday traders a systematic way to anchor their charts to important time-based highs and lows, creating a consistent framework for analyzing price reactions across the day.

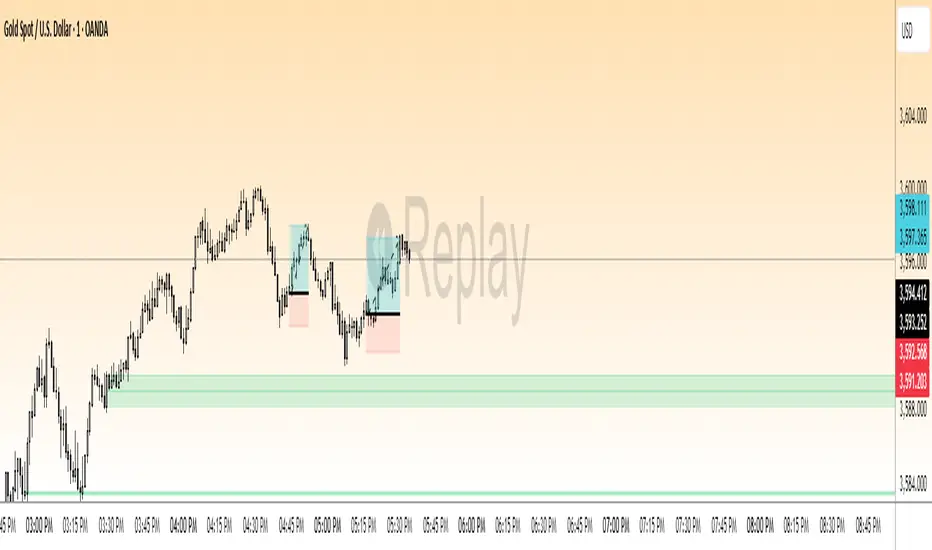
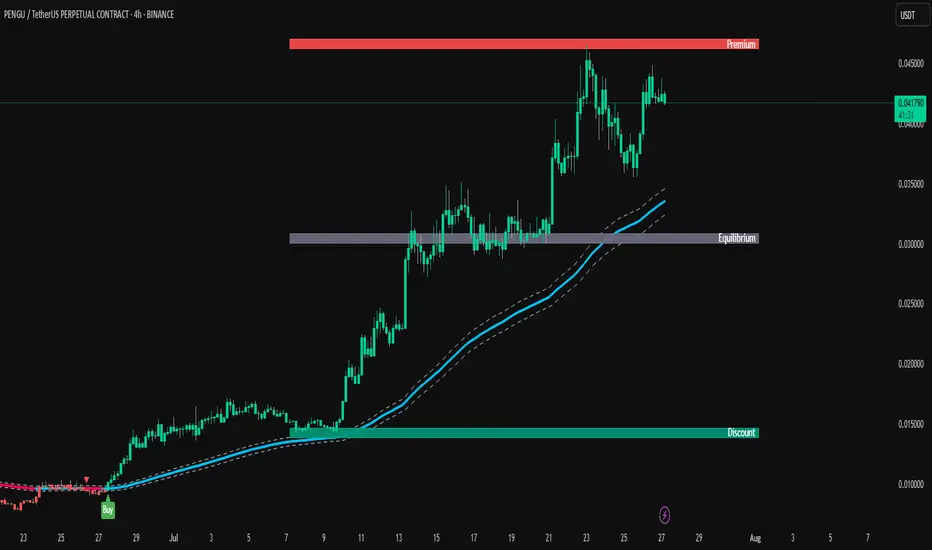
TrendPilot AI v2 — Smart ATR Indicator with ZonesTrendPilot AI v2 is a smart price-action and ATR-based trading system designed for swing and position traders. It combines trend-following logic with adaptive price zones to help users identify high-probability Buy and Sell opportunities — along with intelligent re-entry points, weak signal detection, and visual structure zones.
🔧 Core Features:
✅ ATR-based Buy/Sell signals with confirmation logic
✅ Dynamic 99 EMA Channel for trend context
✅ Re-entry triangles for stacking or retracing setups
✅ 150 EMA Weak Signal Detection for early trend warnings
✅ 🧭 Price Action Zones (Premium, Equilibrium, Discount)
✅ Visual alerts via triangles, labels, and color-coded logic
✅ Designed for 15m, 1H, and 4H charts — also useful on Daily
🧠 How It Works (Logic Breakdown)
1️⃣ Trend Direction — EMA Channel Logic
A 99 EMA Channel determines the dominant market bias.
If price is above the channel → trend is Bullish → Buy signals are valid
If price is below the channel → trend is Bearish → Sell signals are valid
2️⃣ Buy/Sell Signals — ATR Trailing Logic
The system uses custom ATR trailing logic to detect when price momentum shifts.
When a breakout aligns with trend direction, a Buy or Sell label appears.
These are designed to capture the main trend leg or reversal zone.
3️⃣ Re-Entry Signals — Triangle Visual Cues
During a confirmed trend, if price retraces to the EMA channel, a small triangle is shown:
🔼 Green triangle: Buy re-entry during bullish trend
🔽 Red triangle: Sell re-entry during bearish trend
These are not new signals but continuation cues for advanced traders.
4️⃣ Weak Signal Detection — 150 EMA Logic
A secondary 150 EMA helps detect possible trend exhaustion.
If price dips below 150 EMA during a bullish run, an orange triangle appears (⚠️ caution).
If price rises above 150 EMA during a bearish run, a blue triangle appears.
This signals potential weakening of the active trend.
5️⃣ Price Zones — Premium, Equilibrium, Discount
TrendPilot AI v2 draws 3 smart price zones based on ATR & market structure:
🟥 Premium Zone (Top) → Overbought area, caution for long trades
🟨 Equilibrium Zone (Middle) → Fair value, consolidation possible
🟩 Discount Zone (Bottom) → Oversold, better long entries
These zones help filter signals and avoid entries in risky areas.
Example: Avoid Buy signals inside Premium zone.
🧪 Suggested Use:
✅ Timeframes: 15m / 1H / 4H / 1D
✅ Combine signals with zone analysis for optimal entries
✅ Use re-entry triangles to add or confirm during pullbacks
✅ Use weak signal warnings to tighten stops or manage risk
✅ Works best in trending environments or breakout markets
⚠️ Note for Users:
This script is not repainting. All signals are plotted with stable logic.
Past performance does not guarantee future results — always backtest first.
Script does not contain financial advice — use at your own discretion.
Pullback Entry Zone FinderPullback Entry Zone Finder
Overview:
This indicator is designed to help traders identify potential buying opportunities during short-term pullbacks, particularly when faster-moving averages show signs of converging back towards slower ones. It visually flags potential zones where price might find support and resume its upward movement, based on moving average dynamics and price proximity.
How It Works:
The indicator utilizes four customizable moving averages (Trigger, Short-term, Intermediate, and Long-term) and Average True Range (ATR) to pinpoint specific conditions:
Pullback Detection: It identifies when the fast 'Trigger MA' is below the 'Short-term MA', indicating a potential short-term pullback or consolidation phase.
MA Convergence: Crucially, it looks for signs that the pullback might be weakening by detecting when the gap between the Short-term MA and the Trigger MA is narrowing (maConverging). This suggests the faster average is starting to catch up, potentially preceding a move back up.
Base Buy Zone (Orange Diamond): This signal appears when both the Pullback and Convergence conditions are met simultaneously. It indicates the general area where conditions are becoming favourable for a potential entry.
Refined Entry Zones:
Prime Entry Zone (Green Diamond): This appears within a Base Buy Zone if the bar's low comes within a specified percentage (Max Distance %) of the Short-term MA. It suggests price has pulled back close to the dynamic support of the Short MA.
ATR Entry Zone (Purple Diamond): This appears within a Base Buy Zone if the bar's low comes within the specified percentage (Max Distance %) of an ATR-based target level. This target level (Buy ATR Target Level, plotted as a purple line when active) is calculated by adding a multiple (ATR Multiplier %) of the ATR to the Short-term MA, providing a volatility-adjusted potential entry area.
Visual Elements:
Moving Averages: Four lines representing the Trigger, Short-term, Intermediate, and Long-term MAs (colors and opacity are customizable). Use the Intermediate and Long-term MAs to gauge the broader market trend.
Orange Diamond (Below Bar): Indicates a 'Base Buy Zone' where a pullback and MA convergence are detected.
Green Diamond (Below Bar): Indicates a 'Prime Entry Zone' where price is close to the Short-term MA during a Base Buy Zone.
Purple Diamond (Below Bar): Indicates an 'ATR Entry Zone' where price is close to the ATR-based target level during a Base Buy Zone.
Purple Line: Plots the calculated 'Buy ATR Target Level' only when the Base Buy Zone condition is active.
Input Parameters:
Moving Averages: Customize the Length and Type (EMA, SMA, WMA, VWMA) for all four moving averages.
ATR Settings: Adjust the ATR Length, the ATR Multiplier % (for calculating the target level), and the Max Distance % (for triggering the Prime and ATR Entry Zones).
Visualization: Set the colors for the four Moving Average lines.
How to Use:
Look for the Orange Diamond as the initial signal that pullback/convergence conditions are met.
The Green and Purple Diamonds suggest price has reached potentially more optimal entry levels within that zone, based on proximity to the Short MA or the ATR target, respectively.
Always consider the signals within the context of the broader trend, indicated by the Intermediate and Long-term MAs. This indicator is generally more effective when used to find entries during pullbacks within an established uptrend (e.g., Intermediate MA > Long MA).
Combine these signals with other forms of analysis, such as chart patterns, support/resistance levels, volume analysis, or other indicators for confirmation.
Disclaimer:
You should always use proper risk management techniques and conduct your own analysis before making any trading decisions. This indicator, or any other, will be of no use if you don't have good risk management.

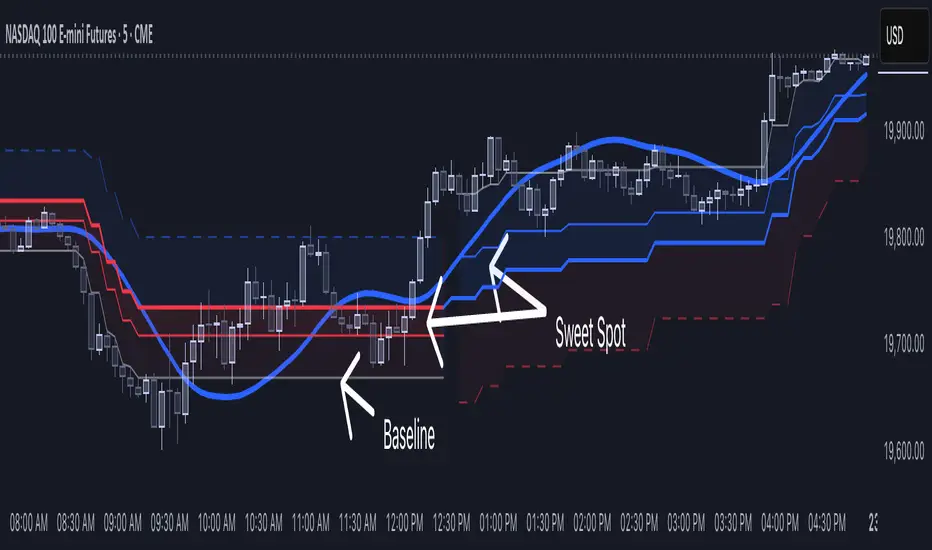
[NLR] - SweetSpot ZonesThe Sweet Spot Zone helps you find the best spots to enter a trade, inspired by the " Follow Line Indicator " by Dreadblitz (big thanks to him!). It draws a colored zone on your chart to show ideal entry points, with a Base Point to keep you on track.
What It Does
Blue Zone: Uptrend—buy when the price dips into the zone.
Red Zone: Downtrend—sell or short when the price climbs into the zone.
Base Point: A gray line showing the key level the zone is built on.
How to Use It
Look for the colored zone:
- Blue: Buy if the price dips into the zone but stays above the Base Point.
- Red: Sell/short if the price climbs into the zone but stays below the Base Point.
Important: Avoid entering trade beyond base point - you might see low returns and face big drawdowns.
Confirm with other signals (like RSI/MACD) before entering.
Settings
ATR Length (10): How far back it looks to calculate price movement.
ATR Multiplier (2.5): How wide the zone is.
Error Margin (5.0): Keeps the zone steady during small price wiggles.
Uptrend/Downtrend Colors: Change the zone colors if you’d like!
Credits
Inspired by the "Follow Line Indicator" by Dreadblitz—check out his work for more great ideas!
Support, Resistance & Liquidity Pool ZonesSupport, Resistance & Liquidity Pool Zones
This indicator automatically detects and plots support and resistance levels based on pivot points and highlights liquidity pool zones, areas where the trading volume exceeds the average over a set number of bars. It is designed to help traders identify key price levels and liquidity traps that can trigger significant market reactions.
Key Features:
Support & Resistance Levels:
The indicator identifies pivot highs and pivot lows as potential resistance and support levels, respectively.
You can customize the number of levels shown on the chart, making it easier to focus on the most recent and relevant price levels.
Liquidity Pool Zones:
The script detects liquidity pool zones, which are areas with above-average trading volume. These zones often act as regions of interest where price accumulation or distribution occurs, potentially leading to significant price moves.
Liquidity zones are shaded to help traders visually identify areas of high interest in the market.
Customizable Settings:
You can adjust the pivot period to fine-tune how the indicator calculates support and resistance.
Control the number of support/resistance levels displayed on the chart and the period used to detect liquidity pools.
Customize the colors for support, resistance, and liquidity zones to match your charting preferences.
Alerts:
The script includes built-in alerts for when the price breaks above resistance or falls below support, helping traders catch key breakout opportunities.
How It Works:
The script calculates support and resistance levels using pivot highs and lows based on the user-defined pivot period.
It monitors liquidity pool zones by comparing the current trading volume with the average volume over a customizable period. When the volume exceeds the set threshold, a liquidity pool zone is highlighted, providing insight into where the market may accumulate or distribute.
Alerts are triggered when the price breaks above the first resistance level or falls below the first support level, giving traders immediate notification of key market events.
How to Use:
Tune the Pivot Period: Adjust the pivot period to your preferred time horizon (default: 10 bars).
Set Liquidity Pool Parameters: Customize the number of bars considered for liquidity pool detection and the volume multiplier to detect high-volume zones.
Monitor Breakouts: Use the built-in alerts to catch potential breakout or breakdown opportunities near support and resistance levels.
This script is ideal for traders looking for an easy-to-use tool to visualize support and resistance levels and liquidity pools, aiding in decision-making and trade management.

Relative volume zone + Smart Order Flow Dynamic S/ROverview:
The Relative Volume Zone + Smart Order Flow with Dynamic S/R indicator is designed to help traders identify key trading opportunities by combining multiple technical components. This script integrates relative volume analysis, order flow detection, VWAP, RSI filtering, and dynamic support and resistance levels to offer a comprehensive view of the market conditions. It is particularly effective on shorter timeframes (M5, M15), making it suitable for scalping and day trading strategies.
Key Components:
1. Relative Volume Zones:
• The script calculates the relative volume by comparing the current volume with the average volume over a defined lookback period (volLookback). When the relative volume exceeds a specified multiplier (volMultiplier), it indicates a high volume zone, signaling potential accumulation or distribution areas.
• Purpose: Identifies high-volume trading zones that may act as significant support or resistance, indicating possible entry or exit points.
2. Smart Order Flow Analysis:
• The indicator uses Volume Delta (the difference between buying and selling volume) and a Cumulative Delta to detect order imbalances in the market.
• Order Imbalance is identified using a moving average of the Volume Delta (orderImbalance), which helps highlight hidden buying or selling pressure.
• Purpose: Reveals market sentiment by showing whether buyers or sellers dominate the market, aiding in the identification of trend reversals or continuations.
3. VWAP (Volume Weighted Average Price):
• VWAP is calculated over a default daily length (vwapLength) to show the average price a security has traded at throughout the day, based on both volume and price.
• Purpose: Provides insight into the fair value of the asset, indicating whether the market is in an accumulation or distribution phase.
4. RSI (Relative Strength Index) Filter:
• RSI is used to filter buy and sell signals, preventing trades in overbought or oversold conditions. It is calculated using a specified period (rsiPeriod).
• Purpose: Reduces false signals and improves trade accuracy by only allowing trades when RSI conditions align with volume and order flow signals.
5. Dynamic Support and Resistance Levels:
• The script dynamically plots support and resistance levels based on recent swing highs and lows (swingLookback).
• Purpose: Identifies potential reversal zones where price action may change direction, allowing for more precise entry and exit points.
How It Works:
• Buy Signal:
A buy signal is generated when:
• The price enters a high-volume zone.
• The price crosses above a 5-period moving average.
• The cumulative delta shows more buying pressure (cumulativeDelta > SMA of cumulativeDelta).
• The RSI is below 70 (not in overbought conditions).
• Sell Signal:
A sell signal is generated when:
• The price enters a high-volume zone.
• The price crosses below a 5-period moving average.
• The cumulative delta shows more selling pressure (cumulativeDelta < SMA of cumulativeDelta).
• The RSI is above 30 (not in oversold conditions).
• Dynamic Support and Resistance Lines:
Drawn based on recent swing highs and lows, these lines provide context for potential price reversals or breakouts.
• VWAP and Order Imbalance Lines:
Plotted to show the average traded price and highlight order flow shifts, helping to validate buy/sell signals.
How to Use:
1. Apply the Indicator:
Add the script to your chart and adjust the settings to match your trading style and preferred timeframe (optimized for M5/M15).
2. Interpret the Signals:
Use the buy and sell signals in conjunction with dynamic support/resistance, VWAP, and order imbalance lines to identify high-probability trade setups.
3. Monitor Alerts:
Set alerts for significant order flow events to receive notifications when there is a positive or negative order imbalance, indicating potential market shifts.
What Makes It Unique:
This script is unique because it combines multiple market analysis tools — relative volume zones, smart order flow, VWAP, RSI filtering, and dynamic support/resistance — to provide a well-rounded, multi-dimensional view of the market. This integration allows traders to make more informed decisions by validating signals across various indicators, enhancing overall trading accuracy and effectiveness.

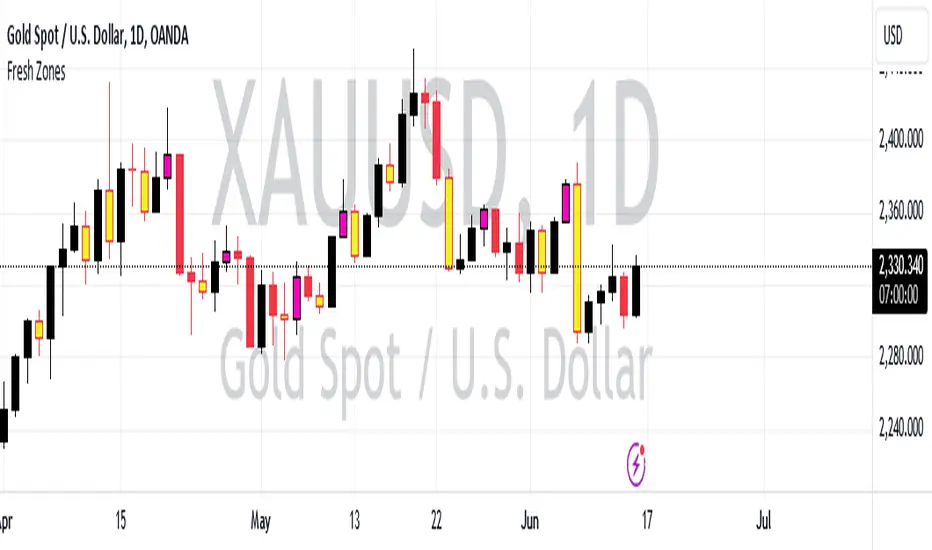
Fresh Zones The indicator is named "Fresh Zones"
Bullish Fresh Zone:
- This part looks for a specific pattern in the price movement that indicates a potential bullish (upward) trend.
- It checks if the current bar's low price is higher than the previous bar's opening price.
- It also checks if the previous bar's closing price was higher than its opening price.
- Additionally, it checks if the bar before the previous one had a closing price lower than its opening price.
- If all these conditions are met, it identifies a bullish fresh zone.
Bearish Fresh Zone:
- This part looks for a specific pattern in the price movement that indicates a potential bearish (downward) trend.
- It checks if the current bar's high price is lower than the previous bar's opening price.
- It also checks if the previous bar's closing price was lower than its opening price.
- Additionally, it checks if the bar before the previous one had a closing price higher than its opening price.
- If all these conditions are met, it identifies a bearish fresh zone.
Color Coding:
- When a bullish fresh zone is identified, it colors the candlestick from two bars ago with a specific yellowish color (`color.rgb(240, 243, 33)`).
- When a bearish fresh zone is identified, it colors the candlestick from two bars ago with a specific pink color (`color.rgb(255, 0, 191)`).
Alert:
- The script creates an alert condition.
- If either a bullish or bearish fresh zone pattern appears, it triggers an alert with the message "A Fresh zone has appeared!".
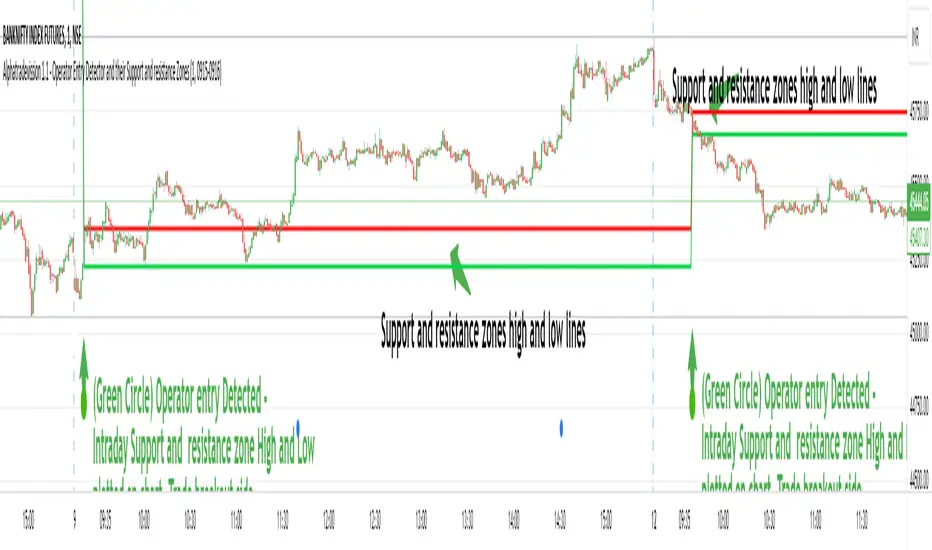
Operator Entry Detector and their Support and resistance ZonesIntroduction:
The indicator is designed to detect specific market conditions related to operator entries and identify support and resistance zones.
Developed by Sarangdhar, this version is labeled as Alphatradevission 1.1
Key Features:-
Utilizes Heavy Volume Change to identify operator entry signals.
Displays support and resistance zones based on the Specific Calculated Volume Length values.
Highlights potential trend reversal or continuation zones using specific chart patterns and Specific Calculated Volume Change Length values
Settings:
Option to hide/show lines and labels for a cleaner chart presentation.
Defines regular trading hours and considers the 9:15 AM candle for analysis.
Visual Elements:
Uses various shapes and colors to represent different market scenarios:
Circles for the 9:15 AM candle to Understand New Trading Session Started.
Triangles for Volume change signals.
Different colors for distinct VC levels.
Green diamonds with numbering for identified trend starter signals.
Signals and Zones:
Detects specific VC values to signal potential trend starters, small sharks, and big sharks.
Labels support and resistance zones based on the 9:15 AM candle and VC signals.
Highlights reversal and trend continuation zones based on Specific VC length given in script.
Customization:
Traders can adjust input parameters to suit their preferred timeframes and market conditions.
The option to hide/show lines and labels allows users to customize the indicator display.
How users can make profit using this script ?
Usage Tips: Chart 1 min time frame
Users may consider potential trend changes or continuations based on identified VC signals.
Support and resistance zones can be utilized for setting stop-loss or take-profit levels.
1. That zone will act as support and resistance through out day.
5. Trade Breakout direction of that range. As range break market trend start in that direction.
6. If Candle range High break - traders view must be buying the stock with stoploss just below the candle range and vice versa.
Note :-
1. Avoid Fake breakout of candle range . take entry after breakout confirmation. You can take entry after retest to that candle range.
Giving below example of reversal and trend continuation zones high low line by hiding intraday Support and resistance zone lines you can costomize it as per use,
Traders Dynamic Index(RSI) w/ Bull&Bear Control ZonesMomentum (RSI) is one of the most commonly used indicators for trading, but the vast majority of traders who use it, simply apply it as an oscillator to measure overbought and oversold conditions. However, momentum is much more complex than that and using a basic RSI fails to highlight these complexities.
What this highlights are some of the areas/zones that many people may not even know about or are unaware what the RSI can actually reveal about a particular trend.
What this indicator is showing:
Fast moving RSI (Green) - 1 period
Slow moving RSI (Red) - 9 period
Bollinger Bands
Relative Strength: 1 - 100
Bearish Control Zone: 30(Below) - 45
Bullish Control Zone: 60 - 70 (Above)
How this identifies trends:
Bear Market(Bearish Control Zone):
-Support: 20(Below) - 30
-Resistance: 55 - 65
-Momentum will test resistance but will fail to hold support at 50
Bull Market(Bullish Control Zone):
-Support: 45 - 50
-Resistance: 80 - 90(Above)
-Momentum will test support but will not continue past the 45 support
How this identifies reversals:
If a market is bullish, but loses support at 45 and tests 30, it has begun reversal. If a market is bearish, but breaks 60 and tests 70, it has begun reversal.
-A bull market reversal is confirmed if it finds resistance at 60 after testing bearish support
-A bear market reversal is confirmed if it finds support at 50 after testing bullish resistance
Slow & Fast RSI w/ Boll Bands:
-The Slow and Fast RSI crossovers will act as Intermediate trends within the Macro trend - Fast crosses slow, bullish. Slow cross fast, bearish.
-Use in confluence with the Macro trend.
-While under Bearish Control, the Slow RSI will act as resistance for the Fast RSI.
-While under Bullish Control, the Slow RSI will act as support for the Fast RSI.
-The two will have an impulsive crossover when the Macro trend reverses.
-The Bollinger Bands will act as a volatility gauge for potential approaching tests of Support & Resistances. (Expansions & Contractions)
This is an analog of TDIGM (GoldMinds)
-Added Bullish/Bearish Control Zones.
-Changed Fast RSI to Green and Slow RSI to Red.

LiquidTradeRoom Auto Zones1. Finds Swing Highs and Swing Lows
It looks for pivot highs and lows using a user-chosen length.
Swing highs = possible supply
Swing lows = possible demand
These swings help the indicator understand the market structure.
2. Automatically Creates Supply & Demand Zones
When a new swing high or low is found:
🔴 Supply zone (after a swing high)
Draws a box above price
Slight buffer added using ATR
Extends the box forward to the right
🔵 Demand zone (after a swing low)
Draws a box below price
ATR buffer
Extends the box to the right
The boxes act as “areas price may react from.”
3. Stops Overlapping Zones
Before creating a new zone, the script checks:
If the new zone is too close to an existing one → it does not draw it.
This avoids clutter & duplicate zones.
4. Draws POI Labels
Within each supply/demand box it draws a small “POI” label showing the midpoint.
This marks the "most important part" of the zone.
5. Marks BOS (Break of Structure) Automatically
If price breaks above a supply zone top or below a demand zone bottom, the indicator:
Converts that zone into a BOS marker
Draws a line showing where structure was broken
Removes the old supply/demand box
This helps identify trend changes.
6. Extends Active Zones
Existing zones are constantly pushed further right so they stay visible on the chart.
7. Optional Zig-Zag
The script can draw a zig-zag line to help visualize:
Higher highs
Higher lows
Lower highs
Lower lows
But you can turn it on or off.
8. Optional Swing Labels
If enabled, it prints:
HH (Higher High)
HL (Higher Low)
LH (Lower High)
LL (Lower Low)
This visually shows market structure.
✨ In summary
This script automatically builds a full “Smart Money Concepts” structure map including:
✔ Swing points
✔ Supply & demand zones
✔ POIs
✔ Break of structure (BOS)
✔ Zig-zag structure
✔ Market structure labels (HH, HL, LH, LL)

Daily Range Zones: PDH/PDL with SL/TPThis indicator automatically plots the previous day's High and Low levels and projects dynamic Stop Loss (SL) and Take Profit (TP) zones based on the daily range percentage.
It is designed for traders focusing on daily range breakouts or mean reversion strategies around the Previous Day High (PDH) and Previous Day Low (PDL).
Key Features:
Level 0 & 1: Visualizes the exact High and Low of the reference timeframe (Daily).
Inner Zone (Orange): Calculated inside the range. Acts as a buffer for Stop Loss placement or entry zones for mean reversion.
Outer Zone (Purple): Calculated outside the range (extension). Acts as a primary Take Profit target for breakout trades.
Settings:
Fully customizable percentages for inner and outer zones.
Option to toggle between current day or previous day data.
Works on any timeframe (intraday charts recommended).

Advanced Market Profile & S/R Zones (Pro)Advanced Market Profile & S/R Zones
This indicator brings professional Auction Market Theory to your chart using a custom rolling Volume Profile algorithm. Unlike standard profiles that remain fixed, this tool dynamically calculates the "Fair Value" of the asset based on your specific lookback period (e.g., the last 100 bars).
It automatically highlights the Point of Control (POC), Value Area (VA), and suggests statistical Discount (Buy) and Premium (Sell) zones.
Key Features
Volume Splitting Algorithm:
Most basic scripts dump the entire volume of a candle into a single price point (the average). This script splits the volume across the candle's entire High-Low range. This results in a much smoother, higher-resolution bell curve that accurately reflects price action, especially on higher timeframes like Monthly charts.
Auto-generated Zones:
Green Zone (Discount): Prices below the Value Area Low (VAL). Statistically "cheap."
Red Zone (Premium): Prices above the Value Area High (VAH). Statistically "expensive."
Real-Time Dashboard:
A built-in panel displays the exact price levels for the POC, VAH, and VAL for precise limit order placement, along with the current Market Trend.
How to Use
For Intraday (Day Trading):
Settings: Set Lookback to 100 - 300.
Strategy: Watch for price to open outside the Value Area. If price breaks back inside the Value Area, target the POC (Red Line).
For Macro (Monthly/Weekly Charts):
Settings: Set Lookback to 12 (1 Year) or 60 (5 Years).
Strategy: Identify multi-year structural support. When a monthly candle enters the Green Discount Zone of a 5-year profile, it is often a high-probability institutional entry point.
Trend Logic
The Dashboard indicates trend based on price location relative to value:
Strong Bullish: Price is accepted ABOVE the Value Area.
Strong Bearish: Price is accepted BELOW the Value Area.
Neutral / In VA: Price is chopping inside the Value Area.
Disclaimer
This is a "Rolling Profile." It calculates the profile based on the current lookback window relative to the latest bar. As new bars form, the lookback window shifts, and the profile updates to reflect the new dataset.

Supertrend Dual-Zone Channel V2**Supertrend Dual-Zone Channel V2**
Advanced Supertrend with Dual-Zone Visualization, Breakout Counter, and Dynamic Labels
A powerful upgrade to the classic Supertrend indicator that displays two distinct zones:
• Bullish Channel (green): Active when price is above the Supertrend line
• Bearish Channel (red): Active when price is below the Supertrend line
Key Features
• Dual-Zone Fill System: Clearly separates bullish and bearish regimes with semi-transparent channel fills for instant trend context.
• Reverse Tracking Lines: Shows the opposite-direction Supertrend band (faint green/red lines) to highlight potential reversal zones.
• Automatic Breakout Counter: Counts consecutive breaks into the opposite tracking band.
- Green labels below bars: Bullish breakouts (price closes above bearish tracking line while in uptrend)
- Red labels above bars: Bearish breakouts (price closes below bullish tracking line while in downtrend)
• Clean Label Management: Uses arrays to store labels with tooltips showing breakout sequence number.
• Mid-Channel Reference: Invisible midline based on (high + low)/2 for internal fill logic (not plotted).
How to Use
• Strong Trend Confirmation: Price staying within its colored channel = healthy trend.
• Pullback Entries: Look for price touching the faint reverse tracking line without breaking it.
• Breakout Signals: Labeled breakouts (1st, 2nd, 3rd...) often precede trend exhaustion or acceleration.
• Works on all timeframes and assets.
Inputs
• Factor (default: 3.0) – Sensitivity of the Supertrend bands
• ATR Period (default: 10) – Lookback period for volatility calculation
Visuals
• Thick green/red line: Current active Supertrend
• Faint opposite-color line: Reverse tracking band
• Light green/red fills: Bullish/Bearish zones
• Numbered labels: Sequential breakout counter
Fully optimized with max_lines_count=500 and max_labels_count=500.
Clean, lightweight, and highly readable on chart.
Version 2 – Improved labeling, better zone separation, and smarter counter reset on trend change.
Perfect for trend-following, pullback trading, and spotting potential reversals.
Happy trading!
====================================================================================
**Supertrend 双区通道 V2**
高级超级趋势指标:双色通道可视化 + 突破计数器 + 动态标签
经典 Supertrend 的强力升级版,通过 **双区通道** 直观区分多空状态:
• 多头通道(绿色):价格位于 Supertrend 上方时激活
• 空头通道(红色):价格位于 Supertrend 下方时激活
### 核心功能
• 双区填充系统:半透明通道填色,一眼分辨当前多空主导区域
• 反向轨道线:显示对立方向的 Supertrend 带(淡绿/淡红虚线),清晰标记潜在反转区域
• 自动突破计数器:统计价格连续突破反向轨道的行为
- 绿色标签(K线下方):多头突破(多头趋势中收盘突破空头轨道)
- 红色标签(K线上方):空头突破(空头趋势中收盘跌破多头轨道)
• 智能标签管理:使用数组存储标签,带工具提示显示突破序号
• 通道中轴:基于 (high + low)/2 的隐形中线,仅用于填充逻辑(不显示)
### 使用方法
• 趋势健康:价格始终停留在同色通道内 = 强势趋势
• 回调入场:价格触及淡色反向轨道但未突破 = 优质回调机会
• 突破信号:连续编号突破(第1次、第2次…),根据不同品种设定自定义的突破次数,btc通常五次突破后才会衰竭。
• 适用于所有周期、所有品种
### 输入参数
• 倍数(默认 3.0):控制 Supertrend 带的灵敏度
• ATR周期(默认 10):波动率计算周期
### 视觉元素
• 粗实线(绿/红):当前生效的 Supertrend 主线
• 细虚线(淡绿/淡红):反向轨道线
• 浅色填充:多头/空头通道区域
• 编号标签:突破序号(从0开始计数)
**V2 版升级**:优化标签逻辑、更好区域分隔、趋势切换时自动归零计数器。
祝交易顺利!

Pure Price Zone Flow🔎 What this indicator is
It’s a price-action-based zone indicator. Unlike moving average systems, this one relies only on:
1. Swing Highs & Swing Lows → The highest and lowest points within a recent lookback period (like "mini support & resistance").
2. ATR (Average True Range) → A volatility measure that expands the zone, making it more adaptive to different market conditions.
3. Breakouts & Retests → When price breaks above a swing high (bullish) or below a swing low (bearish), the indicator marks it and highlights the new trend.
👉 The goal is to spot clean structure shifts and define clear trend zones where traders can position themselves.
________________________________________
⚙️ How it is calculated
1. Swing High & Swing Low
o We look back len candles (default 20).
o Find the highest high (swingHigh) and the lowest low (swingLow) in that window.
o This forms the price range zone.
2. ATR Expansion
o We calculate ATR over the same len.
o Add/subtract it (multiplied by atrMult) to the zone edges to expand them.
o This ensures the zones breathe with volatility (tight in quiet markets, wide in choppy ones).
3. Mid-Zone
o Simply the average of swingHigh and swingLow.
o If price is above mid → bullish bias.
o If below mid → bearish bias.
o This gives us the trend color for candles.
4. Breakouts
o If the close crosses above swingHigh, we mark a bullish breakout with a label.
o If the close crosses below swingLow, we mark a bearish breakdown.
________________________________________
📊 How it helps traders
This indicator helps by:
1. Identifying Structure Shifts
o Many traders watch swing highs/lows for breakouts or reversals.
o This automates the process and visually confirms when structure is broken.
2. Dynamic Zone Trading
o Instead of fixed support/resistance, the ATR expansion adapts to volatility.
o This avoids false signals in high-volatility conditions.
3. Trend Bias at a Glance
o Candle coloring instantly tells you whether price is in bullish or bearish territory relative to the mid-zone.
4. Breakout Confirmation
o The labels show when a breakout has occurred, so traders can react quickly (e.g., enter with trend, wait for retest, or avoid fading moves).
________________________________________
🌍 Markets it works best in
• Crypto (Bitcoin, Ethereum, etc.): Very effective since crypto is breakout-driven and respects swing levels.
• Forex: Good for volatility-adaptive structure analysis, especially in trending pairs.
• Indices (SPX, NASDAQ, DAX, NIFTY): Useful for breakout trading during session opens or key news events.
• Commodities (Gold, Oil, Silver): Works well to define intraday ranges and breakout levels.
⚠️ Less useful in low-volatility, mean-reverting assets (like some penny stocks or sideways ranges), because breakouts may be rare or fake.
________________________________________
💡 How it adds value
• Strips away unnecessary complexity (no lagging averages).
• Focuses directly on what price is doing structurally.
• Adaptive → works across different markets & timeframes.
• Easy visualization → zones, trend coloring, breakout markers.
• Helps traders trade with the flow of the market, instead of guessing tops/bottoms.
________________________________________
👉 In short:
This indicator turns raw price action into clear, actionable zones.
It highlights when the market shifts from balance to breakout, so traders can align with momentum rather than fighting it.

Recovery Zone Hedging [Starbots]Recovery Zone Hedging Strategy — Advanced Adaptive Hedge Recovery System
This strategy introduces an innovative zone-based hedge recovery approach tailored to TradingView’s single-direction trading model. Designed for serious traders and professionals, it combines multiple technical indicators with dynamic position sizing and adaptive take-profit mechanisms to manage drawdowns and maximize recovery efficiency.
How Recovery Zones Are Calculated
The strategy defines recovery zones as a configurable percentage distance from the last executed trade price. This percentage can be adjusted to suit different market volatility environments — wider zones for volatile assets, tighter zones for stable ones. When price moves into a recovery zone against the open position, the strategy places a hedge trade in the opposite direction to help recoup losses.
Dynamic Take-Profit Calculation
Take-profit targets are not fixed. Instead, they increase dynamically based on any accumulated losses from previous hedge trades. For example, if your initial target is 2%, but you have a $5 loss from prior hedges, the next take-profit target adjusts upward to cover both the loss and your profit goal, ensuring the entire hedge sequence closes in net profit.
Originality & Value
Unlike traditional hedging or recovery scripts that rely on static stop losses and fixed trade sizing, this strategy offers:
- Dynamic Hedge Entry Zones: Uses configurable percentage-based recovery zones that adapt to price volatility, allowing precise placement of hedge trades at meaningful reversal levels.
- Multi-Indicator Signal Fusion: Integrates MACD and Directional Movement Index (DMI) signals to confirm trade entries, improving signal accuracy and reducing false triggers.
- Exponential Position Sizing: Each hedge trade’s size grows exponentially using a customizable multiplier, accelerating loss recovery while carefully balancing capital usage.
- Adaptive Take-Profit Logic: The take-profit target adjusts dynamically based on accumulated losses and profit margins, ensuring that the entire hedge sequence closes with a net gain.
- Capital Usage Monitoring: A built-in dashboard tracks real-time equity consumption, preventing over-leveraging by highlighting critical capital thresholds.
- Fail-Safe Exit Mechanism: An optional forced exit beyond the last hedge zone protects capital in extreme market scenarios.
This strategy’s layered design and adaptive mechanisms provide a unique and powerful tool for traders seeking robust recovery systems beyond standard hedge or martingale methods.
How Components Work Together
- Entry Signals: The script listens for MACD line crossovers and DMI directional crosses to open an initial trade.
- Recovery Zones: If the market moves against the initial position, the strategy calculates a recovery zone a set percentage away and places a hedge trade in the opposite direction.
- Position Scaling: Each subsequent hedge trade increases in size exponentially according to the hedge multiplier, designed to recover all previous losses plus a profit.
- Take-Profit Target: Rather than a fixed target, the TP level is dynamically calculated considering current drawdown and desired profit margin, ensuring the entire hedge sequence closes profitably.
- Cycle Management: Trades alternate direction following the recovery zones until profit is realized or a maximum hedge count is reached. If needed, a forced stop-out limits risk exposure.
Key Benefits for Professional Traders
- Enhanced Risk Management: Real-time capital usage visualization helps maintain safe exposure levels.
- Strategic Hedge Recovery: The adaptive recovery zones and exponential sizing accelerate loss recoupment more efficiently than traditional fixed-step systems.
- Multi-Indicator Confirmation: Combining MACD and DMI reduces false signals and improves hedge timing accuracy.
- Versatility: Suitable for multiple timeframes and asset classes with adjustable parameters.
- Comprehensive Visuals: On-chart recovery zones, hedge levels, dynamic take-profits, and equity usage tables enable informed decision-making.
Recommended Settings & Use Cases
- Initial Position Size: 0.1–1% of account equity
- Recovery Zone Distance: 2–5% price movement
- Hedge Multiplier: 1.5–1.85x growth per hedge step
- Max Hedge Steps: 5–10 for controlled risk exposure
Ideal for trending markets where price retracements create viable recovery opportunities. Use caution in sideways markets to avoid extended hedge sequences.
Important Notes
- TradingView’s single-direction model means hedging is simulated via alternating trades.
- Position sizes grow rapidly—proper parameter tuning is essential to avoid over-leveraging.
This script is designed primarily for professional traders seeking an advanced, automated hedge recovery framework, offering superior capital efficiency and loss management.

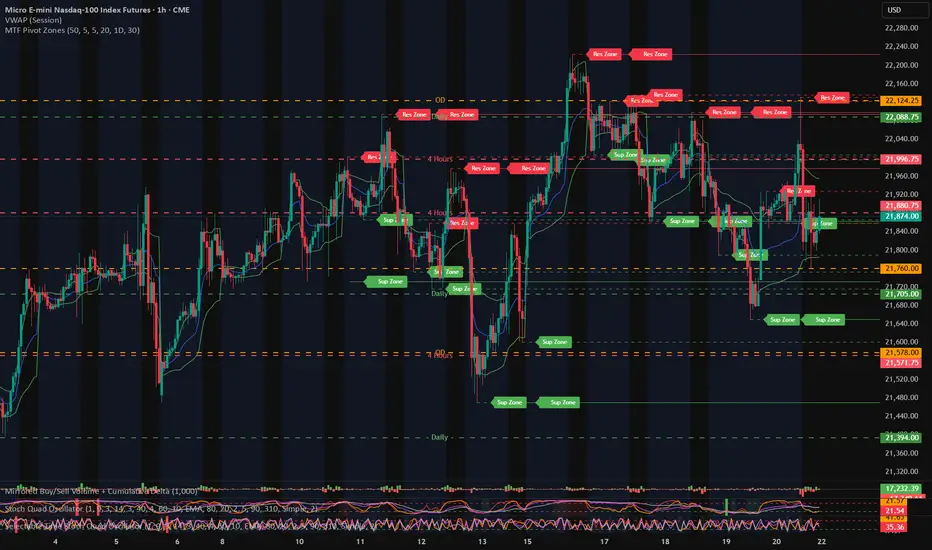
MTF Pivot Zones
## 📘 **User Guide: MTF Pivot Zones**
**Script Name:** MTF Pivot Zones
Multi Time Frame Pivot
---
### 🧭 Overview
**MTF Pivot Zones** is a multi-timeframe analysis tool that detects and merges swing highs and lows across four key timeframes:
**Weekly, Daily, 4H, and 1H**.
It plots clear **Support** and **Resistance** zones on the chart based on pivot point clustering. Zones are displayed as dashed lines, color-coded by type.
---
### ⚙️ Settings
| Input Name | Description |
| ---------------------- | --------------------------------------------------------------------- |
| `Lookback Bars Per TF` | Number of bars to scan for pivot highs/lows per timeframe |
| `Pivot Left Bars` | Number of bars to the left required to confirm a pivot |
| `Pivot Right Bars` | Number of bars to the right required to confirm a pivot |
| `Merge Tolerance ($)` | Distance threshold in dollars to merge nearby pivot levels into zones |
| `Show TF Labels` | Toggle the text label next to each zone (e.g., “Res Zone”) |
---
### 🛠️ How It Works
1. **Pivot Detection**
The script scans each timeframe using `ta.pivothigh()` and `ta.pivotlow()`.
2. **Zone Merging**
Pivot levels within the specified `Merge Tolerance` are averaged and treated as a single zone.
3. **Zone Plotting**
* **Red dashed lines** = Resistance Zones
* **Green dashed lines** = Support Zones
* Optional labels show zone type if `Show TF Labels` is enabled
---
### 📈 Usage Tips
* Use zones to guide entries, exits, and stop-loss placement.
* Combine with trend tools or candlestick confirmation near zones.
* Adjust merge tolerance to match instrument volatility and timeframe.
---
Let me know if you want this formatted for **TradingView publishing**, or included in a `study()` title block comment.
Supply/Demand Zones + Engulfment-based ExecutionSupply/Demand Zones + Engulfment-Based Execution
Strategy Overview
This strategy combines institutional trading concepts—supply/demand zones and engulfing candle patterns—to generate high-probability long and short trade setups. The system uses aggregated price action to identify potential reversal zones and confirms entries with engulfing candle patterns, ensuring trades are only taken when market structure shows commitment in the direction of the trade.
Core Concepts
• Supply & Demand Zones: These are automatically detected by analyzing aggregated bullish and bearish candle structures over user-defined intervals. Supply zones are formed after bearish continuation patterns; demand zones appear after bullish continuation patterns.
• Engulfing Entries: Once price enters a zone, the strategy waits for a bullish engulfing pattern (in a demand zone) or a bearish engulfing pattern (in a supply zone) before executing a trade. This adds confirmation and reduces false signals.
• Risk Management: Stop-loss is placed at the low (for long trades) or high (for short trades) of the engulfed candle. Take-profit can be calculated using a fixed R-multiple (risk-to-reward ratio) or a user-defined target price.
Key Features
Fully customizable aggregation factor for zone detection
Visual zone boxes, entry/SL/TP boxes, and engulfing pattern labels
Optional removal of mitigated zones for cleaner charting
Configurable trade mode (Long only, Short only, or Both)
Support for trading sessions and date filtering
Alerts for price entering supply or demand zones
How to Use
Select Aggregation Factor: Choose how many candles to group together for identifying key zones (e.g., 4x timeframe).
Enable Zones: Turn on supply and/or demand zones as needed.
Set Execution Parameters:
– Choose R-multiple (e.g., 2:1 risk-reward)
– Or use a fixed take-profit price
Define Trade Time Window:
– Set the date and time ranges to restrict execution
– Use Start Hour and End Hour to limit trades to specific sessions (e.g., London/New York)
Run on Desired Timeframe: Typically used on 15m–4H charts, depending on your strategy and the asset’s volatility.
Ideal For
• Traders using Smart Money Concepts (SMC)
• Those who value high-confluence entries
• Intraday to swing traders looking for structure-based automation
⚠️ Important Notes
• The strategy requires engulfing confirmation within the zone to enter a position.
• This script does not repaint and executes trades on a bar close basis.
• Backtest results may vary based on session filters and aggregation factor.
© Attribution
This strategy was developed by The_Forex_Steward and is licensed under the Mozilla Public License 2.0.
You are free to use, modify, and distribute it under the terms of that license.

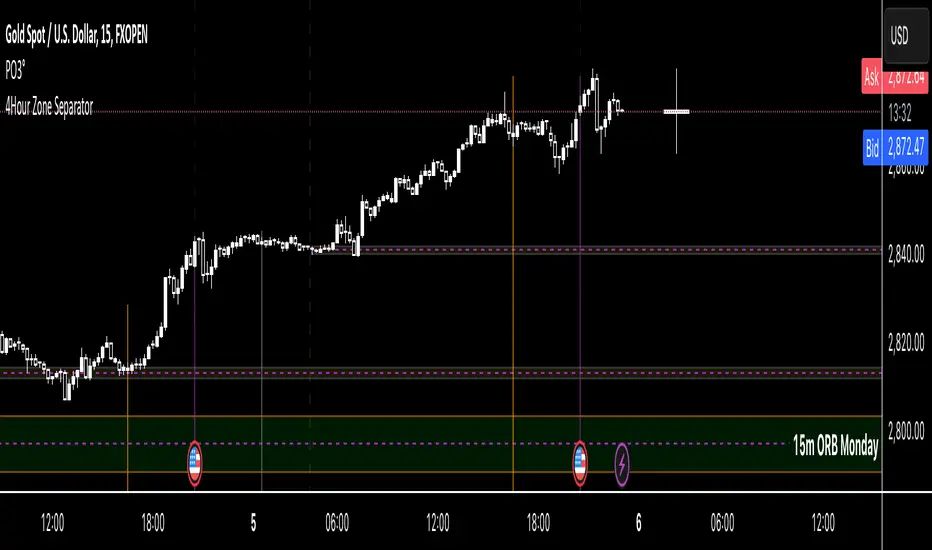
4Hour Zone SeparatorThis custom TradingView indicator draws vertical lines on your chart to visually separate the 4-hour trading zones within a single trading day. The indicator helps traders identify key time intervals throughout the day for better market analysis and decision-making.
Features:
• Time-Based Zones: The indicator divides the day into six distinct 4-hour periods, starting from midnight (00:00) and continuing every 4 hours. Each zone is marked by a vertical line on the chart.
• User Customization: You can toggle the visibility of the lines for each 4-hour period (00:00, 04:00, 08:00, 12:00, 16:00, 20:00) based on your preference. This allows you to focus on specific zones that matter most for your analysis.
• Line Styling Options: Choose from three different line styles — Solid, Dashed, or Dotted — and adjust the thickness to your desired preference.
• Dynamic Time Adjustment: The indicator automatically adjusts for the time zone, ensuring that the 00:00 timestamp reflects the correct start of the day based on your chart’s time zone.
How It Works:
1. The indicator starts by calculating the beginning of the day at 00:00, then it sequentially places vertical lines every 4 hours.
2. Each line is color-coded for easy identification, and the lines stretch from the highest to the lowest point on the chart for that range.
3. The lines are drawn only when the chart enters a new 4-hour zone.
This tool is especially useful for day traders who want to track price action during specific times of the day and make informed decisions based on market behavior within each 4-hour period.
MTF OB Supply Demand ZonesHello everyone,
This exceptional indicator provides you with visual representations of bullish and bearish order blocks or supply and demand zones across multiple timeframes. In simple terms, bullish order blocks are represented by a small red candle followed by a large red candle, while bearish order blocks are depicted as a small green candle followed by a large red candle. Supply and demand zones are drawn by using order blocks.
Features:
Display order blocks from up to three different timeframes.
Customize the maximum number of boxes shown and the colors of the zones.
Choose from three different modes: OB (Order Block), Extended OB, and Supply/Demand.
Mode Descriptions:
OB: Includes the body of the candle.
Extended OB: Encompasses the body and wick of the candle.
Supply/Demand: Covers the body, wick, and half the body of the large candle.
Usage:
Ensure that charts 2 and 3 are set to a higher timeframe. For modes 2 and 3, it’s recommended to reduce the maximum number of boxes shown. The zones or boxes are transparent, allowing for overlap. This feature aids in identifying reversal zones or confirmed zones. The more intense the color, the stronger the confirmation. If a green zone overlaps a red zone (or vice versa), it signifies a reversal zone.
Thank you for checking out this indicator!
---
Additional Information:
Order blocks refer to specific price areas where large market participants, such as institutional traders, have previously placed significant buy or sell orders. These clusters of orders can impact price movement, liquidity, and market sentiment.
Order blocks are a strategic approach to identifying key levels of support and resistance based on the behavior of institutional traders. These key levels are then utilized as entry or exit points for trades.
An order block is an area where there has been a large concentration of limit orders awaiting execution. These blocks are identified on a chart by observing previous price action and pinpointing areas where the price experienced significant movement or abrupt changes in direction.
Order blocks are used in the following popular trading philosophies:
Smart Money Concepts (SMC)
Inner Circle Trading (ICT)
Price Action
---
Credits to: @AGFXTRADING

Donchian MA Bands [LuxAlgo]The Donchian MA Bands script is a complete trend indicator derived from the popular Donchian channel indicator as well as various customizable moving averages to estimate trend direction and build support/resistance levels & zones.
🔶 USAGE
The indicator outputs various elements, the main ones being a lower dynamic zone (blue by default), an upper dynamic zone (in orange by default), and one support and resistance level/zones (red/green by default).
A prominent lower zone is indicative of an uptrend, while a prominent upper zone is indicative of a downtrend. These zones can be used as support/resistance as well.
Support/resistance zones and levels can be used using a breakout methodology or to determine price bounced if a level was tested multiple times.
The indicator contains various modes affecting the output of the indicator, described below.
🔹 Clouds
Clouds return one upper/lower dynamic zone and look/act similarly to a trailing stop. Price over the lower zone is indicative of an uptrend, and price under the upper zone is indicative of a downtrend.
🔹 Upper Band
The upper band mode returns a dynamic zone closer to prices during an uptrend, and farther away during a downtrend.
This band can act as a support during uptrends.
🔹 Lower Band
The lower band mode returns a dynamic zone closer to prices during an uptrend, and farther away during a downtrend.
This band can act as a resistance during downtrends.
🔹 Bands
Bands return both upper and lower zones, the zones are more apparent depending on the price trend direction, with uptrends being indicated by a more visible lower zone, and downtrends being indicated by a more visible upper zone.
Breakout dots are highlighted when price breakout the indicator displayed extremities, and can be indicative of a confirmed trend reversal.
These breakouts can be more effective for trend following during trending markets. Ranging markets might return breakouts highlighting the top/bottom.
🔶 DETAILS
The core of this script is the highest / lowest mean average (MA) value for a given number of bars back ( Donchian lines).
This is repeated a few times with the obtained values.
When Bands are chosen ( Style ) this will be repeated 1 more time.
The type of mean average can be customized ( Type MA ), as well as the number of bars back ( Length ).
Depending on the choice of bands ( Style ) the script will focus on certain area's of interest.
When the option Clouds , Upper band or Lower band is chosen, an extra feature, support/resistance (S/R), will be shown.
These color-filled areas are visible when there is a difference between the 2nd and 3rd highest/lowest values.
The lines/areas can be used for stop loss, entry, exit,...
You can set the type of MA and Length separately ( Settings -> S/R ).
If you don't need this feature, simply set Type ( Settings -> S/R ) -> NONE
The shape sometimes resembles triangles, indicating a potential direction
Default the average of the highest and lowest values is plotted (Style -> Mid Donchian)
This can act as potential support/resistance or visualization of the trend, the mean average is not plotted but can be (Style -> MA)
🔹 Note
When the option Bands is chosen, an indication is plotted when the closing price breaks above the highest band or breaks below the lower band. This isn't necessarily a buy/sell signal, it is merely a signal that these lines are broken.
Users should decide on their own how they use the bands/lines/areas as entry, exit, trailing stop, stop loss, profit taking,...
🔶 SETTINGS
🔹 Bands
Style: Clouds (default), Upper band, Lower band, Bands
Type MA: choose between SMA, EMA, RMA, HullMA, WMA, VWMA (default), DEMA, TEMA, NONE (off)
Length: Length of moving average and Donchian calculations (default 20)
Colour Bands
🔹 S/R (Support/Resistance, visible with Clouds, Upper band or Lower band)
Type MA: choose between SMA, EMA, RMA, HullMA, WMA, VWMA (default), DEMA, TEMA, NONE (off)
Length: Length of moving average and Donchian calculations (default 20)
Colour S/R
