Key Levels, Liquidity Zones & CC liteSyntropy Liquidity & Key Levels Pro — All-in-One Institutional Toolkit
The ultimate clean confluence tool used by serious ICT/SMC traders worldwide.
This single indicator combines three legendary components into one flawless, non-repainting dashboard:
1. Key Institutional Levels
• Monday Range (High / Low / Mid)
• Current & Previous Weekly Open + Range
• Current & Previous Monthly Open + Range
• Quarterly Open + Range
• Smart level merging (no duplicate lines)
• Right-anchored or standard display
• Fully customizable colors, styles & shorthand labels
2. Advanced Liquidity Zones
• Volume-strength filtered swing highs/lows
• Dynamic or fixed ATR-based liquidity pools
• Real-time "Liquidity Grab" detection with visual markers
• Clean boxes + extension lines
• Small dashboard showing current mode & zone count
3. 9 Logic – Clean Version)
• Classic 6–9 countdowns with modern styling
• Standard & Aggressive 13 signals
• Customizable shapes (labels, arrows, triangles, etc.)
• Buy signals marked with green check, Sell with red cross (clean & intuitive)
Why thousands of traders trust this version:
• Zero repainting – 100% reliable structure
• Institutional-grade clean aesthetics
• Works perfectly on Crypto, Forex, Stocks, Futures
• No lag, no clutter, maximum clarity
• All features fully customizable
This is not just another multi-tool.
This is the final confluence indicator most professional traders keep on their main chart 24/7.
Add to favorites. You won’t trade without it again.
Enjoy the edge,
Syntropy Labs
ابحث في النصوص البرمجية عن "zone"

3SD BB Exhaustion + Bias Zone Reversal🚀 Exciting Update!
I’m thrilled to announce the release of the Premium Bollinger Band with Bias Zone Reversal Indicator!
The Bias Zone is a simple yet powerful concept that helps identify potential turning points in price with remarkable precision.
When combined with the 3 Standard Deviation Bollinger Band extremes, this upgraded tool delivers high-probability reversal signals—helping traders anticipate trend shifts before they happen.
📈 Whether you’re trading reversals or managing entries around exhaustion zones, this indicator gives you a clearer edge with structured, multi-timeframe insights.

Aroon RSI Logic — Customizable + No-Trade RSI ZoneThis indicator — **“Aroon RSI Logic — Customizable + No-Trade RSI Zone”** — is designed to help traders identify high-probability turning points in the market by combining **trend momentum (Aroon)** with **relative strength dynamics (RSI)**, while also protecting against emotional or impulsive trading through structured filters and psychological safeguards.
---
### 🧠 **Concept Overview**
At its core, the system balances **trend confirmation** with **momentum moderation**. It seeks to enter trades only when technical alignment suggests both exhaustion of a recent move and early signs of a potential reversal — while filtering out market noise and emotionally driven trades in neutral or extreme conditions.
This design encourages **discipline**, **patience**, and **objectivity**, three of the most critical psychological traits of successful traders.
---
### 📊 **Core Components**
#### 1. **Aroon Structure Awareness**
The Aroon indicator measures how recently price has reached a new high or low within a specific period, reflecting trend strength and potential exhaustion.
* When **Aroon Down** approaches the predefined target level, it suggests the market has not made new lows for several bars — an early indication that bearish momentum may be fading.
* Conversely, when **Aroon Up** nears the target, bullish strength may be waning.
This mechanism trains the trader’s mind to **look for transitions** — moments when dominant sentiment begins to lose control.
---
#### 2. **RSI Momentum Confirmation**
The RSI (Relative Strength Index) and its smoothed version act as dual filters to confirm emotional extremes and trend shifts in momentum.
* When RSI significantly diverges from its smoothed version, it often reflects **emotional spikes** or **unsustainable acceleration**.
* The system only allows trades when the RSI difference remains within a defined limit, fostering entries during **balanced, rational phases** of the market rather than moments of panic or euphoria.
This approach supports **emotional discipline**, discouraging entries when crowd psychology dominates decision-making.
---
#### 3. **No-Trade RSI Zone**
A critical safeguard is the **“No-Trade Zone”**, defined by specific RSI thresholds.
When RSI is too low (oversold) or too high (overbought), traders are often tempted to act impulsively — either out of fear or greed.
By preventing entries during these phases, the indicator helps traders **avoid psychological traps** such as:
* Chasing reversals prematurely.
* Getting caught in continuation moves driven by crowd emotion.
It reinforces a mindset of **restraint** and **selective participation**.
---
#### 4. **Time-Based Discipline Filter**
The session filters allow trading only within designated market hours (for example, morning and afternoon sessions).
This enforces **structured activity**, reducing exposure to low-volume, erratic periods when decision fatigue or overtrading tendencies often arise.
It mirrors the behavior of professional traders who work within time-framed playbooks rather than emotional impulses.
---
### 🟢 **Buy Logic**
Buy opportunities arise when:
* Downward momentum (Aroon Down) weakens near the target level,
* RSI behavior supports balanced momentum or mild recovery, and
* Emotional extremes are absent.
This combination reflects a **calm, data-driven reversal environment**, ideal for contrarian but controlled entries.
---
### 🔴 **Sell Logic**
Sell signals appear when:
* Upward momentum (Aroon Up) softens around the target,
* RSI confirms slowing bullish pressure, and
* Market sentiment shows fatigue without panic.
It aligns with a **psychologically sound exit or shorting scenario**, avoiding reactionary decisions.
---
### 🧩 **Psychological Philosophy**
This tool isn’t just a signal generator — it’s a **trader’s behavioral framework**.
By combining structured logic, volatility filters, and emotional control zones, it helps cultivate:
* **Patience** to wait for qualified setups.
* **Confidence** to act when all conditions align.
* **Detachment** from impulsive market movements.
It transforms trading from a reactive habit into a **strategic execution process** rooted in logic and emotional balance.
---

BestCloudTrade — Zones (Auto Server)2new test indicator with auto updated zones new test indicator with auto updated zones new test indicator with auto updated zones new test indicator with auto updated zones new test indicator with auto updated zones new test indicator with auto updated zones new test indicator with auto updated zones

BestCloudTrade — Zones (Auto Server)testing new indicator with auto zones updatestesting new indicator with auto zones updatestesting new indicator with auto zones updatestesting new indicator with auto zones updatestesting new indicator with auto zones updatestesting new indicator with auto zones updatestesting new indicator with auto zones updatestesting new indicator with auto zones updatestesting new indicator with auto zones updatestesting new indicator with auto zones updatestesting new indicator with auto zones updatestesting new indicator with auto zones updatestesting new indicator with auto zones updates

HPZ — 4H Sell Zones (Ultra High Quality)Only finds sell setups.
Only shows overlaps between 4H Fair Value Gaps and Bearish Order Blocks.
Filters out small gaps or candles with too little momentum.
Displays a red box(HPZ) only when overlap is valid.
Optionally shows a “HPZ sell” label when price enters the zone.
Includes tiny swing markers for visual reference.

HPZ — 4H Buy Zones (Ultra High Quality)Only finds BUY setups.
Only shows overlaps between 4H Fair Value Gaps and Bullish Order Blocks.
Filters out small gaps or candles with too little momentum.
Displays a green box (HPZ) only when overlap is valid.
Optionally shows a “HPZ BUY” label when price enters the zone.
Includes tiny swing markers for visual reference.
Macias Golden ZoneThe Macias Golden Zone indicator automatically detects the most recent pivot leg and draws the key Fibonacci retracement band between 0.618 – 0.790, with the 0.706 midline highlighted.
🔑 Features:
• Auto-detects swing legs from pivot highs/lows
• Shaded Golden Zone for easy visualization of prime reaction areas
• Optional 0.706 midline for sniper entries
• Optional 0.079 retrace line for deeper confluence
• Works with wicks (High/Low) or closes
📈 Use it to identify high-probability pullback zones where price often reacts during trending moves.
⚠️ This tool is for educational purposes only. Not financial advice. Always manage risk.
From Christopher Macias and the Golden zone family

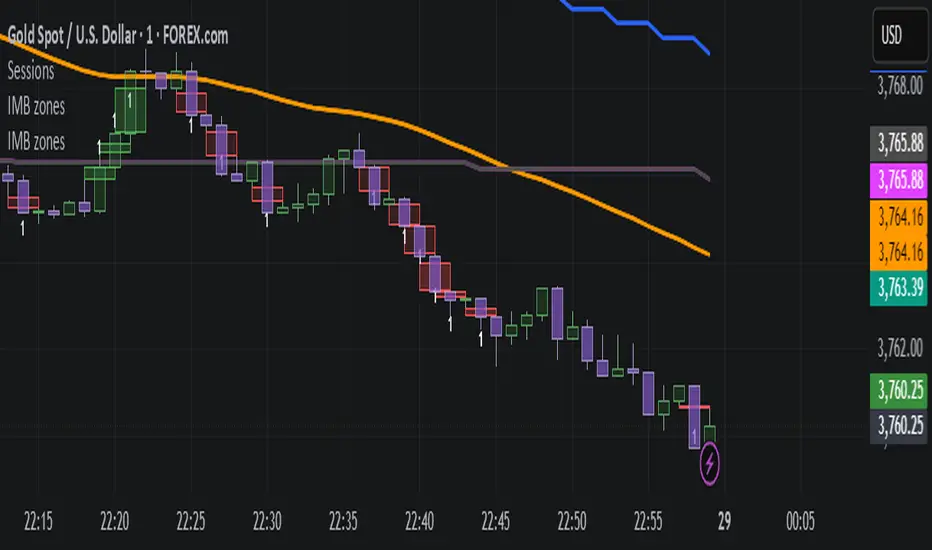
IMB zones, alerts, 8 EMAs, DO lvlThis indicator was created to be a combined indicator for those who use DO levels, IMBs, and EMAs in their daily trading, helping them by providing a script that allows them to customize these indicators to their liking.
Here you can set the IMBs, DO levels, and EMAs. Its special feature is that it uses alerts to indicate which IMB zones have been created, along with the invalidation line for the new potential IMB.
The program always calculates the Daily Opening (DO) level from the opening of the broker, and you can set how many hours the line should be drawn.
Help for use:
There are 3 types of alerts:
- Use the "Bullish IMB formed" alert if you are looking for Bull IMBs.
- Use the "Bearish IMB formed" alert if you are looking for Bear IMBs.
- Use the "Either IMB" alert if you are looking for Bull and Bear IMBs.
Tip: Set the alert type "Once per bar close" if you do not want to set new alerts after an IMB is formed.
IMBs:
- Customizable IMB quantity (1-500 pcs)
- Zone colors and borders can be customized
- Potential IMB line can be customized
EMAs:
- You can set and customize 8 EMA lengths
- Only the current and higher timeframe EMAs are displayed
Daily Open Level:
- Displays today's Daily Open level
- Note: The DO level does not work in Replay mode
Last OFR:
"Show True OFR" checkbox added.
It displays the latest OFR, and hides the old ones.
NX - ICT Kill ZonesThis indicator highlights the three main ICT Kill Zones — Asian, London, and New York — directly on your chart using New York time (UTC‑4 with automatic DST adjustment).
Each zone is color‑coded for quick visual reference and only appears on intraday timeframes of 1 hour or less. The tool helps traders quickly identify high‑probability trading windows aligned with institutional market activity.

ICT Silver Bullet Zones (All Sessions, Custom Labels)CT Silver Bullet Zones
This indicator is designed for traders who follow the ICT *Silver Bullet* concept.
It automatically marks the **Silver Bullet window** (10:00–11:00 by default) across the **London, New York AM, New York PM, and Asia sessions**, with customizable settings for each session.
### Features:
* Separate adjustable time windows for **London, NY AM, NY PM, and Asia Silver Bullet sessions**.
* Colored session boxes with individual **opacity controls**.
* **Session labels placed at the top** of each zone, with customizable text size, color, and background opacity.
* Works on all timeframes and highlights only the Silver Bullet trading windows.
This tool is meant to help traders quickly identify ICT Silver Bullet opportunities in all major sessions without manual plotting.

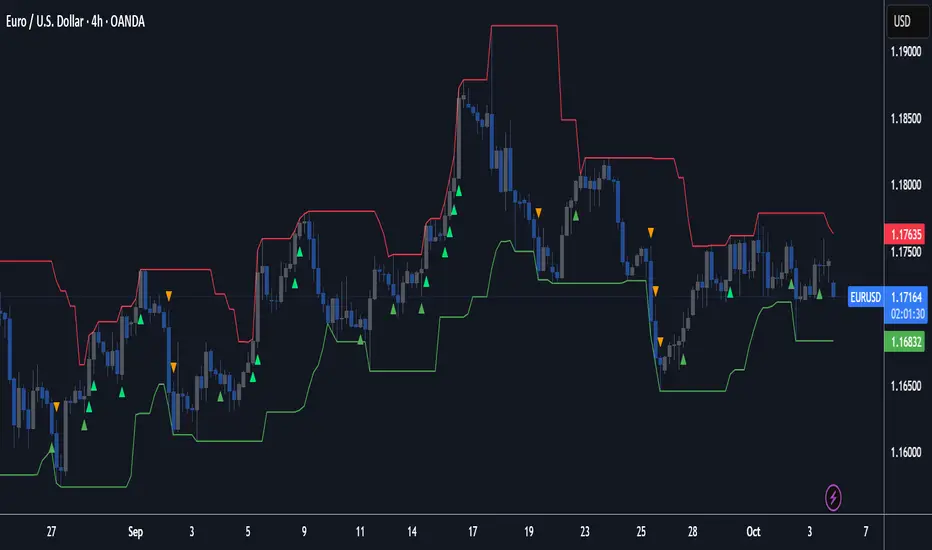
Fibonacci Zone + EMA RibbonThis script combines two well-known concepts into a single indicator: the Fibonacci Zone and the EMA Ribbon.
The Fibonacci Zone highlights potential support and resistance levels derived from recent price ranges, helping traders identify key breakout or reversal areas.
The EMA Ribbon overlays multiple exponential moving averages, providing a clear visual representation of market trend and momentum.
Together, these two tools allow traders to assess both dynamic support/resistance and trend direction at a glance, making it easier to spot confluence zones and high-probability trading opportunities.
This indicator can be effectively applied on shorter timeframes such as 5m, 15m, or 30m for active trading.
For additional confirmation of medium- to long-term trend direction, it is recommended to complement it with the 20-period SMA from the 4H timeframe.

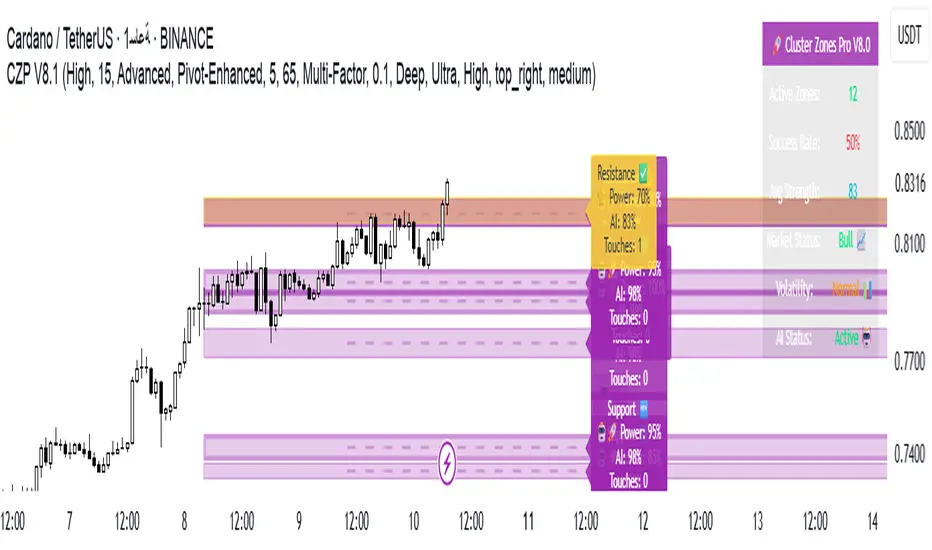
🚀 Cluster Zones Pro V8.0 - Advanced Edition📊 CLUSTER ZONES PRO V8.0 - OPTIMIZED SMART ZONE DETECTION SYSTEM
// ═══════════════════════════════════════════════════════════════════════════════════════════
// This version was developed based on comprehensive evaluation and unified development plan
// Developed based on comprehensive evaluation and unified development plan
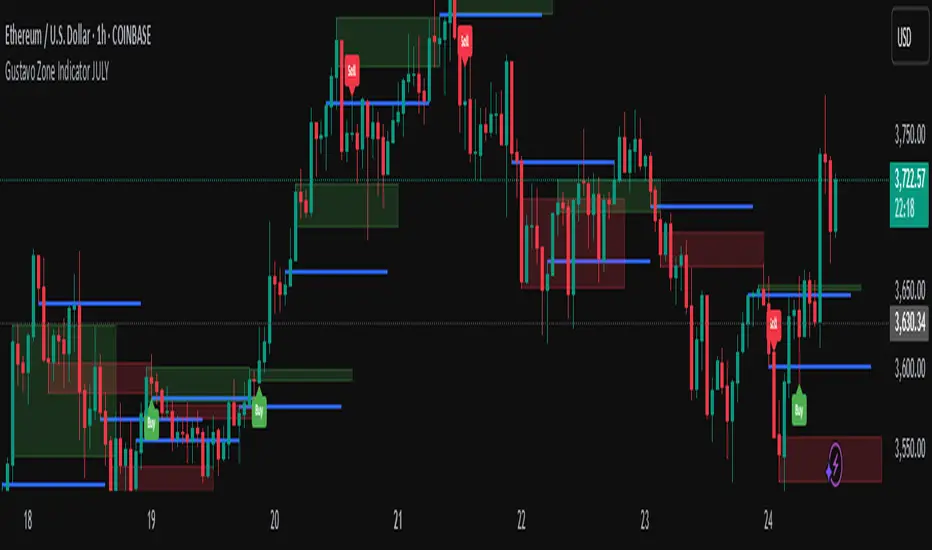
Gustavo Zone Indicator JULYThis indicator watches for runs of at least three consecutive green (or red) candles followed by an opposite-color candle, then marks that reversal zone by drawing a rectangle from the wicks of the first two run candles. It optionally plots a horizontal “target” line at the wick of the third run candle. While the zone is active, if three bars in a row close beyond both the zone boundary and the target line, it issues a customizable “Sell” label above the bar (after bullish runs) or a “Buy” label below the bar (after bearish runs). All colors, text labels, sizes, offsets, and toggles for the zones, lines, and signals can be adjusted in the input settings.
Auto Fib Extension with alert (golden rentry zone)Ideal for:
Traders who want an objective, auto-updating Fibonacci framework to identify potential continuation, or reaction zones after significant highs. The “Golden zone” highlights an area of particular interest for bounces, reactions, or consolidations. Once, price renters the Golden zone, 40% of the time, it will lead to 1.68 and 2.68 levels, making 80 to 200% once all time high is broken!!
This script automatically detects major swing points (all-time high and following swing low) using the last 1 year or 6 months of data, then draws Fibonacci retracement and extension levels from the all-time high (ATH) down to the lowest low after that high.
What it does:
Detects All-Time High (ATH) within your chosen lookback window (default: 1 year, falls back to 6 months if insufficient bars).
Finds the lowest low after ATH within the lookback period (ensures swing low always comes after swing high).
Plots Fibonacci retracement levels (0, 0.236, 0.382, 0.5, 0.618, 0.786, 1) from ATH to the swing low.
Issues an alert if price enters the Golden zone (between 0.236 and 0.382).

Naked Liquidation Zones - Multi-Leverage Risk VisualizationNaked Liquidation Zones - Multi-Leverage Risk Visualization
This indicator calculates and displays liquidation price levels for leveraged trading positions across up to 40 different leverage ratios, incorporating adjustable maintenance margin requirements for enhanced accuracy in risk assessment and position planning.
Mathematical Foundation
The indicator uses standard leveraged trading liquidation formulas with maintenance margin integration:
Long Position Liquidation Price = Entry Price × (1 - 1/Leverage + Maintenance Margin Rate)
Short Position Liquidation Price = Entry Price × (1 + 1/Leverage - Maintenance Margin Rate)
The calculation process involves two steps: first determining theoretical entry prices by reverse-calculating from a 100x liquidation reference point, then applying the liquidation formula across all selected leverage ratios. This approach ensures mathematical consistency and prevents calculation errors that can occur with direct price-to-liquidation conversions.
Core Functionality and Originality
Unlike basic liquidation calculators that show fixed leverage levels, this indicator provides comprehensive customization with 20 configurable long leverage levels and 20 configurable short leverage levels.
Each level can be individually enabled or disabled, allowing traders to focus on relevant leverage ratios for their specific trading strategies.
The maintenance margin system distinguishes this tool from simplified liquidation calculators. Users can adjust the maintenance margin percentage from 0.1% to 100% to match specific exchange requirements, providing more realistic liquidation estimates than zero-margin calculations commonly found in basic tools.
Reference Point System
Auto Mode: Automatically calculates liquidation levels from the current price or a specified bar offset. The "Auto Reference Offset" setting allows analysis of liquidation zones from historical price points, useful for back testing position scenarios.
Manual Mode: Enables precise coordinate selection with user-defined price and time reference points. This mode includes an optional vertical projection feature that creates localized liquidation zones around the reference point, ideal for analysing how specific historical events would have affected leveraged positions.
Visual Design and Interpretation
The indicator employs a color-coded system with varying line thickness and transparency based on leverage risk levels:
Low leverage (1x-5x): Light colours with higher transparency
Medium leverage (6x-15x): Moderate colours with medium transparency
High leverage (16x-30x): Darker colours with increased thickness
Extreme leverage (31x+): Dark colours with maximum thickness and low transparency
Price labels can be displayed alongside each liquidation level, showing the exact price and leverage ratio. Label positioning, size, and offset distance are fully customizable to prevent chart clutter while maintaining readability.
Practical Trading Applications
Position Size Planning: Visualize liquidation distances before entering trades to determine appropriate position sizes that align with risk management rules.
Multi-Scenario Analysis: Compare liquidation zones across different leverage ratios simultaneously to optimize risk-reward ratios for specific market conditions.
Historical Risk Assessment: Use manual mode to analyse how past price movements would have affected leveraged positions at key support or resistance levels.
Stop Loss Placement: Identify safe stop loss zones that account for leverage-specific liquidation risks, helping prevent premature position closure due to insufficient margin.
Market Structure Analysis: Understand where large liquidation clusters might occur during significant price movements, providing insight into potential support and resistance zones created by leveraged position clustering.
Configuration Options
Leverage Customization: Each of the 40 leverage levels (20 long, 20 short) includes individual toggle controls and adjustable leverage values from 1x to 1000x, though practical ranges typically stay within 1x-100x.
Display Controls: Toggle liquidation lines, price labels, and reference markers independently. Adjust label offset distance, label size, and line length to optimize chart presentation.
Reference Settings: Choose between Auto and Manual modes, set auto reference offsets, and configure lookback distances for both modes. Manual mode includes vertical projection width controls for targeted analysis.
Maintenance Margin: Adjustable from 0.1% to 100% with 0.1% increments, allowing precise matching to specific exchange requirements or conservative risk modelling.
Usage Instructions
Select Reference Mode: Choose Auto for current price analysis or Manual for specific coordinate targeting.
Configure Leverage Levels: Enable relevant leverage ratios and adjust values to match your trading requirements. Disable unused levels to reduce chart complexity.
Set Maintenance Margin: Input your exchange's maintenance margin requirement. Common values range from 0.5% to 2.0% depending on the exchange and instrument.
Adjust Display Settings: Enable price labels if exact values are needed, adjust label positioning to prevent overlap, and set appropriate line length for your analysis timeframe.
Interpret Results: Liquidation lines show where positions would be automatically closed. Distance from current price to liquidation levels indicates position safety margins.
Limitations and Important Considerations
Simplified Model: Calculations assume isolated margin mode and do not account for cross-margin scenarios, unrealized PNL from other positions, or dynamic margin adjustments that some exchanges implement.
Exchange Variations: Maintenance margin requirements vary significantly between exchanges and may change based on position size, market volatility, or account tier. Always verify current requirements with your specific exchange.
Additional Costs: The indicator does not factor in funding rates, trading fees, or borrowing costs that can affect actual liquidation levels in live trading environments.
Market Conditions: Extreme market volatility, low liquidity, or exchange system issues can cause actual liquidations to occur at prices different from calculated levels.
Historical Analysis Limitation: When using manual mode for historical analysis, results assume past margin requirements and do not account for exchange policy changes over time.
Technical Implementation
Built using Pine Script v6 for optimal performance and compatibility with TradingView's latest features. The indicator uses efficient conditional plotting to minimize chart rendering impact while displaying multiple leverage levels simultaneously.
Label management systems prevent overlapping displays while maintaining readability across different timeframes and chart scales. All calculations use TradingView's native precision handling to ensure accurate price computations across various instruments and price ranges.
The plotting system dynamically adjusts based on reference mode and projection settings, ensuring clean chart presentation whether analysing current levels or historical scenarios.
Educational Value
This indicator helps traders develop intuitive understanding of leverage mechanics and liquidation risk. By visualizing multiple scenarios simultaneously, users can observe how leverage changes affect risk profiles and make more informed decisions about position sizing and risk management.
The tool serves as a practical education platform for understanding the mathematical relationships between leverage, margin requirements, and liquidation distances, concepts that are crucial for successful leveraged trading.
Risk Disclaimer: This indicator is designed for educational and analytical purposes only. Liquidation calculations are estimates based on simplified mathematical models and may not reflect actual liquidation prices due to exchange-specific policies, market conditions, and additional fees. Always verify liquidation levels with your exchange and consider consulting with qualified financial professionals before making leveraged trading decisions. Trading leveraged instruments involves substantial risk of loss and may not be suitable for all investors. Past performance does not guarantee future results.
This indicator is compatible with all TradingView chart types and timeframes. It works with any tradeable instrument but is most relevant for assets that support leveraged trading.

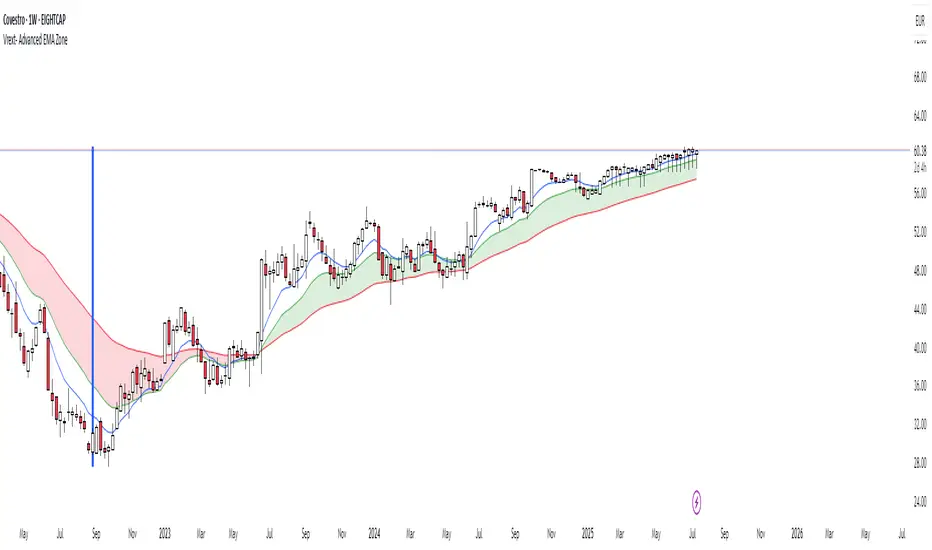
Vrext- Advanced EMA ZoneThe indicator highlights an area between two manually adjustable EMA-s to visibly mark a zone. A zone where the larger EMA is bellow the smaller one (indicating an uptrend) is marked green. On the opposite hand where higher EMA is above the lower the zone (indicating a downtrend) is marked red.
For correct zone marking enter EMA-s in descending order.
The indicator also allows you to add further additional EMA-s, which do not have a zone drawn between them and are just stand alone EMA-s. They are fully customisable in terms of colour, width. etc.
Additionally the indicator allows you to plot a vertical line ''xyz'' candles in the past. The idea behind it is that if you want to only focus on the previous 150 candles, there will be a clear line at the 150th candle for easier navigating.
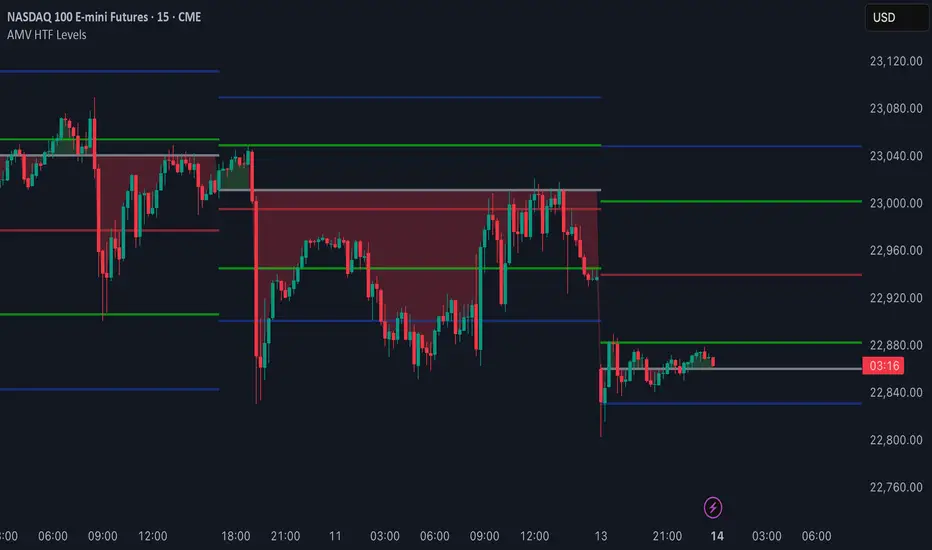
AMV HTF LevelsThe AMV HTF Levels indicator is a custom-built structure tool designed to help traders align with institutional-level zones across multiple timeframes. It auto-plots Fibonacci-based levels from the previous day and dynamically tracks the current session’s opens, highs, and lows across daily, weekly, and monthly timeframes.
What it does:
Uses previous day’s high and low to calculate Fibonacci retracement levels, drawing precise zone boxes that act as support/resistance or trend filters.
Tracks and updates the current high and low of the day/week/month in real time using floating boxes that extend through each respective session.
Plots static open levels at the beginning of each day, week, or month, with optional visual fills that indicate whether price is trading above (bullish) or below (bearish).
Lets you toggle on/off individual level groups or presets (e.g., 50%, key levels, power levels) to tailor what’s shown based on your trading style.
📈 Use case:
This tool is designed for traders who want to anchor their intraday or swing decisions around high-probability reference levels.
It can be used to:
Identify trend conditions
Trending above the upper green line (e.g. 78.6% or 100%) indicates strength.
Ranging between green lines often signals consolidation or balance.
Trending below the lower green line (e.g. 0% or 23.6%) shows bearish pressure.
Use opens as bias filters
Daily/Weekly/Monthly Opens act as key session pivot points.
Price holding above the open = bullish structure.
Price rejecting the open = potential reversal or shift.
React to dynamic highs/lows
Monitor where liquidity is building or being swept.
Use real-time high/low tracking for breakout/reversal triggers.
This is not a signal generator — it's a market context enhancer. Use it alongside your entry system to sharpen your timing, filter bad trades, and align with the bigger picture.
LTHB & HTLB Zones with AlertsIn price action trading, the Lowest Tick of the Highest Bar (LTHB) and the Highest Tick of the Lowest Bar (HTLB) are important concepts for support/resistance identification, trend exhaustion, and reversal confirmation. Here's what they mean and why they matter:
🔹 Definitions
1. Lowest Tick of the Highest Bar (LTHB):
The lowest price (tick) of the bar (candlestick) with the highest high in a recent price swing.
Significance: It marks the support inside an upward swing. If price breaks below this, it often indicates loss of upward momentum or reversal.
2. Highest Tick of the Lowest Bar (HTLB):
The highest price of the bar with the lowest low in a swing.
Significance: It acts as a resistance inside a downward swing. If price moves above this, it can signal a bullish reversal.
🔸 Why Are They Significant?
Concept LTHB HTLB
Trend Reversal - Break below LTHB → possible bearish reversal Break above HTLB → possible bullish reversal
Swing Confirmation -Holding above LTHB → continuation of uptrend Holding below HTLB → continuation of downtrend
Trap Detection - Stop hunts often occur just below LTHB Stop hunts often occur just above HTLB
Risk Management -Acts as logical stop-loss in long trades Acts as logical stop-loss in short trades
🔸 Uses in Strategy
1. Breakout Traders use these levels as entry triggers.
2. Reversal Traders look for price failing to hold these levels for early reversal signs.
3. Structure-Based Traders use them to confirm higher highs/lower lows.
4. Stop Placement: Tight stops just beyond LTHB/HTLB help manage risk in swing trades.
🔔 How to Set Alerts in TradingView:
Add the script to your chart.
Open the "⚠️ Alerts" tab.
Click "Create Alert".
In the "Condition" dropdown, select one of:
Enter LTHB Zone
Exit LTHB Zone
Enter HTLB Zone
Exit HTLB Zone
Set desired alert frequency (e.g., once per bar or once).
Click Create.

Enhanced Zones with Volume StrengthEnhanced Zones with Volume Strength
Your reliable visual guide to market zones — now with Multi-Timeframe (MTF) power!
What you get:
Clear visual zones on your chart — color-coded boxes that highlight important price areas.
Blue Boxes for neutral zones — easy to spot areas of indecision or balance.
Gray Boxes to show normal volume conditions, giving you context without clutter.
Green Boxes highlighting bullish zones where strength is showing.
Red Boxes marking bearish zones where weakness might be in play.
Multi-Timeframe Support:
Seamlessly visualize these zones from higher timeframes directly on your current chart for a bigger-picture view, helping you make smarter trading decisions.
How to use it:
Adjust the box width (in bars) to fit your trading style and timeframe.
Customize colors and opacity to suit your chart theme.
Toggle neutral blue and gray volume boxes on/off to focus on what matters most to you.
Set the maximum number of boxes to keep your chart clean and performant.
Why you’ll love it:
This indicator cuts through the noise by visually marking zones where volume and price action matter the most — without overwhelming your chart. The MTF feature means you’re always aligned with higher timeframe trends without switching views.
Pro tip:
Use these boxes as dynamic support/resistance areas or to confirm trade setups alongside your favorite indicators.
No complicated formulas here, just crisp, actionable visuals designed for clarity and confidence.

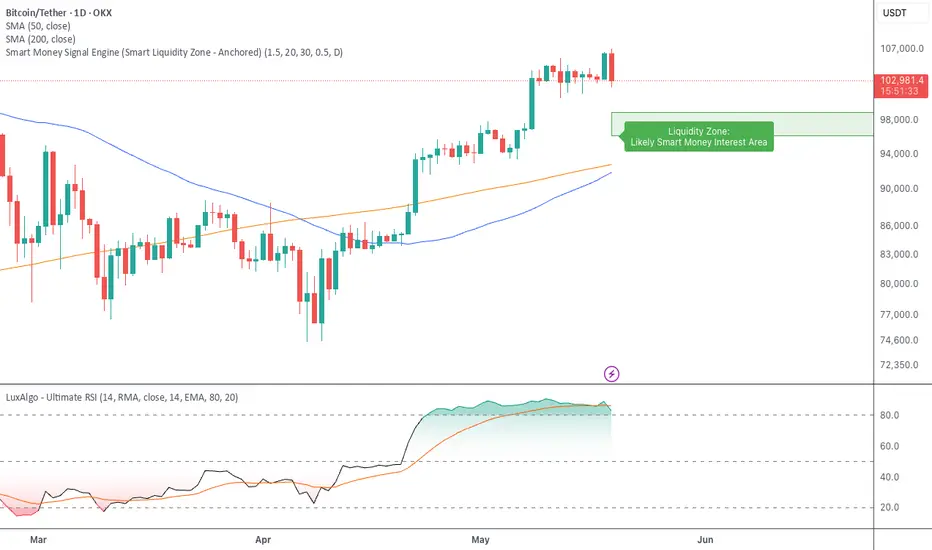
Smart Money Signal Engine (Smart Liquidity Zone - Anchored)🧭 Smart Liquidity Zone Indicator – Simple Guide
✅ What This Does
This tool helps you spot:
1. Smart Money Buy Zones (green box)
2. Fake Breakouts (trap alerts)
3. Real Breakouts (momentum alerts)
⸻
1. 🟩 Liquidity Zone (Green Box)
What it means:
Where big players (smart money) are likely interested in buying.
What you do:
• If price enters the box and holds → consider buying
• If price drops through fast → wait or look for short setups
⸻
2. 🔴 Trap Alert (Smart Money Trap)
What it means:
Price goes up fast with volume…
But no real buying power underneath = likely fakeout
On chart:
You’ll see a red label that says “Trap”
What you do:
• ❌ Don’t chase the pump
• ✅ Wait for reversal or short entry
⸻
3. 🟢 Breakout Alert
What it means:
Price breaks above a key level with strong volume
Smart money is likely behind the move
On chart:
You’ll see a green label that says “Breakout”
What you do:
• ✅ You can enter a momentum trade
• ✅ Place stop below previous structure
⸻
🔔 How to Turn on Alerts
Go to:
• TradingView > Alerts > Condition
• Choose:
• Smart Money Trap Alert
• Breakout Confirmed Alert
This way, TradingView notifies you instantly when:
• A fakeout is happening
• A real breakout begins
Pivot ATR Zones [v6]🟩 Pivot ATR Zones
Overview:
The Pivot ATR Zones indicator plots dynamic support and resistance zones based on pivot highs and lows, combined with ATR (Average True Range) volatility levels. It helps traders visually identify potential long and short trade areas, along with realistic target and stop loss zones based on market conditions.
Features:
Automatically detects pivot highs and lows
Draws ATR-based entry zones on the chart
Plots dynamic take-profit and stop-loss levels using ATR multipliers
Color-coded long (green) and short (red) zones
Entry arrow markers for clearer trade visualization
Real-time alerts when new zones form
Best For:
Scalpers, intraday traders, and swing traders who want a visual, volatility-aware way to mark potential trade areas based on key pivot structures.
How to Use:
Look for newly formed green zones for long opportunities and red zones for short setups.
Use the dashed lines as dynamic take-profit and stop levels, tuned to the current ATR value.
Combine with other confirmation tools or indicators for optimal results.
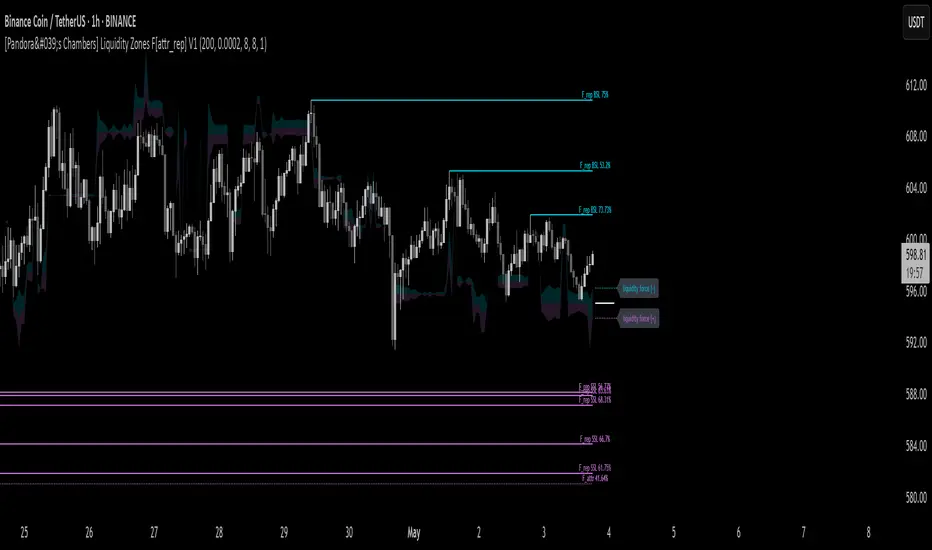
[Pandora's Chambers] Liquidity Zones F[attr_rep] V1The Liquidity Zones F V1 indicator merges visual liquidity‐zone analysis with a mathematical model that quantifies opposing market forces. It scans a historical lookback window to compute average volume (avgVol), aggregates cumulative buy/sell volumes, detects significant wicks, and renders main and dotted lines plus background fills to show pressure at each price level. After constructing these graphic elements, it scores each signal (up to 130 points) and converts it into a percentage (0–100%) mapped onto a five‑domain polar scale:
0–50: Negative dominance
50–60: Initial equilibrium
60–75: Positive momentum build‑up
75–80: Decay of positive effect
80–100: Positive overextension with reversal potential
1. How It Works
Lookback & avgVol:
– Computes a simple moving average of volume over lookback bars.
cumBuy / cumSell:
– Adds volume to cumBuy when bar close > open; to cumSell when close < open.
Wick Detection:
– Flags bars whose wick length exceeds body length; records creation price, wickFactor, and volume.
Line Creation:
– For each strong wick, draws a solid “main” line and a dotted “secondary” line, with placeholder labels.
Scoring & Chance%:
– On each new bar, computes volume delta since creation, applies weighted scoring (wickFactor, volume ratio, proximity, leverage, imbalance) up to 130 points.
– Converts score to chancePerc (0–100%).
Style & Label Updates:
– ≥76%: dashed line; 50–76%: solid or dotted by classification; <50%: dotted “F_attr.”
– Labels show “F_rep …” or “F_attr X%.”
Magnet Lines:
– Identifies lowest bullish‐main price and highest bearish‐main price, computes midPrice and relative fraction, then calculates targetPrice A/B.
– Draws dotted magnet lines and labels “liquidity force (+)/(–)” beside price chart.
Background Fill:
– Fills area between midPrice and bullishTarget in bullish color; between midPrice and bearishTarget in bearish color.
2. Settings & Inputs
Parameter Default Description
lookback 200 Number of bars to calculate average and cumulative volumes.
offsetDot 0.0002 Vertical spacing between dotted lines.
ratioLineLength 8 Length (in bars) of the magnet line.
ratioLineOffset 8 Horizontal offset (bars) for magnet placement.
ratioLineWidth 1 Width of magnet lines (1–10).
bullish_line_color #00BCD4 Color for bullish main and dotted lines.
bearish_line_color #BA68C8 Color for bearish main and dotted lines.
Advanced Tweaks:
Adjust the number of dotted “grade” lines per wick or modify the scoring thresholds for custom classification.
3. Interpretation & Polar Scale
The x value (chancePerc) is interpreted across five polar domains for concise force balance reading:
0 ≤ x < 50: Selling dominance – consider exit or avoidance.
50 ≤ x < 60: Early balance – await confirmation.
60 ≤ x < 75: Rising buy pressure.
75 ≤ x < 80: Slowing bullish momentum.
80 ≤ x ≤ 100: Overextended bullish – watch for potential reversal.