6E update Premarket High/Low Label (CME 6E style)6E update Premarket High/Low Label (CME 6E style). hope it helps :)
Statistics
6E update Session Prep (CME Day Session 6E, UTC-4)6E update Session Prep (CME Day Session 6E, UTC-4) updated. hope it helps :)


Ghost Month HighlighterGhost Month and Trading: Understanding the Phenomenon
Ghost Month (鬼月) is the seventh month of the lunar calendar in Chinese culture, typically falling between late July and September. During this period, it's believed that the gates of the afterlife open and spirits roam the earth. This deeply rooted cultural belief has significant implications for Asian markets, particularly in regions with large Chinese populations like Taiwan, Hong Kong, Singapore, and mainland China.
Why Markets Often Decline or Stay Flat During Ghost Month:
Reduced Business Activity : Many businesses avoid launching new products, signing major contracts, or making significant investments during this period, believing it brings bad luck.
Property Market Slowdown : Real estate transactions drop significantly as people avoid moving homes or making large purchases. In some markets, property sales can decline by 20-30%.
IPO and M&A Drought : Companies often delay IPOs and merger announcements until after Ghost Month, reducing market catalysts.
Retail Spending Drops : Consumer spending on big-ticket items decreases, though spending on offerings and religious items increases.
Self-Fulfilling Prophecy : Many traders and investors reduce positions or stay on the sidelines, creating lower volumes and increased volatility. This becomes a self-fulfilling prophecy where expectation of poor performance leads to actual underperformance.
Tourism and Entertainment Impact : Travel and entertainment sectors see reduced activity as people avoid unnecessary trips and celebrations.
Historical data shows that Asian equity markets often underperform during Ghost Month, with some studies indicating average returns can be 2-5% lower than other months. However, this also creates opportunities for contrarian investors who buy during the seasonal weakness.
Inspired by @honey_xbt

FunctionADFLibrary "FunctionADF"
Augmented Dickey-Fuller test (ADF), The ADF test is a statistical method used to assess whether a time series is stationary – meaning its statistical properties (like mean and variance) do not change over time. A time series with a unit root is considered non-stationary and often exhibits non-mean-reverting behavior, which is a key concept in technical analysis.
Reference:
-
- rtmath.net
- en.wikipedia.org
adftest(data, n_lag, conf)
: Augmented Dickey-Fuller test for stationarity.
Parameters:
data (array) : Data series.
n_lag (int) : Maximum lag.
conf (string) : Confidence Probability level used to test for critical value, (`90%`, `95%`, `99%`).
Returns: `adf` The test statistic. \
`crit` Critical value for the test statistic at the 10 % levels. \
`nobs` Number of observations used for the ADF regression and calculation of the critical values.

01010000 01010011 01010000saap is tuuufff 1298y91 iuaiuohd as diua9udiwpjhd0w9871 ey-9781e09718h e97uwdau9whdua9wh dwau978 hdwa-97u8hd aw-98u7 dhaw-98u7h dwa9u8 hdaw-98d aw-98h daw9ud haw9-u8d haw9-8u dhaw98-ud aw890hd wa-98 hd8a0w- daw

FU Candle - dnd_whael What the FU Candle Indicator does:
First we need to understand what FU candles are. There's bullish and bearish FU candles.
Bullish FU candles are candles that have a long wick that takes out the previous candles low, then turns around and closes above the high of the previous candle.
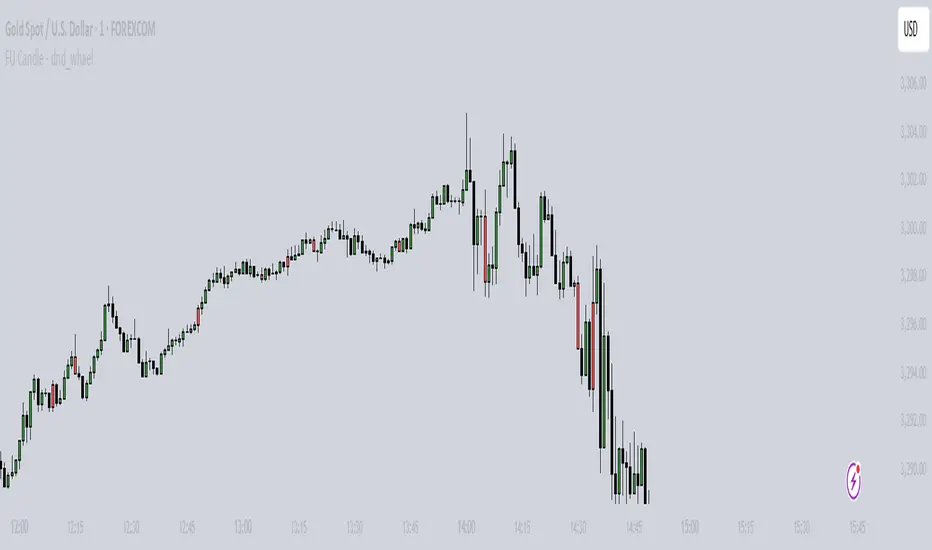
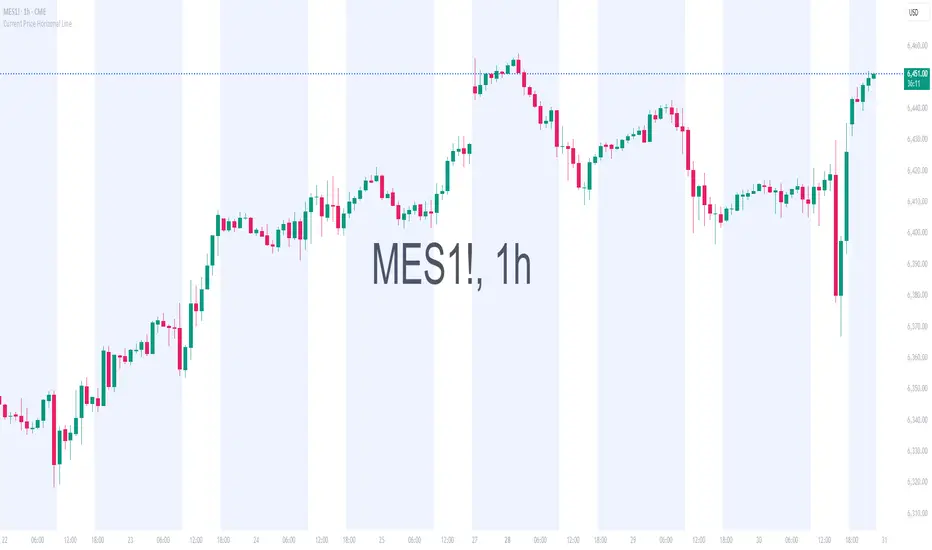
Current Price Horizonal LineDisplays a horizonal line across the chart of the current price.
For some reason the screenshot does not capture the indicator horizonal line.
Session Prep (RTH only, UTC-4)corrected Session Prep (RTH only, UTC-4) now its working properly. hope it helps! :)

EUR/USD Multi-Layer Statistical Regression StrategyStrategy Overview
This advanced EUR/USD trading system employs a triple-layer linear regression framework with statistical validation and ensemble weighting. It combines short, medium, and long-term regression analyses to generate high-confidence directional signals while enforcing strict risk controls.
Core Components
Multi-Layer Regression Engine:
Parallel regression analysis across 3 customizable timeframes (short/medium/long)
Projects future price values using prediction horizons
Statistical significance filters (R-squared, correlation, slope thresholds)
Signal Validation System:
Lookback validation tests historical prediction accuracy
Ensemble weighting of layer signals (adjustable influence per timeframe)
Confidence scoring combining statistical strength, layer agreement, and validation accuracy
Risk Management:
Position sizing scaled by signal confidence (1%-100% of equity)
Daily loss circuit breaker (halts trading at user-defined threshold)
Forex-tailored execution (pip slippage, percentage-based commissions)
Visual Intelligence:
Real-time regression line plots (3 layered colors)
Projection markers for short-term forecasts
Background coloring for market bias indication
Comprehensive statistics dashboard (R-squared metrics, validation scores, P&L)
Key Parameters
Category Settings
Regression Short/Med/Long lengths (20/50/100 bars)
Statistics Min R² (0.65), Correlation (0.7), Slope (0.0001)
Validation 30-bar lookback, 10-bar projection
Risk Controls 50% position size, 12% daily loss limit, 75% confidence threshold
Trading Logic
Entries require:
Ensemble score > |0.5|
Confidence > threshold
Short & medium-term significance
Active daily loss limit not breached
Exits triggered by:
Opposite high-confidence signals
Daily loss limit violation (emergency exit)
The strategy blends quantitative finance techniques with practical trading safeguards, featuring a self-optimizing design where signal quality directly impacts position sizing. The visual dashboard provides real-time feedback on model performance and market conditions.

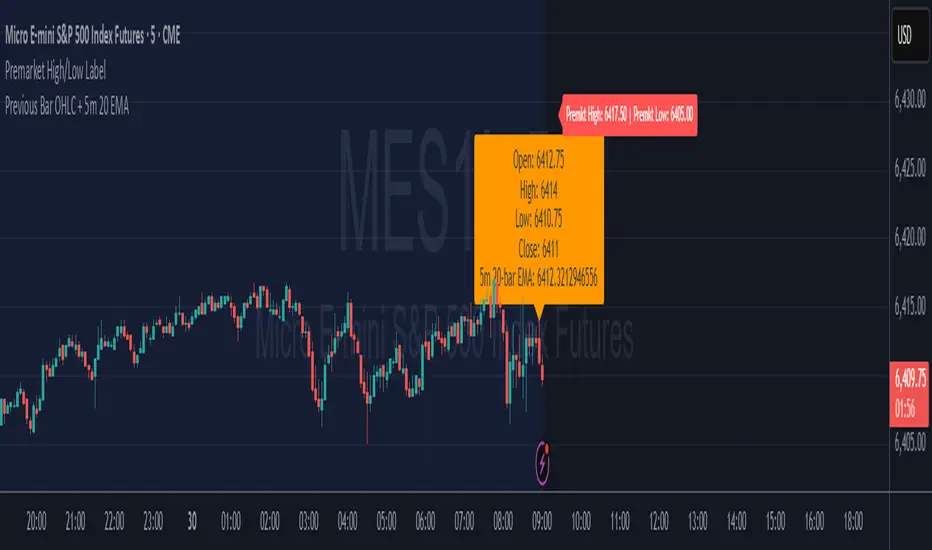
Premarket High/Low LabelThis is the premarket high low label that will persist through current trading session. hope it helps :)
CCI-MACD Strategy 4.2
I cerchi si basano sull'oscillatore CCI (Commodity Channel Index).
L’indicatore CCI ci permette di osservare se il livello attuale del prezzo è particolarmente al di sopra o al di sotto di una certa media mobile, avente un numero di periodi scelto da noi.
Più la deviazione dal prezzo medio nel breve termine è forte, e maggiormente l’indicatore si allontanerà dallo 0: verso l’alto in caso di uptrend, o verso il basso in caso di downtrend.
Il segnale viene dato quando il valore del CCI supera la linea dello zero.
Il tutto è filtrato con un altro indicatore, il MACD, acronimo di "Moving Average Convergence Divergence", usato per identificare cambiamenti nel momentum del prezzo.
The circles are based on the CCI (Commodity Channel Index) oscillator.
The CCI indicator allows us to observe whether the current price level is significantly above or below a certain moving average, with a number of periods chosen by us.
The greater the deviation from the short-term average price, the further the indicator will deviate from 0: upwards in the case of an uptrend, or downwards in the case of a downtrend.
The signal is given when the CCI value crosses the zero line.
This is all filtered through another indicator, the MACD, which stands for "Moving Average Convergence Divergence," used to identify changes in price momentum.

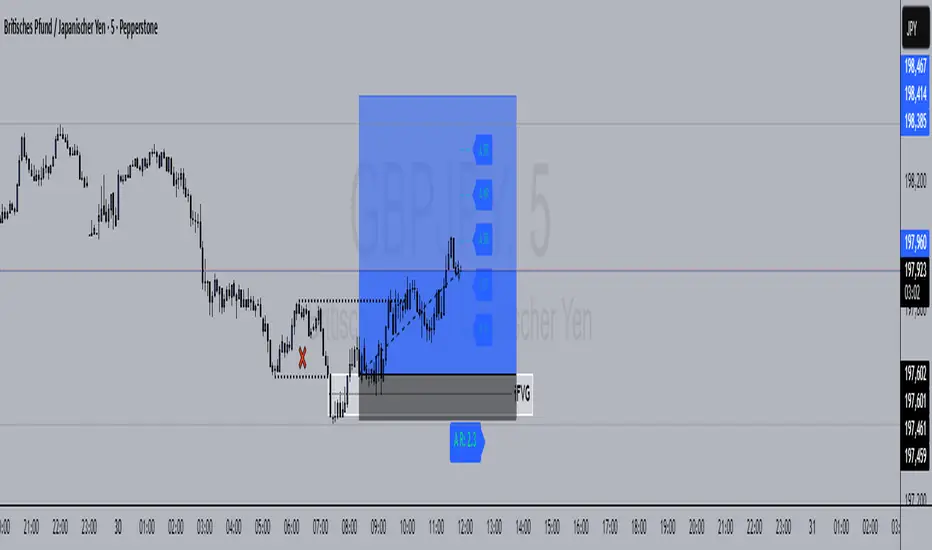
R Manager PRO++ – Multi-Setup Risk/Reward ToolDescription
The R Manager PRO++ V1.3d is an advanced risk/reward management tool designed for traders who want to visually plan, track, and manage multiple trade setups directly on their charts.
This script allows you to plot up to three independent setups (A, B, and C) simultaneously. For each setup, you can manually input your Entry and Stop Loss levels, and the tool will automatically calculate and display R-multiple levels (1R to 5R), providing a clear overview of your potential profit targets.
Key Features
Multi-Setup Management (A, B, C)
Track up to three separate trades at the same time, each with individual colors and controls.
Manual Entry & Stop Loss Input
Enter your trade levels manually for flexible usage across any market or strategy.
Automatic R-Multiple Calculation (1R to 5R)
The indicator automatically draws lines and labels for 1R to 5R targets based on your risk distance.
Live R Display
Real-time calculation of your current R multiple, updating with every price move.
Custom Symbol Selection
Link each setup to a specific symbol (e.g., EURUSD, XAUUSD, NAS100) to manage multiple markets without clutter.
Reset Function
One-click reset button to quickly clear individual setups.
Alerts for Reached R-Levels
Receive alerts when price reaches each R level (1R to 5R) to monitor trades without constant chart-watching.
How to Use
- Select Entry and Stop Loss levels manually in the input panel.
- Choose the symbol for each setup (supports Forex, Indices, Gold).
- Enable or disable setups individually with the Activate checkbox.
- Optional: Use the Reset button to clear a setup quickly.
- Monitor R-multiples visually and via alerts as price evolves.
Suitable For
- Swing traders
- Day traders
- Risk-based trading strategies (R-multiples)
- Multi-market portfolio management
Simple 5 Moving Averages 5 MAs - Shubhashish DixitEnjoy the 5 Moving Average to Support your analysis deeper

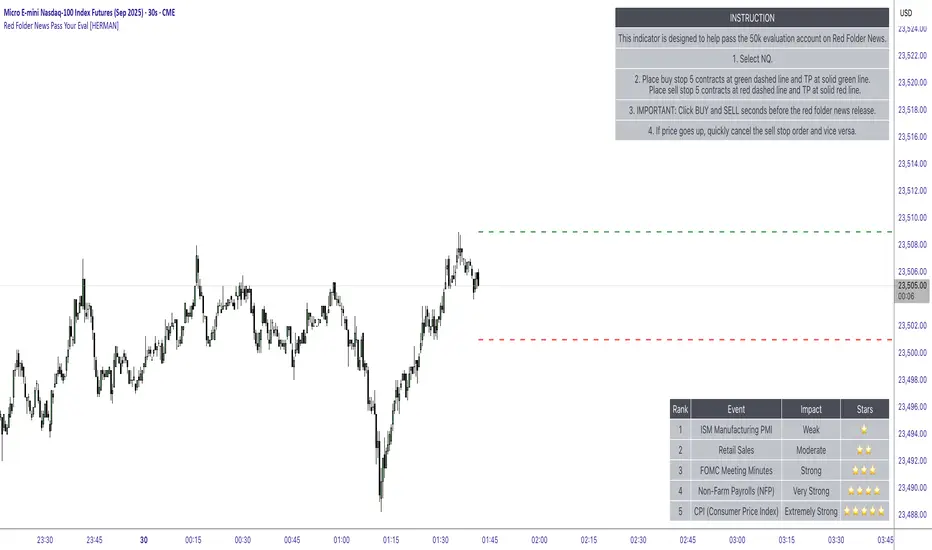
Red Folder News Pass Your Eval [HERMAN]Red Folder News Levels
This indicator provides visual reference levels around high-impact economic news events (commonly called “red folder” news) to help traders prepare for potential market volatility.
It is strictly educational and informational and does not place trades or guarantee any results.
What This Indicator Does:
-Plots dynamic price reference levels above and below the current market price.
-Displays Take Profit (TP) reference levels a fixed distance from the entry levels.
Shows optional on-chart tables:
Instruction Table – summarizes how to interpret the plotted levels.
Red Folder News Table – lists key economic events (CPI, NFP, FOMC, ISM, etc.) and ranks them by typical market impact.
Visual Elements on the Chart:
-Green Dashed Line → Upper reference level (potential long-side zone).
-Solid Green Line → Take-profit reference above the green dashed line.
-Red Dashed Line → Lower reference level (potential short-side zone).
-Solid Red Line → Take-profit reference below the red dashed line.
These levels update dynamically with each new bar, allowing you to see real-time visual guides around market-moving news releases.
Settings & What They Do:
-Entry Settings
-Manual Entry Offset (pts)
Distance in points above and below the current price to place the dashed reference levels.
Example: 4.0 means the green/red dashed lines appear 4 points above and below the current market price.
Instruction Table
Show Instruction Table (true/false)
If enabled, displays a step-by-step usage table on the top-right of the chart.
Explains how to interpret the visual levels in a simple flow.
Red Folder News Table
Show Red Folder News Table (true/false)
If enabled, displays a reference list of high-impact economic events on the bottom-right of the chart.
Events are ranked by market impact (⭐ to ⭐⭐⭐⭐⭐).
Theme Settings
Table Theme (Dark/Light)
Switch between a dark or light theme for all on-chart tables.
Adjusts the background and text colors to improve visibility depending on your chart style.
Note: The TP distance is fixed at 32 points and is automatically calculated from the entry lines.
How to Use (Educational Only)
Add the indicator to your chart and set your preferred Manual Entry Offset.
Check the Red Folder News Table to know which events typically generate higher volatility.
Observe the visual levels before high-impact economic releases.
Use them purely as reference zones for your own manual analysis and risk management.
⚠️ Disclaimer:
This script is for educational and informational purposes only.
It does not execute trades, provide financial advice, or guarantee performance.
Always trade responsibly and use your own judgment and risk management.
This description:
✅ Explains logic, visuals, and settings
✅ Avoids buy/sell instructions and profit promises
✅ Meets TradingView House Rules
Premarket High/Low LabelThis is an indicator which shows premarket high/low label. so that you dont have to do it yourself. hope it helps :)

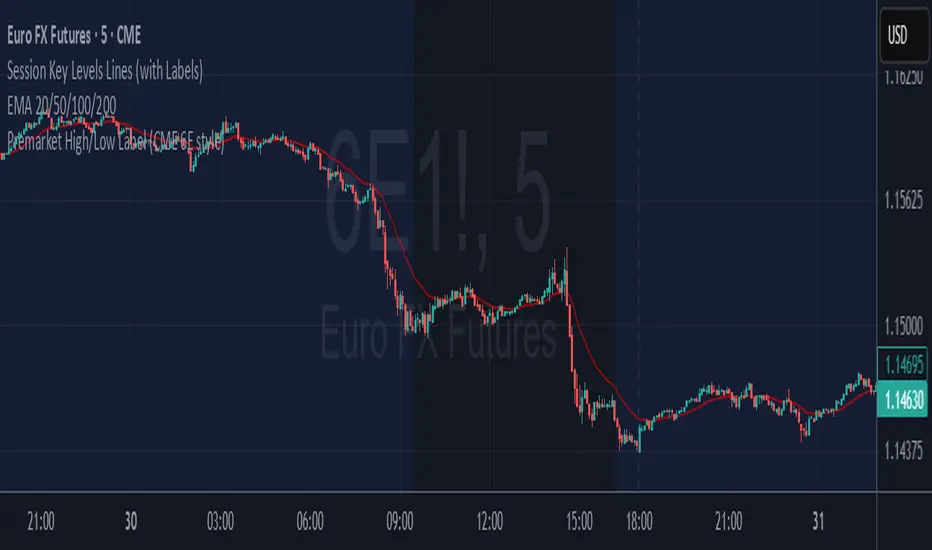
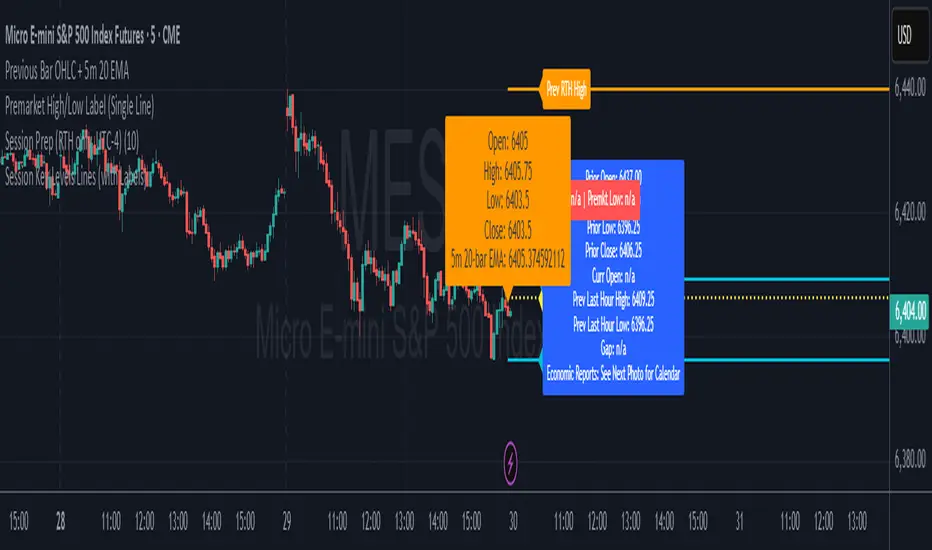
Session Key Levels Lines (with Labels)This is an extension of the previous indicator, it just plots all the information you need automatically for you so you dont have to lift a finger. hope it helps :)

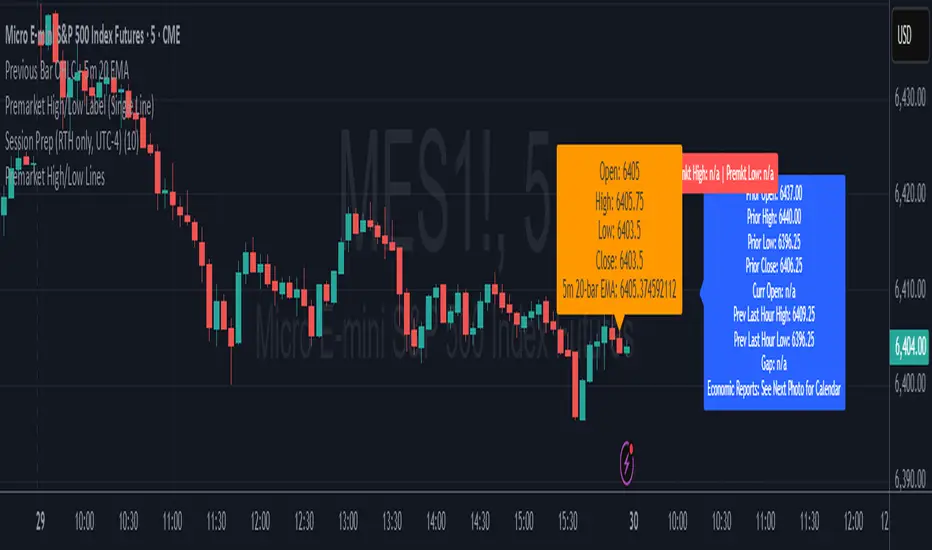
Session Prep (RTH only, UTC-4)This shows what you have to prepare before each session, including Previous session's OHLC, how much is being gapped up...etc. hope it helps :)
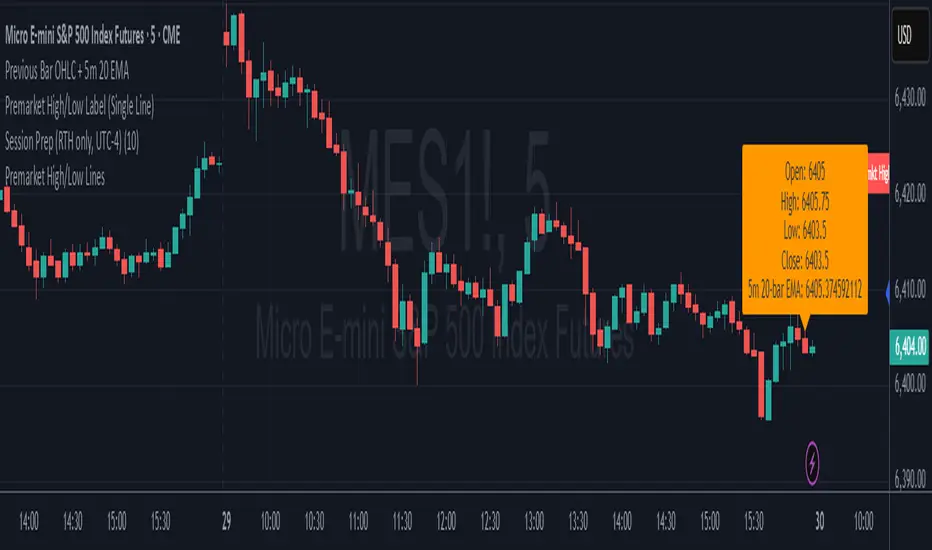
Previous Bar OHLC + 5m 20 EMAThis shows previous bar OHLC + 5m 20 EMA in one single text box, so you dont have to find it yourself. hope it helps :)

Premarket High/Low LinesTHis is another script about premarket lines, the previous one is a label and this one really plot the lines, so you dont have to do it yourself. hope it helps :)
Premarket High/Low Label (Single Line)it shows you what the premarket high low label is on a single line, saving you the hassale of fidning it yourself. :) hope it helps.
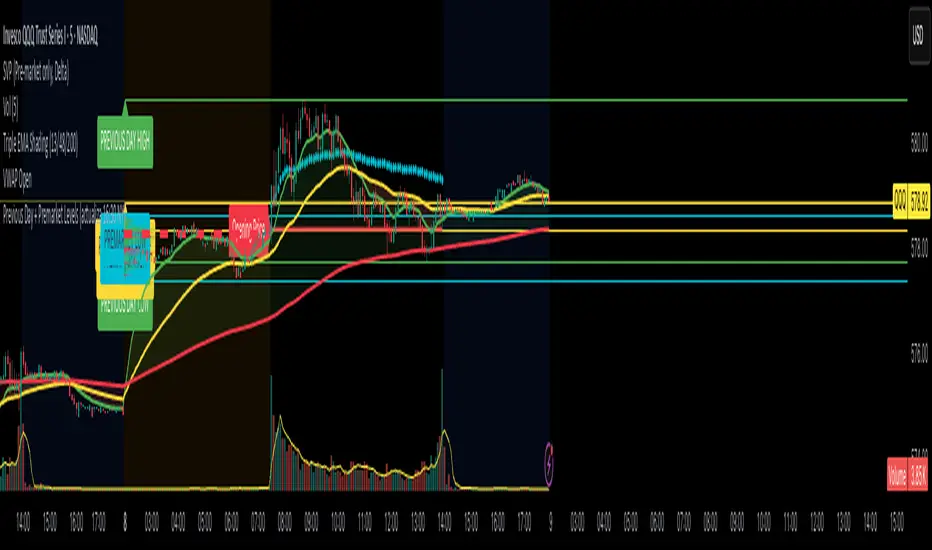
Previous Day Levels (High, Low, Open, Close)This TradingView Pine Script indicator plots the previous day’s price levels (High, Low, Open, and Close) as horizontal rays that extend across the current trading day.
Green lines mark the Previous Day High and Previous Day Low.
Yellow lines mark the Previous Day Open and Previous Day Close.
Labels are automatically displayed at the right edge of the chart, positioned above each line, making it easy to identify the corresponding level in real time.
The levels are updated daily and always begin at the start of the current day, ensuring that they cover the entire intraday session.
This tool helps traders quickly visualize key support and resistance levels from the previous trading day and incorporate them into intraday strategies.
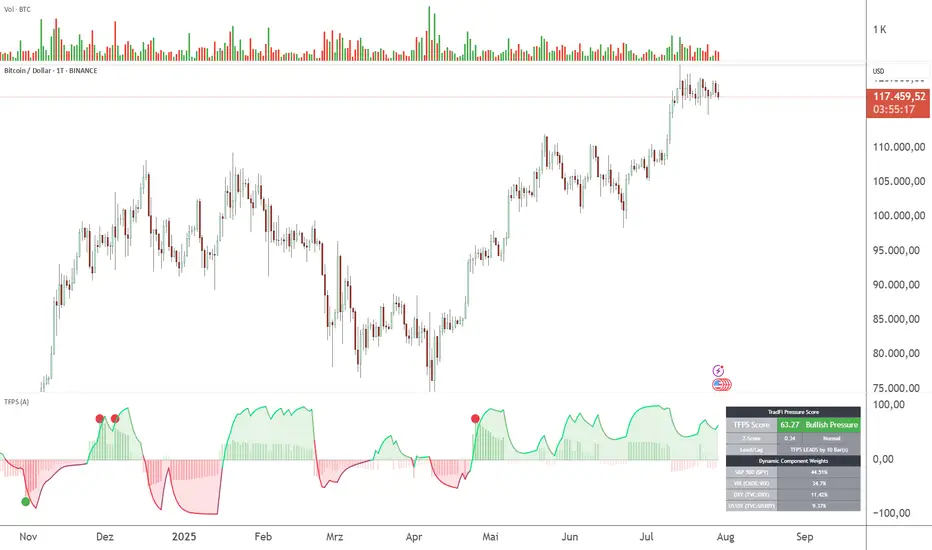
TFPS - TradFi-Pressure-Score (Adaptive)The data-driven answer to an irreversible market reality.
This indicator quantifies the combined pressure from the S&P 500, VIX, DXY, and US10Y, whose correlation to crypto has reached peak values of 0.87. Your decisive macro edge, in real-time.
This indicator is built on a fundamental analysis of market data from the last five years. The analysis proves an irreversible transformation: The crypto market has evolved into a high-beta risk asset, its fate inextricably linked to Traditional Finance (TradFi).
The empirical data is clear:
Bitcoin increasingly behaves like a leveraged version of the S&P 500.
The correlation to stock indices, with peak values of up to 0.87, is statistically highly significant.
The "digital gold" safe-haven narrative is refuted by the data; the correlation to gold (0.04) is virtually non-existent and statistically insignificant.
This means: Standard indicators like RSI or MACD are insufficient for today's market conditions. They only see price, ignoring the powerful external context that now dominates price action.
The TradFi Pressure Score (TFPS) is the answer to this data-driven reality. It's your institutional-grade macro dashboard, aggregating the four most dominant external forces into a single, actionable score:
S&P 500 (SPY): The pulse of global risk appetite. A rising S&P signals a "risk-on" environment, fueling capital flows into crypto.
VIX: The market's "Fear Gauge". A rising VIX signals a "risk-off" flight to safety, draining liquidity from crypto.
DXY (US-Dollar Index): The counter-pole to risk assets. A strong Dollar (rising DXY) tightens global liquidity, creating significant headwinds for Bitcoin.
US 10Y Yield: The opportunity cost of capital. Rising yields make risk-free assets more attractive, pulling capital away from non-yielding assets like crypto.
What makes TFPS truly unique?
Dynamic Weighting (its secret weapon): Which factor matters most today? The DXY or the VIX? TFPS continuously analyzes the correlation of all four factors to your chosen asset (e.g., Bitcoin) and automatically adjusts their weight in real-time. This ensures you're always focused on what's currently driving the market.
Adaptive Engine : What drives a 15-minute chart is different from a daily chart. The TFPS engine automatically adapts its lookback periods and calculations to your chosen timeframe for optimal relevance.
Clear, Actionable Signals Designed for Traders:
Pressure Line (>0 or <0): Instantly see if the world's largest financial forces are providing a tailwind or a headwind for your trade.
Z-Score (Extreme Readings) : Get early warnings of extreme macro "Greed" or "Fear". Readings above +2 or below -2 have historically pinpointed moments of market exhaustion that often precede major trend reversals.
Regime Change : A fundamental shift in the nature of TradFi pressure is visualized with a clear signal, providing unambiguous macro insights.
Lead/Lag Status : Gain a critical edge by knowing who's in the driver's seat. The dashboard tells you if TradFi is LEADING the price action or if crypto is moving independently, allowing you to focus on the right information source.
This is a private beta. I am granting exclusive access to a limited number of traders who understand this new market reality. In exchange for your valuable feedback, you will be among the first to leverage what I believe is the new standard for macro analysis in crypto trading.
Request access to trade with the full context.