Quasimodo (QML) Pattern [Kodexius]Quasimodo (QML) Pattern is a market structure indicator that automatically detects Bullish and Bearish Quasimodo formations using confirmed swing pivots, then visualizes the full structure directly on the chart. The script focuses on the classic liquidity-grab narrative of the QML: a sweep beyond a prior swing (the Head) followed by a decisive market structure break (MSB), leaving behind a clearly defined reaction zone between the Left Shoulder and the Head.
Detection is built on pivot highs and lows, so patterns are evaluated only after swing points are validated. Once a valid 4 pivot sequence is identified, the indicator draws the pattern legs, highlights the internal triangle area to emphasize the grab, marks the MSB leg, and projects a QML zone that can be used as a potential area of interest for retests.
This tool is designed for traders who work with structure, liquidity concepts, and reversal/continuation triggers, and who want a clean, repeatable QML visualization without manually marking swings.
🔹 Features
🔸 Confirmed Pivot Based Structure Mapping
The script uses classic built-in pivot logic to detect swing highs and swing lows.
🔸 Automatic Bullish and Bearish QML Detection
The indicator evaluates the most recent 4 pivots and checks for a valid alternating sequence (High-Low-High-Low or Low-High-Low-High). When the sequence matches QML requirements, the script classifies the setup as bullish or bearish:
Bullish logic (structure reversal up):
- Left Shoulder is a pivot Low
- Head is a lower Low than the Left Shoulder (liquidity sweep)
- MSB pivot exceeds the Reaction pivot
Bearish logic (structure reversal down):
- Left Shoulder is a pivot High
- Head is a higher High than the Left Shoulder (liquidity sweep)
- MSB pivot breaks below the Reaction pivot
🔸 Full Pattern Visualization (Legs + Highlighted Core)
When a pattern triggers, the script draws:
Three main legs: Left Shoulder to Reaction, Reaction to Head, Head to MSB
A shaded triangular highlight over the internal structure to make the liquidity-grab shape easy to spot at a glance
🔸 QML Zone Projection
A QML Zone box is drawn using the price range defined between the Left Shoulder and the Head, then extended to the right to remain visible as price develops. This zone is intended to act as a practical reference area for potential retests and reaction planning after MSB confirmation.
🔸 MSB Emphasis
A dotted MSB line is drawn between the Reaction point and the MSB point to visually emphasize the confirmation leg that completes the pattern logic.
🔸 Clean Point Tagging and Directional Labeling
Key points are labeled directly on the chart:
- “LS” at the Left Shoulder
- “Head” at the sweep pivot
- “MSB” at the break pivot
A directional label (“Bullish QML” or “Bearish QML”) is also printed to quickly identify the detected bias.
🔸 Configurable Visual Style
All main visual components are user configurable:
- Bullish and bearish colors
- Line width
- Label size
🔸 Efficient Update Logic
Pattern checks are only performed when a new pivot is confirmed, avoiding unnecessary repeated calculations on every bar. The most recent pattern’s projected elements (zone and label positioning) are updated as new bars print to keep the latest setup readable.
🔹 Calculations
This section summarizes the core logic used for detection and plotting.
1. Pivot Detection (Swing Highs and Lows)
The script relies on confirmed pivots using the user inputs:
Left Bars: how many bars must exist to the left of the pivot
Right Bars: how many bars must exist to the right to confirm it
float ph = ta.pivothigh(leftLen, rightLen)
float pl = ta.pivotlow(leftLen, rightLen)
When a pivot is confirmed, its true bar index is the pivot bar, not the current bar, so the script stores:
bar_index
2. Pivot Storage and History Window
Each pivot is stored as a structured object containing:
- price
- index
- isHigh (true for pivot high, false for pivot low)
A rolling history is maintained (up to 50 pivots) to keep processing stable and memory usage controlled.
3. Sequence Validation (Alternation Check)
The pattern evaluation always uses the latest 4 pivots:
p0: Left Shoulder candidate
p1: Reaction candidate
p2: Head candidate
p3: MSB candidate
Before checking bullish/bearish rules, the script enforces alternating pivot types:
bool correctSequence =
(p0.isHigh != p1.isHigh) and
(p1.isHigh != p2.isHigh) and
(p2.isHigh != p3.isHigh)
This prevents invalid structures like consecutive highs or consecutive lows from being interpreted as QML.
4. Bullish QML Conditions
A bullish QML is evaluated when the Left Shoulder is a Low:
Head must be lower than Left Shoulder (sweep)
MSB must be higher than Reaction (break)
if not p0.isHigh
if p2.price < p0.price and p3.price > p1.price
// Bullish QML confirmed
Interpretation:
p2 < p0 represents the liquidity grab below the prior swing low
p3 > p1 represents the market structure break above the reaction high
5. Bearish QML Conditions
A bearish QML is evaluated when the Left Shoulder is a High:
Head must be higher than Left Shoulder (sweep)
MSB must be lower than Reaction (break)
if p0.isHigh
if p2.price > p0.price and p3.price < p1.price
// Bearish QML confirmed
Interpretation:
p2 > p0 represents the liquidity grab above the prior swing high
p3 < p1 represents the market structure break below the reaction low
6. Drawing Logic (Structure, Highlight, Zone, Labels)
When confirmed, the script draws:
Three connecting legs (LS to Reaction, Reaction to Head, Head to MSB)
A shaded triangle using a transparent “ghost” line to enable filling
A dotted MSB emphasis line between Reaction and MSB
A QML Zone box spanning the LS to Head price range and projecting to the right
Point labels: LS, Head, MSB
A direction label: “Bullish QML” or “Bearish QML”
7. Latest Pattern Extension
To keep the newest setup readable, the script updates the most recently detected pattern by extending its projected elements as new bars print:
QML zone right edge is pushed forward
The main label x position is pushed forward
This keeps the last identified QML zone visible as price evolves, without having to redraw historical patterns on every bar.
دعم ومقاومة

SMC Academy [PhenLabs]📊 SMC Academy
Version: PineScript™ v6
📌 Description
The SMC Academy indicator is a comprehensive educational tool designed to demystify Smart Money Concepts (SMC) for traders of all levels. Unlike standard indicators that simply print signals, this script uses a “Learning Phase” system that allows users to toggle between individual concepts—such as Market Structure, Liquidity, Imbalances, and Order Blocks—or view them all simultaneously. It lets you focus on one piece of the puzzle at a time.
🚀 Points of Innovation
Progressive Learning Modes: Toggle between 5 distinct phases to master concepts individually before using the Full Strategy Mode.
Educational Tooltips: Hover over labels to read detailed explanations of why a BOS, MSS, or Liquidity zone was identified.
Smart Filtering: Uses ATR and Volume integration to filter out low-quality Fair Value Gaps and weak Order Blocks.
HTF Dashboard: A built-in panel analyzes Higher Timeframe (4H) data to ensure you are trading in alignment with the broader trend.
🔧 Core Components
Market Structure Engine: Automatically detects Swing Highs and Lows to map out market direction using configurable swing lengths.
Liquidity Manager: Identifies unmitigated swing points that serve as Buy-Side (BSL) and Sell-Side (SSL) liquidity magnets.
Imbalance Detector: Highlights Fair Value Gaps (FVG) where price inefficiencies exist, using ATR thresholds to ignore noise.
Order Block Identifier: Locates the specific candles responsible for structure breaks, validated by volume analysis.
🔥 Key Features
Break of Structure (BOS): Automatically marks trend continuation signals with solid lines and color-coded labels.
Market Structure Shift (MSS): Identifies potential trend reversals when significant swing points are breached.
Dashboard Context: Displays the current trend direction and the 4H context directly on your chart.
Custom Alerts: Built-in alert conditions for structure breaks and new Order Blocks allow for automated tracking.
🎨 Visualization
Structure Lines: Solid lines indicate confirmed breaks (Green for Bullish, Red for Bearish).
Liquidity Zones: Dotted lines extending rightward indicate resting liquidity levels that price may target.
FVG Boxes: Shaded boxes highlight imbalance zones, automatically extending for a user-defined number of bars.
Dashboard: A clean, non-intrusive table in the top-right corner displays trend status and active mode.
📖 Usage Guidelines
Setting Categories
Learning Mode: Select from ‘1. Market Structure’ through ‘5. Full Strategy Mode’ to filter what appears on the chart.
Swing Detection Length: Default (5). Determines the sensitivity of the swing high/low detection.
Structure Break Type: Options (Close/Wick). Choose whether a candle close or just a wick is required to confirm a break.
Min FVG Size: Default (0.5 ATR). Filters out gaps smaller than this multiplier to reduce noise.
Filter Weak OBs by Volume: Default (True). Only highlights Order Blocks where volume exceeds the 20-period average.
✅ Best Use Cases
Educational Study: Isolate “Phase 1: Market Structure” to practice identifying trend changes without distraction.
Trend Following: Use “Phase 3: Imbalances” to find entry points within an established trend.
Reversal Trading: Combine “Phase 2: Liquidity” and “Phase 4: Order Blocks” to catch reversals at key levels.
⚠️ Limitations
Subjectivity: Market structure can be interpreted differently depending on the swing length settings used.
Ranging Markets: Like all trend-following concepts, false BOS/MSS signals may generate during choppy, sideways price action.
Repainting: While the signals are non-repainting once confirmed, the live candle may flash a signal before the close if “Close” mode is selected.
💡 What Makes This Unique
Interactive Learning: The inclusion of tooltip explanations transforms this from a simple tool into an active mentor.
Phase-Based Workflow: The ability to strip the chart back to basics at the click of a button is unique to the PhenLabs ecosystem.
🔬 How It Works
Swing Analysis: The script calculates pivot highs and lows based on your length input to define the structural landscape.
Break Validation: It checks if price crosses these pivot points to trigger BOS (Continuation) or MSS (Reversal) logic.
Volume Confirmation: For Order Blocks, it looks back inside the swing leg to find the specific candle responsible for the move, verifying it has significant volume.
💡 Note:
For the best experience, start in Phase 1 to calibrate your Swing Detection Length to the specific volatility of the asset you are trading before enabling Full Strategy Mode.

Elev8+ Impulse LevelsElev8+ Impulse Levels | Smart Support & Resistance
Ever notice price rejecting “empty” areas on the chart—like it remembered something that isn’t obvious?
That “something” is often Institutional Impulse : footprints left behind by large, aggressive moves that get defended again days or weeks later .
Elev8+ Impulse Levels automatically detects these moments and projects the most important prices forward so you can see the structure most traders miss.
— — —
🧠 How It Works (The Logic)
This is not a typical support/resistance tool. It does not hunt swing highs/lows.
It looks for Market Intent —the “Perfect Storm” when two conditions align:
Volume Spike — buying/selling pressure significantly exceeds average volume (multiplier-based).
Volatility Expansion — the candle body is unusually large relative to recent ATR.
When both occur, the script marks the event and treats the impulse close as a key “line in the sand” that can influence future reactions.
— — —
🎯 How to Use These Levels
The script includes a Smart Line behavior that changes level styling based on how price interacts with it—so you can quickly separate two core setups:
1) The Defense (Bounce)
Visual: 🟢 Solid line (Fresh / Untouched)
What it means: Price has not yet traded through or “invalidated” the level.
What to look for: First return to the level → rejection / bounce behavior.
Why it matters: Large players often defend prior entries; first tests can react sharply.
2) The Flip (Break & Retest)
Visual: ◌ Dotted line (Broken / Re-priced)
What it means: A candle has closed through the level.
What to look for: Price returns to the dotted level from the other side (“kiss”) → continuation.
Why it matters: Broken support can act as resistance (and vice versa), similar to a breaker concept.
— — —
✨ Key Features
Smart Visualization — levels automatically transition from solid → dotted when broken to reduce chart noise.
Impulse Candle Highlighting — see the exact candle that created the level (origin clarity).
Fully Customizable Sensitivity — tune volume + size thresholds for Crypto, Forex, Futures, or Stocks.
— — —
🚀 The Elev8+ Workflow
Think of Impulse Levels as your map : it shows where reactions are most likely.
For entry timing, pair it with Elev8+ Pro Reversal to confirm the moment price reacts at these high-value zones.
— — —
Disclaimer: Trading involves risk. This tool is for educational/technical analysis purposes only and does not guarantee future results.

FVG Heatmap [Hash Capital Research]FVG Map
FVG Map is a visual Fair Value Gap (FVG) mapping tool built to make displacement imbalances easy to see and manage in real time. It detects 3-candle FVG zones, plots them as clean heatmap boxes, tracks partial mitigation (how much of the zone has been filled), and summarizes recent “fill speed” behavior in a small regime dashboard.
This is an indicator (not a strategy). It does not place trades and it does not publish performance claims. It is a market-structure visualization tool intended to support discretionary or systematic workflows.
What this script detects
Bullish FVG (gap below price)
A bullish FVG is detected when the candle from two bars ago has a high below the current candle’s low.
The zone spans from that prior high up to the current low.
Bearish FVG (gap above price)
A bearish FVG is detected when the candle from two bars ago has a low above the current candle’s high.
The zone spans from the current high up to that prior low.
What makes it useful
Heatmap zones (clean, readable FVG boxes)
Bullish zones plot below price. Bearish zones plot above price.
Partial fill tracking (mitigation progress)
As price trades back into a zone, the script visually shows how much of the zone has been filled.
Mitigation modes (your definition of “filled”)
• Full Fill: price fully trades through the zone
• 50% Fill: price reaches the midpoint of the zone
• First Touch: price touches the zone one time
Optional auto-cleanup
Optionally remove zones once they’re mitigated to keep the chart clean.
Fill-Speed Regime Dashboard
When zones get mitigated, the script records how many bars it took to fill and summarizes the recent environment:
• Average fill time
• Median fill time
• % fast fills vs % slow fills
• Regime label: choppy/mean-revert, trending/displacement, or mixed
How to use
Use FVG zones as structure, not guaranteed signals.
• Bullish zones are often watched as potential support on pullbacks.
• Bearish zones are often watched as potential resistance on rallies.
The fill-speed dashboard helps provide context: fast fills tend to appear in more rotational conditions, while slow fills tend to appear in stronger trend/displacement conditions.
Alerts
Bullish FVG Created
Bearish FVG Created
Notes
FVGs are not guaranteed reversal points. Fill-speed/regime is descriptive of recent behavior and should be treated as context, not prediction. On realtime candles, visuals may update as the bar forms.

Order Block Finder [MHA Finverse]A comprehensive order block detection indicator that identifies institutional buying and selling zones with advanced volume filtering and King Order Block (KOB) detection.
Key Features
Dual Structure Detection
- Internal Order Blocks: Short-term zones based on 5-bar pivots for precise entries
- Swing Order Blocks: Higher timeframe zones based on 50-bar pivots for major support/resistance levels
- Toggle between structures or display both simultaneously
King Order Block (KOB)
The indicator automatically identifies the order block with the highest volume and marks it as the "King Order Block" - typically the most significant institutional zone that deserves priority attention. You can optionally color-code KOB blocks differently for instant visual recognition.
Intelligent Volume Filtering
Uses ATR or Cumulative Mean Range to filter out low-quality blocks and focus only on institutional-sized moves. This ensures you're trading zones where smart money has left clear footprints.
Volume Metrics Display
Each order block shows its actual volume and percentage contribution, helping you prioritize which zones to trade. Higher volume blocks indicate stronger institutional interest.
Flexible Lookback Periods
Choose from preset trading styles (Scalping: 50 bars, Day Trading: 150 bars, Swing Trading: 400 bars, Position Trading: 750 bars) or set custom lookback periods to match your strategy.
Advanced Mitigation Options
Select between Close or High/Low mitigation methods to control when order blocks are considered invalidated.
King Order Block (KOB)
The King Order Block is the order block with the highest volume among all active blocks on your chart. It represents the zone where the largest institutional activity occurred, making it the most significant level for potential reversals. When multiple order blocks are present, the KOB should be your primary focus as it typically offers higher probability setups. The indicator automatically identifies and marks the KOB with a special label, and you can optionally color-code it differently for instant visual recognition. KOB zones often produce stronger reactions when price returns to test them, allowing for more confident entries with tighter stop losses.
How to Use
1. For Short-Term Trading: Enable Internal Order Blocks to identify quick reversals and entries on lower timeframes.
2. For Position Trading: Enable Swing Order Blocks to find major institutional zones on higher timeframes.
3. Focus on KOB: When multiple blocks appear, prioritize the King Order Block as it represents the highest volume zone.
4. Volume Confirmation: Check the volume metrics - blocks with 30%+ volume contribution are typically stronger zones.
5. Entry Strategy: Wait for price to return to an order block, look for rejection signals (pin bars, engulfing patterns), then enter with stops below/above the block.
6. Adjust Lookback: Match the lookback period to your trading timeframe for optimal block visibility.
Color Themes
- Colored Mode: Distinct colors for bullish/bearish and internal/swing blocks
- Monochrome Mode: Professional grayscale palette for clean charts
Alert System
Comprehensive alerts for:
- Order block creation (internal/swing, bullish/bearish)
- Order block mitigation
- King Order Block events
Perfect for traders who follow Smart Money Concepts (SMC), institutional order flow, and supply/demand zones.
Disclaimer
This indicator is for educational and informational purposes only. It does not constitute financial advice or trading recommendations. Past performance does not guarantee future results. Always conduct your own analysis, use proper risk management, and never risk more than you can afford to lose. Trading involves substantial risk of loss.

Elev8+ Impulse Levels | Smart Support & ResistanceElev8+ Impulse Levels | Smart Support & Resistance
Ever notice price rejecting “empty” areas on the chart—like it remembered something that isn’t obvious?
That “something” is often Institutional Impulse : footprints left behind by large, aggressive moves that get defended again days or weeks later .
Elev8+ Impulse Levels automatically detects these moments and projects the most important prices forward so you can see the structure most traders miss.
— — —
🧠 How It Works (The Logic)
This is not a typical support/resistance tool. It does not hunt swing highs/lows.
It looks for Market Intent —the “Perfect Storm” when two conditions align:
Volume Spike — buying/selling pressure significantly exceeds average volume (multiplier-based).
Volatility Expansion — the candle body is unusually large relative to recent ATR.
When both occur, the script marks the event and treats the impulse close as a key “line in the sand” that can influence future reactions.
— — —
🎯 How to Use These Levels
The script includes a Smart Line behavior that changes level styling based on how price interacts with it—so you can quickly separate two core setups:
1) The Defense (Bounce)
Visual: 🟢 Solid line (Fresh / Untouched)
What it means: Price has not yet traded through or “invalidated” the level.
What to look for: First return to the level → rejection / bounce behavior.
Why it matters: Large players often defend prior entries; first tests can react sharply.
2) The Flip (Break & Retest)
Visual: ◌ Dotted line (Broken / Re-priced)
What it means: A candle has closed through the level.
What to look for: Price returns to the dotted level from the other side (“kiss”) → continuation.
Why it matters: Broken support can act as resistance (and vice versa), similar to a breaker concept.
— — —
✨ Key Features
Smart Visualization — levels automatically transition from solid → dotted when broken to reduce chart noise.
Impulse Candle Highlighting — see the exact candle that created the level (origin clarity).
Fully Customizable Sensitivity — tune volume + size thresholds for Crypto, Forex, Futures, or Stocks.
— — —
🚀 The Elev8+ Workflow
Think of Impulse Levels as your map : it shows where reactions are most likely.
For entry timing, pair it with Elev8+ Pro Reversal to confirm the moment price reacts at these high-value zones.
— — —
Disclaimer: Trading involves risk. This tool is for educational/technical analysis purposes only and does not guarantee future results.

Dynamic Multi-Timeframe SMAs (Brian Shannon Style)Overview : This indicator implements the logic of Brian Shannon's "Multi-Timeframe Analysis" on intraday charts. It automatically calculates the correct length for the 5-Day and 50-Day Simple Moving Averages (SMA), regardless of the timeframe (e.g., 5m, 15m, 1h) you are viewing.
How it works Standard SMAs only count bars. A "50 SMA" on a 5-minute chart only looks back ~4 hours. This script dynamically calculates how many bars represent full trading days.
Features:
Asset Class Selector : Choose between Crypto (24/7) and Stocks (6.5h US Session) to ensure correct minute-per-day calculations.
Info Table : Displays exactly how many bars are being used for the calculation in real-time.

Scalp Logic Pro [Institutional]**MASTER SCALPING WITH INSTITUTIONAL PRECISION.**
Forget complex settings. **Scalp Logic Pro ** is a "Turnkey" system, specifically optimized for traders seeking absolute clarity on **Short Timeframes**.
Unlike standard indicators, our proprietary logic focuses on **Dynamic Structure Anchoring**.
**THE REAL SECRET:**
Most traders fail because they fight the macro flow. This system projects the strength zones from **Higher Timeframes** directly onto your execution chart in real-time, eliminating the need to constantly switch screens.
**WHAT YOU GET:**
🚀 **The Dynamic Shield:** The colored lines act as a trend heatmap. They visually reveal where institutional flow is positioned and where the trend is being dynamically defended.
🎯 **Liquidity Zones (Auto-Levels):** The system automatically plots relevant Highs and Lows from previous periods. These serve as clear visual references to identify where liquidity is sitting.
🚦 **Sync Dashboard:** A tactical panel that monitors trend health across multiple timeframes, helping you avoid trading against the dominant market force.
**WHY THIS SCRIPT?**
In Scalping, clarity is power. **Scalp Logic Pro** removes chart noise and highlights only the logical price structure, allowing for fast and objective decision-making.
---
*Best for: Day Trading Indices, Stocks, and Crypto.*
*Disclaimer: Technical analysis tool. Past performance does not guarantee future results.*
*Proprietary premium tool released to the community for free (Limited Time Offer).

DAISOB Q3Description: SMC , ICT, FVG, Fair Value Gap
Strategy, Non Repainting
Overview This strategy is designed for precision trading based on Smart Money Concepts (SMC) and Fair Value Gaps (FVG). It acts as a "Sniper" tool: it identifies high-probability institutional levels on Higher Timeframes (HTF) while allowing you to execute entries on Lower Timeframes (LTF) with strict confirmation logic.
The core philosophy of this script is Stability & Precision. Unlike many FVG indicators that repaint or flicker during candle formation, this strategy uses strict bar_index confirmation. An FVG is only drawn and valid after the candle has fully closed, ensuring that what you see on the chart is permanent and backtestable.
Key Features
🚀 Auto-Timeframe Pairing (Dynamic HTF) Forget about manually changing settings. The strategy automatically detects your current chart timeframe and scans for FVGs on a specific higher timeframe to ensure you are trading with the trend.
1m Chart → Scans 15m FVGs.
5m Chart → Scans 30m FVGs.
15m Chart → Scans 1H FVGs.
30m Chart → Scans 4H FVGs. (You can also disable this and set a manual fixed timeframe).
🛡️ Zero Repainting (Hard Confirmation) The script utilizes lookahead_off and references historical closed candles ( , ). An FVG box will only appear once the formation is mathematically confirmed and the candle is closed.
⚡ Smart Alerts (Pre-Entry Focus) Instead of spamming you with signals, the script includes a "Pre-Entry" mechanism.
"P" Label: Appears when price approaches the FVG (95% retracement).
Alerts: You can set alerts specifically for this Pre-Entry phase, giving you time to prepare for the trade before the actual execution.
🎯 Q3 Time Logic The strategy filters for FVGs formed only during high-volatility "Q3" windows (New York Session specific times), filtering out low-probability setups during off-hours.
🔥 One Trade Per FVG To prevent over-trading, once an FVG has generated a signal (Win or Loss), it is marked as "Used" (dashed line) and will not generate further signals.
How to Use
Set Up: Open your chart on a low timeframe (e.g., 1m or 5m).
Configuration: Ensure "Use Fixed TF Pairs" is enabled in the settings.
Wait for "P": When price approaches a valid FVG, a gray "P" (Pre-Entry) label will appear. This is your "Get Ready" signal.
Entry Execution:
LONG: Price must touch the bottom of the Bullish FVG and close inside/above it.
SHORT: Price must touch the top of the Bearish FVG and close inside/below it.
Visual Results: The script draws a Green box (Profit) or Red box (Loss) representing the trade outcome based on your SL/TP settings.
Settings
Risk Reward Ratio: Define your target (default 1:2.5).
Stop Loss Points: Fixed point stop loss.
Pre-Entry %: Distance from the FVG to trigger the "P" warning.
Time Filters: Adjust the Q3 hours if needed.
Disclaimer This tool is for educational and analytical purposes only. Past performance does not guarantee future results. Always manage your risk properly.

Institutional Trap & Reversal - ASR [Premium]Institutional Trap & Reversal - ASR
Stop Being Liquidity for Smart Money.
The Institutional Trap & Reversal indicator is a professional-grade detection system designed to expose one of the most profitable setups in the market: The Fakeout .
Retail traders are conditioned to chase high-momentum breakouts. Institutions exploit this behavior—engineering strong-looking moves to generate liquidity before aggressively reversing price. This algorithm detects that specific "Institutional Footprint" in real-time, allowing you to trade with the market makers, not against them.
💎 The Premium Advantage
Unlike lagging indicators that tell you what just happened, the Institutional Trap algorithm is reactive . It identifies the precise moment of "Exhaustion," where a breakout attempt fails despite significant effort, signaling a high-probability reversal.
🛡️ Protect Your Capital: Automatically filters out "Bull/Bear Traps" that often mark the absolute top or bottom of a trend.
🧠 Black-Box Logic: Uses a proprietary fusion of Volume Spread Analysis (VSA) and Advanced Price Action Geometry to validate every signal.
Zero Guesswork: No complex lines or clouds to interpret. You get clean, definitive execution signals directly on your chart.
🔥 Exclusive Features
1. Precision Signal Engine
🟥 SHORT TRAP: Detects where buyers have been lured in and trapped at the highs.
🟩 LONG TRAP: Detects where sellers have been exhausted and trapped at the lows.
2. Adaptive Sensitivity Profiles (NEW) Every market moves differently. This script features a proprietary Sensitivity Tuner that lets you adapt the algorithm to the specific "personality" of the asset you are trading.
Settings range from "Extreme Low" to "Extreme".
Trading Volatile Crypto? Set it to Extreme to filter only the most massive liquidity grabs.
Trading Stable Forex? Set it to Low to catch subtler institutional footprints.
Optimization is in your hands, without needing to know the complex math behind it.
3. Pattern Precision Control Fine-tune how strictly the algorithm defines a "reversal pattern."
Strict Mode: Filters for only the most textbook, high-conviction rejection candles.
Loose Mode: Allows for broader pattern recognition to capture early trend shifts.
How to Use
Select Your Profile: Adjust the Sensitivity setting to match your asset's volatility (e.g., use "Normal" for Stocks, "Extreme" for Altcoins).
Wait for the Signal: A Triangle labeled "TRAP" appears when the fakeout is confirmed.
Execute: Enter in the direction of the signal (Green for Buy, Red for Sell). The "Trap" confirms that traders on the wrong side are now forced to cover, fueling your trade.
🔒 Access & Pricing
This is an Invite-Only script containing proprietary trading logic.
How to Get Instant Access:
Make Payment: email for details - quantflowbusiness@gmail.com
Submit Details: Fill out this simple form with your TradingView Username and Payment Screenshot: forms.gle
Activation: Access is granted manually within 1–6 hours. You will receive a notification on TradingView once active.
Note: Please ensure you provide the correct TradingView Username so we can whitelist you immediately.
Stop guessing. Start seeing the trap.

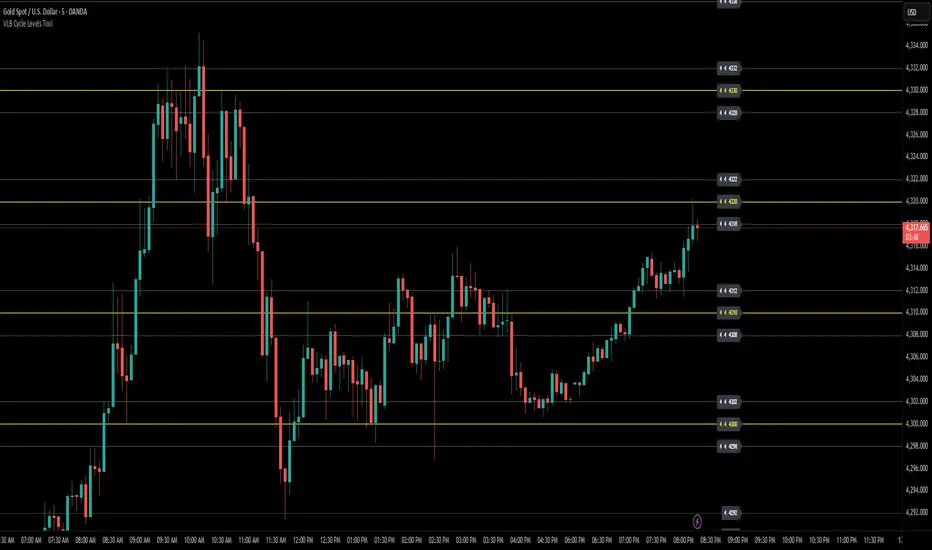
VLB Cycle Levels Tool Structural Cycle Mapping for XAUUSDThe VLB Cycle Levels Tool provides a visual framework for examining structural cycles on XAUUSD.
It displays automatically generated levels based on a rules-based approach, allowing traders to observe how price interacts with recurring structural areas over time.
The tool adapts as market structure evolves, updating its levels when new highs or lows form.
Its purpose is to offer a clear, consistent view of structural cycles so users can incorporate these reference points into their independent chart analysis.
Features:
Automatically generated structural cycle levels
Dynamic updates as market structure develops
Neutral, non-predictive visualization
Clear reference zones for studying price behavior
This tool does not generate trading signals, provide timing information, or offer predictive analysis.
It simply organizes price structure into visual reference points that may assist users in their own interpretation and decision-making process.
Users remain fully responsible for their analysis, timing, and risk management.
The VLB Cycle Levels Tool is intended for traders who prefer an objective way to observe structural cycles and level-based behavior on XAUUSD as market conditions change.
VLB Dynamic Levels Tool Structural Mapping for XAUUSDThe VLB Dynamic Levels Tool provides a visual framework for observing price structure on XAUUSD.
It displays automatically generated levels based on a rules-based approach, allowing traders to study how price interacts with important reference areas on the chart.
The tool updates dynamically as market structure evolves, reflecting changes in price movement without requiring manual redrawing.
Its purpose is to offer a clear, consistent layout of structural levels that users can incorporate into their own market analysis.
Features:
Automatically displayed structural reference levels
Dynamic recalculation as new highs and lows form
Neutral, non-predictive visual layout
A consistent framework for studying price behavior
This tool does not generate trading signals or provide predictive information.
It simply organizes price structure into visual reference points that may assist users in their independent chart analysis.
Traders remain fully responsible for their own interpretation, timing, and risk management.
The VLB Dynamic Levels Tool is intended for those who prefer a clean and adaptable way to observe XAUUSD structure throughout changing market conditions.

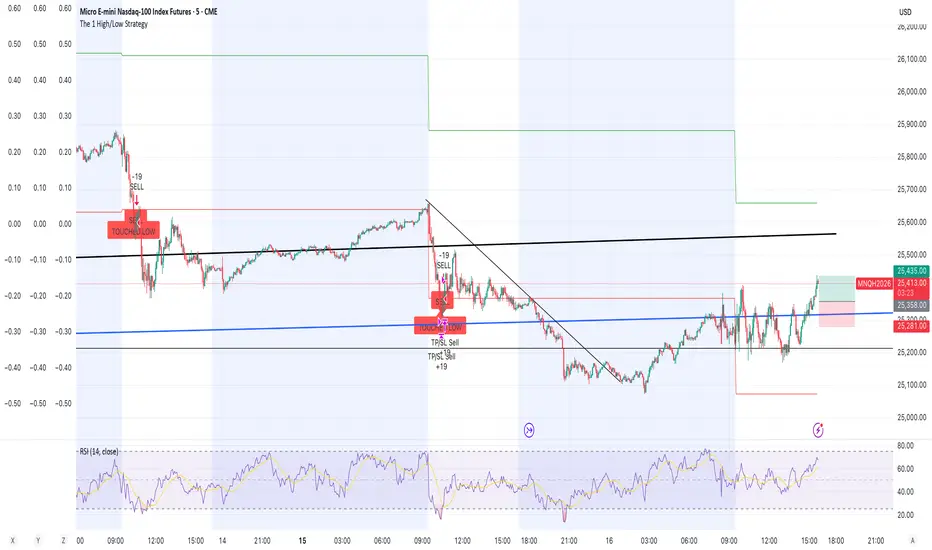
The 1 High/Low StrategyThis strategy takes advantage of price Support and Resistance at High and Low level points of the day to enter high Risk to Reward positions with a high win rate.
Malama's PRE-Market Box Overview
Malama's PM Box is a clean, professional pre-market range indicator that tracks the entire pre-market session (default 04:00–09:30 EST), draws a dynamic box during pre-market hours, and automatically extends clean high/low reference lines into the regular trading session. Upon breakout of these levels during regular hours, it optionally displays clear "BREAK" labels and fires alerts — making it ideal for day traders focusing on pre-market range breakouts.
Key Features
Dynamic Pre-Market Box: A real-time updating box that visually represents the developing pre-market high and low range, with customizable fill color, border, and transparency.
Extended Support & Resistance Lines: At the start of regular trading hours (09:30), the final pre-market high (resistance) and low (support) are locked in and extended as horizontal lines across the chart for the entire day.
Breakout Signals: Optional on-chart "BREAK" labels (green upward for bullish, red downward for bearish) when price closes beyond the pre-market high or low during regular hours.
Alerts: Built-in alert conditions for bullish breakouts (above PM high) and bearish breakdowns (below PM low).
Clean & Efficient Drawing: Uses Pine Script boxes and lines for smooth visuals and performance; lines extend automatically until the next trading day.
Major Differences & Improvements from the Older "Malama's KAYCAP Pre-Market Box"
The older script focused on isolating a single specific candle (default 4:00 AM) and plotting its body and wick levels separately. This new version represents a complete evolution into a full pre-market range tool with the following key upgrades:
Full Session Range vs. Single Candle:
Old: Captured only one user-defined minute/candle (e.g., exactly 4:00).
New: Tracks the entire pre-market session (default 04:00–09:30) and continuously updates the true session high/low.
Visual Presentation:
Old: Four separate plots (body top/bottom, high/low) with basic fill.
New: Single professional box with customizable fill/transparency/border during pre-market, plus clean extended horizontal lines after market open.
Extension & Persistence:
Old: Static plots that did not extend or update dynamically.
New: Lines automatically extend rightward throughout the regular session and reset cleanly each day.
Breakout Detection & Signaling:
Old: No breakout logic or alerts.
New: Detects true breakout/breakdown candles during regular hours, with optional visual labels and dedicated alert conditions.
User Experience:
Old: Required manual configuration of exact minute and separate pre-market session inputs (unused in logic).
New: Simplified session input using TradingView's built-in session string, fewer inputs overall, and more intuitive grouping.
In essence, the older version was a niche tool for analyzing one specific pre-market candle's structure, while PM Box (Visual Pro) is a modern, practical day-trading utility focused on the classic pre-market high/low range strategy with superior visuals, automation, and breakout signaling.
How to Use
Apply to 1-minute or 5-minute charts on US stocks or indices with pre-market data.
Default session (04:00–09:30) captures standard US pre-market; adjust if your broker uses a different timezone.
Watch the box develop live during pre-market.
Once regular hours begin, use the extended high (resistance) and low (support) lines as key levels.
Trade breakouts/breakdowns when price closes beyond these lines (confirmed by labels and alerts).
Combine with volume, trend filters, or other confluence for higher-probability setups.
Disclaimer
This indicator is for educational and informational purposes only. It is not financial advice. Past performance does not guarantee future results. Always use proper risk management and combine with your own analysis. Trading involves substantial risk of loss.

NY ORB, VWAP & EMAsThis release introduces powerful new features focused on session analysis, trade alerts, and clear market visualization to help you better frame the trading day.
✨ New Features
1. Automated Trading Session Identification
The indicator now automatically identifies and highlights two key market periods:
Asian Session High/Low Tracking: Automatically tracks and plots the High and Low prices established during the Asian Trading Session (5:00 PM – 2:00 AM PST). These levels provide critical reference points for potential support and resistance during subsequent sessions.
Power Hour Visualization: A subtle green background highlight is now applied to the chart during the "Power Hour" (6:00 AM – 9:30 AM PST). This visually marks the high-volatility period immediately following the New York Open, helping traders focus on active price action.
⚙️ Technical Changes
Plot Style: The plots for the "Asian High" and "Asian Low" are now plotted using circles (plot.style_circles) for clear visibility and differentiation from standard lines.

Whale Flow PRO [Institutional Grade Trend System]Whale Flow PRO is an advanced market analysis algorithm designed to align retail traders with institutional liquidity cycles. Unlike standard lagging indicators, Whale Flow focuses on detecting the underlying phase of the market: Liquidity Building (Consolidation) vs. Institutional Expansion (Whale Runs).
This tool was engineered to solve the biggest problem in trading: getting trapped in choppy markets ("Whipsaws") and missing the true explosive moves.
⚙️ How It Works
The algorithm utilizes a proprietary volatility-adjusted volume model combined with dynamic price-action pivots. By analyzing the rate of change relative to historical volatility compression, the script identifies key "Pivot Lines" where liquidity is likely to flow.
Trend Filtering: It automatically filters out noise by calculating a custom "Consolidation Index". When the market is in a building phase, signals are suppressed to protect capital.
Whale Runs: When volatility expands beyond a specific threshold in the direction of the dominant trend, the system triggers a "Whale Run" mode, signaling high-probability entry zones.
📊 Key Features
Smart Dashboard (HUD): A real-time professional panel displaying the current Trend Direction, Market Phase (Run vs. Build), and active Pivot Levels.
Dynamic Heatmap: A visual ribbon at the bottom of the chart that tracks the historical strength of the trend flow.
Context-Aware Coloring:
Neon Green: Confirmed Bullish Flow (Whale Run).
Neon Red: Confirmed Bearish Flow (Dump).
Silver/Gray: Consolidation Zone (Safety Mode - No Trades).
Protection System: The "Liquidity Build" filter prevents entries during sideways movement, significantly increasing the win rate of the signals.
🔒 Access
This is an Invite-Only script dedicated to professional traders and community members. It is strictly protected to maintain the edge of its users.
To obtain access: Please visit the link in my signature or send me a private message (PM) here on TradingView for licensing details.
Disclaimer: This tool is for informational purposes only and does not constitute financial advice. Past performance (even of whales) is not indicative of future results.


Liquidity Levels Pro Tool - thewallranka
Liquidity Levels Pro Tool is a market-structure and liquidity-mapping indicator designed to help discretionary futures and index traders identify statistically relevant price levels where reactions, continuations, or liquidity sweeps are more likely to occur.
This script is a decision-support tool, not a signal generator. It does not issue buy/sell alerts or predict future price movement. Instead, it organizes and scores liquidity information so traders can make their own contextual decisions.
What this indicator does
The script continuously detects and maintains liquidity zones derived from price pivots, then evaluates those zones using multiple structural and contextual factors:
Repeated price interaction (touches)
Freshness (time since last interaction)
Confluence with key reference levels
Reaction behavior after contact
Session relevance (RTH vs overnight)
Market regime (trend vs mean reversion)
Time-of-day effects (open, midday, power hour)
Only the most relevant zones—based on a dynamic scoring system—are displayed to reduce chart clutter and focus attention on levels that have historically mattered.
Core components
1. Liquidity Zones
Zones are built from pivot highs and lows and expanded into areas using a configurable tick-based padding. Nearby zones are merged to avoid redundancy.
Each zone is continuously evaluated and assigned a score (0–100) reflecting its relative importance.
2. Zone Scoring (No Lookahead)
Zone scores are based on:
Number of confirmed interactions
Recency of the last touch
Confluence with prior day/week levels, VWAP, and Opening Range
Reaction quality after touches (speed and follow-through)
Session alignment (zones that “work” in the current session are favored)
Penalties after liquidity sweeps
Zones are not forward-looking and do not rely on future data.
3. Context Engine
The script classifies the current environment using VWAP slope and distance:
Trend (up or down)
Mean reversion
Mixed/transition
Time-of-day context (Open, Midday, Power Hour) is also tracked internally and influences zone scoring.
This context is displayed in the HUD to support situational awareness, not automated decisions.
4. Liquidity Sweeps
Optional sweep detection highlights situations where price trades beyond a zone and closes back inside, indicating potential stop runs or failed breakouts.
Sweeps are rate-limited and applied conservatively to avoid visual noise.
5. Trade Planning Levels (Optional)
When enabled, the script highlights the nearest high-quality liquidity level above and below price based on score thresholds.
These are intended as reference targets, not trade entries or exits.
HUD (Heads-Up Display)
The on-chart HUD summarizes:
Key reference levels (prior day/week, Opening Range)
Nearest strong liquidity above/below price
Market regime and time-of-day context
Distance to levels (ticks or points)
The HUD is fully optional, positionable, and includes resizable modes (Small / Medium / Large) to fit different chart layouts.
How to use this tool
This indicator is best used as part of a discretionary trading process, for example:
Identifying areas where price is more likely to react or pause
Framing trades around higher-quality structure instead of arbitrary levels
Filtering setups based on session and regime context
Managing expectations near known liquidity rather than chasing price
It is intentionally designed not to provide trade signals.
Limitations and important notes
This script does not predict outcomes or guarantee reactions
High-scoring zones can still fail
Liquidity behavior is context-dependent and probabilistic
No performance claims or backtested results are provided
The indicator should not be used in isolation
Past behavior does not imply future results.
Chart and usage notes
The script is intended for standard time-based charts
Recommended for liquid futures and index products
Use a clean chart for clarity when publishing or sharing
No external indicators are required
Final note
Liquidity Levels Pro (Tool) — v6 is designed to organize complex market structure into a clear, readable framework, allowing traders to focus on execution and risk management rather than raw level detection.
This script reflects an analytical approach to intraday liquidity and structure, not an automated trading system.

Hitjo Zones TFTL;DR – READ THIS FIRST
This is a TWO-INDICATOR SYSTEM. Both indicators must be used together.
Hitjo Zones TF = WHERE you are allowed to trade
Hitjo Swing Trend = WHEN you are allowed to trade
Rules:
Only take BUY signals from Hitjo Swing Trend inside DEMAND zones from Hitjo Zones TF
Only take SELL signals from Hitjo Swing Trend inside SUPPLY zones from Hitjo Zones TF
Ignore signals when structure and timing do not align
Recommended setup: 1H chart with 4H or Daily zones.
Hitjo Swing Trading System
(Hitjo Zones TF + Hitjo Swing Trend)
This TradingView system combines higher-timeframe Supply & Demand zones with momentum-based swing entries to create a clean, rule-based swing trading framework.
It is designed for traders who want fewer but higher-quality trades, clear market structure, objective entry timing, and reduced overtrading.
Required Indicators
Hitjo Zones TF (Structure)
Automatically draws Supply & Demand zones using a selectable higher timeframe.
Displays SUPPLY and DEMAND labels when price enters key zones.
Defines where trades are allowed.
Do not trade based on zones alone.
Hitjo Swing Trend (Timing)
Displays BUY and SELL labels using EMA structure, momentum, and higher-timeframe trend.
Plots ATR-based stop loss and target levels.
Defines when to enter trades.
Do not take BUY or SELL signals outside zones.
Core Concept
Hitjo Zones TF tells you WHERE to trade.
Hitjo Swing Trend tells you WHEN to trade.
If both are not aligned, there is no trade.
Trading Rules
Long Trades
Take a BUY only when all conditions are true:
Price is inside or just above a DEMAND zone from Hitjo Zones TF
Higher-timeframe trend is bullish
A BUY label appears from Hitjo Swing Trend
There is room to target without immediately hitting resistance
Short Trades
Take a SELL only when all conditions are true:
Price is inside or just below a SUPPLY zone from Hitjo Zones TF
Higher-timeframe trend is bearish
A SELL label appears from Hitjo Swing Trend
There is room to target without immediately hitting support
Common Mistakes to Avoid
Buying just because DEMAND appears
Selling just because SUPPLY appears
Taking BUY or SELL signals in the middle of the chart
Counter-trend trading
Forcing trades on every signal
Stops and Targets
Hitjo Swing Trend plots:
Stop Loss using ATR (red)
Target using ATR (green)
These are visual guides only, not broker orders.
Recommended Setup
Chart timeframe: 1H
Zone timeframe (Hitjo Zones TF): 4H or Daily
Fast / Slow EMA: 8 / 21
ATR Stop / Target: 1.5 / 3.0
Remember This
DEMAND does not mean BUY
SUPPLY does not mean SELL
DEMAND + BUY = Long
SUPPLY + SELL = Short
Disclaimer
This system does not predict tops or bottoms and does not guarantee profits.
It is designed to help traders wait for alignment, reduce low-quality trades, and trade with structure.
Always manage risk appropriately.
TradingView Search Keywords
Supply Demand
Swing Trading
EMA Strategy
Multi Timeframe
Trend Following
Support Resistance
Momentum Trading
ATR Stop Loss
Crypto Trading
Stock Trading

Hybrid Strategy: Trend/ORB/MTFHybrid Strategy: Trend + ORB + Multi-Timeframe Matrix
This script is a comprehensive "Trading Manager" designed to filter out noise and identify high-probability breakout setups. It combines three powerful concepts into a single, clean chart interface: Trend Alignment, Opening Range Breakout (ORB), and Multi-Timeframe (MTF) Analysis.
It is designed to prevent "analysis paralysis" by providing a unified Dashboard that confirms if the trend is aligned across 5 different timeframes before you take a trade.
How it Works
The strategy relies on the "Golden Trio" of confluence:
1. Trend Definition (The Setup) Before looking for entries, the script analyzes the immediate trend. A bullish trend is defined as:
Price is above the Session VWAP.
The fast EMA (9) is above the slow EMA (21). (The inverse applies for bearish trends).
2. The Signal (The Trigger) The script draws the Opening Range (default: first 15 minutes of the session).
Buy Signal: Price breaks above the Opening Range High while the Trend is Bullish.
Sell Signal: Price breaks below the Opening Range Low while the Trend is Bearish.
3. The Confirmation (The Filter) A signal is only valid if the Higher Timeframe (default: 60m) agrees with the direction. If the 1m chart says "Buy" but the 60m chart is bearish, the signal is filtered out to prevent false breakouts.
Key Features
The Matrix Dashboard A zero-lag, real-time table in the corner of your screen that monitors 5 user-defined timeframes (e.g., 5m, 15m, 30m, 60m, 4H).
Trend: Checks if Price > EMA 21.
VWAP: Checks if Price > VWAP.
ORB: Checks if Price is currently above/below the Opening Range of that session.
D H/L: Warns if price is near the Daily High or Low.
PD H/L: Warns if price is near the Previous Daily High or Low.
Visual Order Blocks The script automatically identifies valid Order Blocks (sequences of consecutive candles followed by a strong explosive move).
Chart: Draws Green/Red zones extending to the right, showing where price may react.
Dashboard: Displays the exact High, Low, and Average price of the most recent Order Blocks for precision planning.
Risk Management (Trailing Stop) Once a trade is active, the script plots Chandelier Exit dots (ATR-based trailing stop) to help you manage the trade and lock in profits during trend runs.
Visual Guide (Chart Legend)
⬜ Gray Box: Represents the Opening Range (first 15 minutes). This is your "No Trade Zone." Wait for price to break out of this box.
🟢 Green Line: The Opening Range High. A break above this line signals potential Bullish momentum.
🔴 Red Line: The Opening Range Low. A break below this line signals potential Bearish momentum.
🟢 Green / 🔴 Red Zones (Boxes): These are Order Blocks.
🟢 Green Zone: A Bullish Order Block (Demand). Expect price to potentially bounce up from here.
🔴 Red Zone: A Bearish Order Block (Supply). Expect price to potentially reject down from here.
⚪ Dots (Trailing Stop):
🟢 Green Dots: These appear below price during a Bullish trend. They represent your suggested Stop Loss.
🔴 Red Dots: These appear above price during a Bearish trend.
🏷️ Buy / Sell Labels:
BUY: Triggers when Price breaks the Green Line + Trend is Bullish + HTF is Bullish.
SELL: Triggers when Price breaks the Red Line + Trend is Bearish + HTF is Bearish.
Settings
Session: Customizable RTH (Regular Trading Hours) to filter out pre-market noise.
Matrix Timeframes: 5 fixed slots to choose which timeframes you want to monitor.
Order Blocks: Adjust the sensitivity and lookback period for Order Block detection.
Risk: Customize the ATR multiplier for the trailing stop.
Disclaimer
This tool is for educational purposes only. Past performance does not guarantee future results. Always manage your risk properly.

Box Indicator - Auto Draw Previous Day's - High / Midline / LowThis indicator draws a box around the previous day’s high and low, calculates the midline, and displays them on the current day’s chart. It helps visualize key support/resistance levels from the prior trading day.
This script gives you a static reference box from the prior day’s trading range, including a midpoint. It’s useful for spotting potential reversal zones, breakout levels, or intraday targets based on yesterday’s price action.

Session ATR Progression Tracker📊 Session ATR Progression Tracker - SIYL Regression Trading Tool
Track how much of your instrument's 7-day Average True Range (ATR) has been covered during the current trading session. This indicator is specifically designed for regression traders who follow the "Stay In Your Lane" (SIYL) methodology, helping you identify when the probability of mean reversion significantly increases. If you are interested in more on that check out Rod Casselli and tradersdevgroup.com.
🎯 Key Features:
• Real-time ATR Coverage Percentage - See at a glance what percentage of the 7-day ATR has been covered in the current session
• SIYL-Optimized Thresholds - See at a glance when the instrument has achieved 80% and 100% ATR coverage, the proven thresholds where mean reversion probability increases (customizable)
• Flexible Session Modes:
- Daily: Resets at calendar day change
- Session: Uses exchange-defined trading sessions
- Custom Session: Set your exact session start/end times (perfect for futures traders and international markets)
• Visual Alerts - Color-coded display (gray → orange → red) and optional background highlighting
• Repositionable Display - Choose from 9 screen positions to avoid chart clutter
• Session Markers - Green triangles mark the start of each new session
• Detailed Stats - View current range, ATR value, session high/low, and session status
💡 Why Use This Indicator?
This tool is built around a proven concept: regression trading becomes significantly more effective once a session has achieved at least 80% of its 7-day ATR. At this threshold, the probability of price reverting to mean increases substantially, creating higher-probability trade setups for SIYL practitioners.
Benefits for regression traders:
- Identify optimal entry points when mean reversion probability is highest (≥80% ATR coverage)
- Avoid premature regression entries before adequate range has been established
- Recognize when daily moves have "earned their range" and are ripe for reversal
- Time fade-the-move and counter-trend strategies with statistical backing
- Improve win rates by trading only after proven probability thresholds are met
⚙️ Setup Instructions:
1. Add the indicator to your chart
2. Select your preferred "Reset Mode" (recommend "Custom Session" for futures/international markets)
3. If using Custom Session, enter your session times in 24-hour format (e.g., 0930-1600 for US stocks, 1700-1600 for CME futures)
4. Adjust alert thresholds if desired (default: 80% and 100% - proven SIYL thresholds)
5. Position the display where it's most visible on your chart
📈 Works Across All Markets:
Stocks • Futures • Forex • Indices • Crypto • Commodities
Perfect for regression traders, mean reversion specialists, and SIYL practitioners who want to trade with probability on their side by entering only after the session has "earned its range."
---
Tip: For futures contracts with overnight sessions that span calendar days (like MES, MNQ, MYM), use "Custom Session" mode with your exchange's official session times for accurate tracking.

Universe Structure & Trend Zone [All-in-One]**Overview**
The "Universe Structure & Trend Zone" is a comprehensive all-in-one trading toolkit designed to combine Institutional Trend Following with Smart Money Concepts (SMC/ICT). It helps traders identify the dominant trend direction while providing precise entry points based on Market Structure Breaks (MSB) and Order Blocks.
This script aims to filter out market noise by allowing trades only when Price Action aligns with the long-term trend (SMA Zone).
**Key Features**
1. **Market Structure Breaks (MSB) & ZigZag:**
- Detects structural shifts in price (Bullish/Bearish MSB).
- Uses a default Signal Length of 10 to filter out minor swings and focus on significant structural changes.
- Visualizes high and low pivot points.
2. **Smart Trend Zone (SMA 200 Filter):**
- Incorporates a 200-period SMA Zone (Institutional Level) to determine the macro trend.
- **Trend Filter Logic:** The indicator intelligently filters signals. It displays Bullish Order Blocks only when the price is trending *above* the SMA Zone, and Bearish Order Blocks only *below* it. This drastically reduces false signals in choppy markets.
3. **Order Blocks (OB) & Breaker Blocks (BB):**
- Automatically identifies high-probability Order Blocks and Breaker Blocks.
- Includes optional filters for Volume and Premium/Discount zones to validate the blocks.
- Features an auto-cleanup mechanism to remove invalid or broken boxes, keeping the chart clean.
4. **Hull Moving Average (HMA):**
- A fast-reacting 55-period HMA is included to visualize short-term momentum shifts (Green for Bullish, Red for Bearish).
5. **Smart Range (Support/Resistance):**
- Plots the dynamic Highest High and Lowest Low of the selected timeframe (default 4H) to show the current trading range and Equilibrium (EQ) level.
**How to Use**
* **Step 1:** Check the **SMA Zone** (Gray/Green/Red Band). If Price > Zone, look for Longs. If Price < Zone, look for Shorts.
* **Step 2:** Wait for a **Market Structure Break (MSB)** label in the direction of the trend.
* **Step 3:** Look for an entry at the retest of an **Order Block (OB)** or **Breaker Block (BB)**.
* **Step 4:** Use the HMA color change as a confirmation trigger or trailing stop guide.
**Settings**
* **Signal Length:** Default is 10 (Optimized for standard swings).
* **Trend Filter:** Enabled by default (Recommended to stay with the trend).
* **Display:** You can toggle MSB lines, Boxes, and Labels on/off to suit your visual preference.
**Disclaimer**
This indicator is for educational purposes only and does not constitute financial advice. Always use proper risk management.
