Tweezers and Kangaroo TailHello Traders,
Here Tweezers and Kangaroo Tail script is in your service. The script searches for Tweezer / Kangaroo Tail candlestick patterns and shows them as T (Tweezer) and K (Kangaroo Tail). Thanks to RorschachT who game me the idea and some details while working on this script.
What are these candlestick patterns?
Tweezers :
- A tweezers pattern occurs when the highs/Lows of two candlesticks occur at almost exactly the same level
- Both candles must have wicks
- Bigger Wick / Smaller Wick rate should not be greater than 150% ( 150% by default and you have option to change it)
- First Candle must be highest/lowest for last 5 candles (5 by default and you have option to change it)
- The level of High for Top, Low for Bottom must be almost lower than 20% of the bigger wick of tweezer candles (20% by default and you have option to change it)
- The Candles can be right next to each other or apart but not more than 12 candles apart (12 by default and you have option to change it)
- You will see that Tweezers pattern occurs frequently
Kangaroo Tail:
- Looks almost like a Hammer or Inverted Hammer candle
- They have both its open and close in the top or bottom third of the candle
- There must be some space/room on the left of the kangaroo tail
- The open and close of the Kangaroo Tail candle must be inside the range of the previous candlestick
- The next candle should create a new high or new low
- You have several options to set details about the "Room" that should be on the left and also options for Wick/Body rates
- You can see example below
You have option to enable/disable any of these patterns.
as far as I have tested they are strong reversal patterns but none of the indicators or patterns may not be enough alone. so you should confirm the signals using other indicators or tools
If you need more information you can find a lot of info on the net ;)
Example: Tweezers - Aparted
Example: Kangaroo Tail - Bullish
Enjoy!
Trendtrading

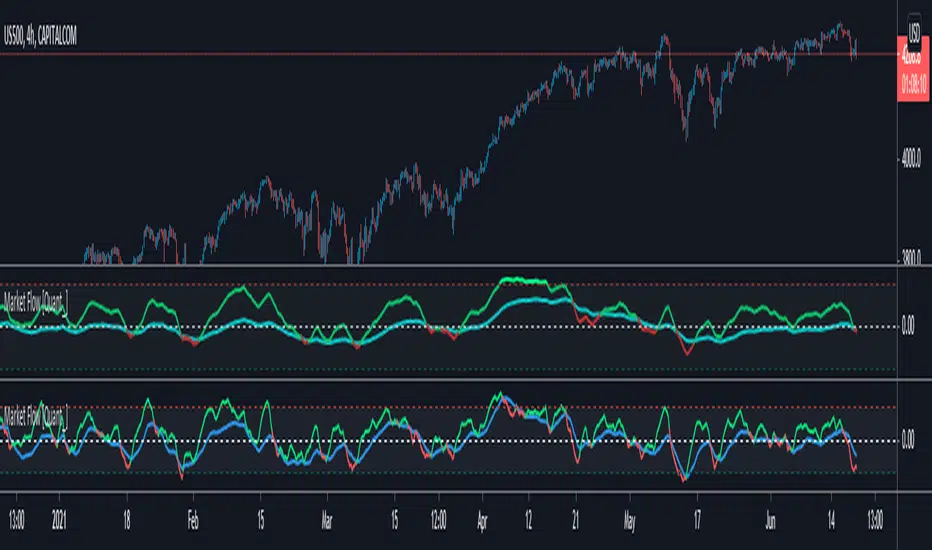
Market Flow IndicatorHOW IS THIS INDICATOR DIFFERENT ?
This is a forked and even simpler version of the premium indicator Trend Volume RSI Analysis . Please, read its description on my profile page so that you can understand what changes have been made here and why.
Although in Trend Volume RSI Analysis you have only one parameter to configure (length), you need to choose between 3 options for the analysis - Trend, Volume, or RSI. You also have an option to highlight the buy and sell zones. For me, this is a lot of switching. Alternatively, if I want to see the whole picture, I have to apply the indicator twice or even three times, which limits the space on my screen for the candlestick chart. However, a lot of work has gone into creating that indicator and it works great. If it isn't broken, why fix it, right?
So, I forked Trend Volume RSI Analysis and modified some of the formulas, as well as effectively combined the Trend and the RSI parts into one simpler indicator. No more switching. Also, the Buy and Sell colors change based on crossovers. No more zones either.
WHAT DOES THIS INDICATOR DO ?
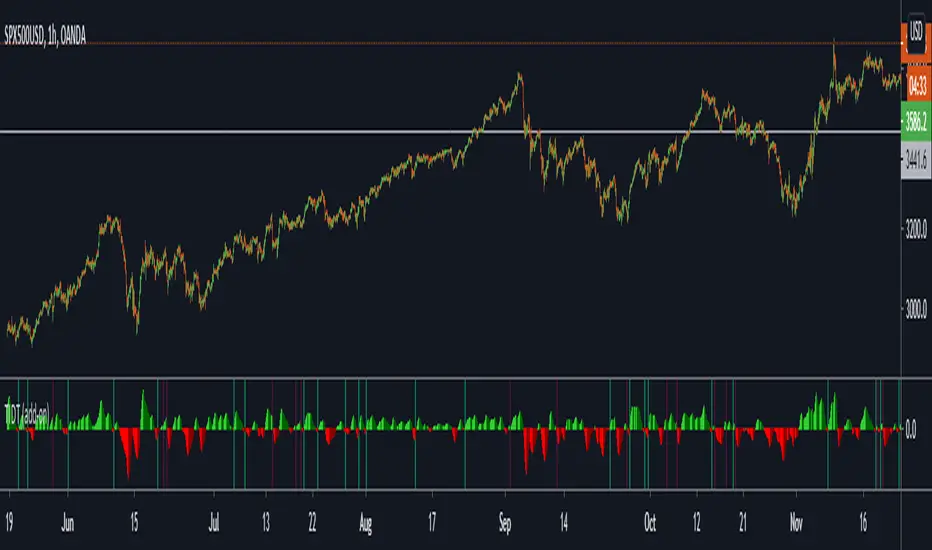
Market Flow Indicator shows two things - price direction (blue line) and momentum (green line). In the first screenshot below the indicator is applied to the 1h chart of SPX500 to show direction and on the second screenshot I use a 1h chart of BTC/USD in which you notice divergence, formed as a result of exhausted momentum. The indicator works equally well with cryptocurrencies, indices, commodities, and currency pairs.
The line colored in green and red is a modified RSI and the blue line is called Momentum (those are their names for now, but please check the updates below if anything has changed). Their colors are configurable in the settings panel.
In order to standardize the numbers without any modifications to the formulas, the RSI numbers are brought down by 50. In other words, the equivalent of an RSI overbought extreme (100) is 50 in the Market Flow Indicator, and the equivalent of an oversold extreme (0) is -50 in this indicator. Default lines here are set at 25 and -25, which are the equivalent of 75 and 25 respectively.
That's pretty much it. The idea behind Market Flow Indicator was to be super simple and to be used with minimum configuration if any at all. Once you get a grasp of it, it shouldn't take you more than a few seconds to know if you should stay flat or look for a long/short position.
HOW MUCH DOES IT COST ?
Although this may look like a simple indicator, I have spent a great deal of time testing and optimizing it to achieve this level of simplicity and practicality. Also, I will continue to update Market Flow Indicator as well as introduce user-requested features if they will improve its overall performance. For these reasons, this is a paid indicator, but I do give a free trial so that you can test it out for yourself. If you want to gain access, please use the provided information below or just message me. Thank you for your time.
Disclaimer: The purpose of all indicators is to indicate potential setups, which may lead to profitable results. No indicator is perfect and certainly, no indicator has a 100% success rate. They are subject to flaws, wrongful interpretation, bugs, etc. This indicator makes no exception. It must be used with a sound money management plan that puts the main emphasis on protecting your capital. Please, do not rely solely on any single indicator to make trading decisions instead of you. Indicators are storytellers, not fortune tellers. They help you see the bigger picture, not the future.
Trend IdentifierTrend Identifier Indicator helps to identify the Trend of intermediate time frame automatically.
It shows the trend and RSI position for Intraday, Daily and Swing time-frame in one go.
IF RSI is > 70 = RSI High
RSI is < 65 > 35 = RSI Side
RSI is < 30 = RSI Low
For Trend High, Low and Side, it makes it's own calculation and identifies the trend for intermediate time frame.
It also shows the standard deviation information.
1sd = 1 standard deviation achieved.
2sd = 2 standard deviation achieved.
Weekly and Monthly std = Weekly and Monthly standard deviation achieved.
Based on your trading style one can hide the other trend std and RSI option.
PM us to obtain the access.
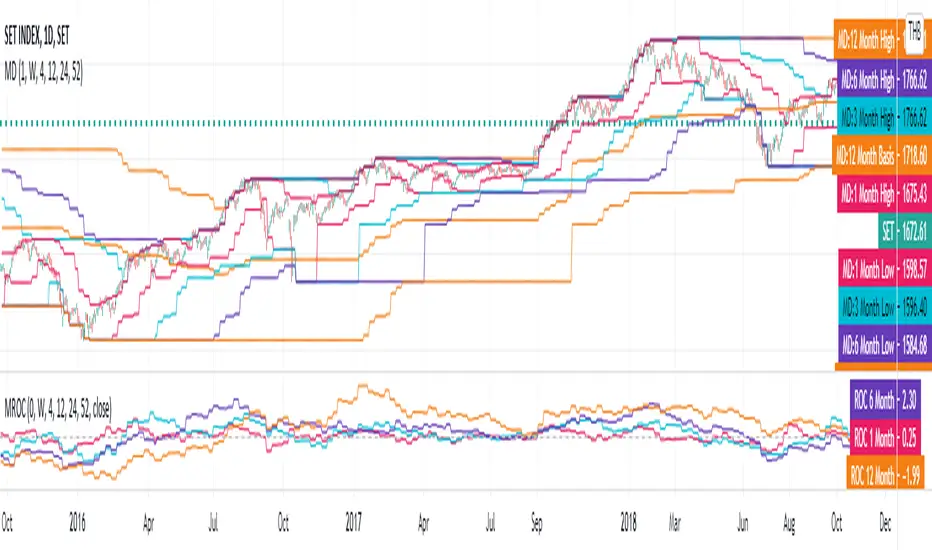
[Jett.][GoldenRush] Market DirectionThis script was created to analyze levels of market trends.
This is an indicator that is used to analyze the overall 2 levels.
1.Considering the index's key trends (Strategic Level)
2.Trend Analysis (Tactical Level)
To get a big overview of the trend and catch short-term movements. In this indicator, there are 4 levels of momentum measurements.
with the default setting
Major trends (Strategic Level)
1.We have the highest and lowest prices in the 52-week or 1-year scale.
2.We use the average of the highest and lowest prices(basis of 52-week). can be filtering the overview of the trend
3.As for the trend in 24-week or 6-month. Used to find the direction of the price And helps confirm that a trend is starting to take a certain direction.
Sub-level trend (Tactical Level)
1.Price in the level 12-week or 3-month. We use it to calculate the direction of movement in the short term, it is possible that the market will be bullish or bearish in 3-month.
2.And the 12-week or 3-month price is a confirmation of how strongly the short-term price moves in any direction.
3.If there will be a correction of the price base 12 weeks or 3-month price swings always happen first.
4.The 1-month price is the same as the trigger, if the market has a breakout in any way it could mean the start of a short sway.
By this indicator Besides being used to measure direction or trend, it can also be used as a significant filter for both support and resistance for short, medium, long term.
Jet.T.S. Trader
Trend Volume RSI AnalysisHOW'S THIS INDICATOR DIFFERENT ?
If you are familiar with my work, then you would know that I am into creating indicators with tons of parameters, almost all of which are left for you to configure. While this gives you an incredible level of customization, the feedback I received was that some of you felt a bit overwhelmed by them.
As such, I decided to create an incredibly simple, yet effective indicator that can give you a better overview of what's going on with the security you are trading/investing in without you needing to tweak a dozen parameters. So, the first and most obvious difference you will notice with Trend Volume RSI Analysis is that you have only 1 parameter to configure (length), one checkbox to tick (highlight buy/sell zones), and one dropdown menu to choose from (the type of analysis). All unnecessary features are stripped away and all calculations are done on the backend. Now let's see if this simplicity affects the efficiency of the indicator.
HOW DOES THE INDICATOR WORK?
1. Trend Analysis
The first type of analysis, selected by default, is the Trend. It shows the balance between bulls and bears and their respective strength. In order to filter out the noise and smooth out the graph, a moving average is applied twice - once from left to right, and once from right to left. Although this causes a minor delay, it is justified since the common moving averages lag is significantly reduced. The screenshot below shows an example of a small bull run on the 1h chart.
The indicator also performs very well in spotting divergences. Two divergences (bearish and bullish respectively) are illustrated in the screenshot below.
2. Volume Analysis
Volume Analysis doesn't just sum the standard volume of the trend. Rather, it calculates the effective volume - the one responsible for moving the price up or down and seeks the relationship between total volume and price movement. Thus, you get a smooth volume trendline that should prevent you from opening a position against the trend. As logic dictates, if the buying volume is growing, then the trendline will go up and it will be in green. If, however, the selling volume is growing, the trendline will decline and it will be in red. This analysis is better used on a bigger time frame, such as on a 4h chart.
Note: For those of you who have used my other indicator Multi Time Frame Effective Volume Profile, the formula used here is slightly different. The one used there is optimized for volume bars, while the modifications here deliver a slightly better trendline with less noise.
3. RSI Analysis
Contrary to the standard RSI which derives its results from price movement, this RSI is calculated based on the modified volume. So it's fair to say that it's a Volume RSI. This makes it a bit jerkier, almost something in between an RSI and Stochastics. However, it is much better in identifying divergences and will quickly indicate potential trends as it will start climbing up sooner. The screenshot below is on a 4h chart, but that's only because I want to show more examples. It works equally well on the 1h or even on a minute chart.
In the first example, the divergence is pretty obvious on all three indicators. However, in example 2 you would be able to spot it only on Trend Volume RSI Analysis and somewhat in Stochastics. RSI makes a double bottom there. Similar is the case with example 3, where this indicator is long gone on the way up in comparison to the other two. The difference in reaction comes from the supply and demand relationship, not just from the price movement. When bears are losing steam, the indicator detects this as a low supply level, thus printing the divergence or even climbing up to indicate the start of a new mini-trend.
I must note, however, that this part of the indicator must be used in accordance with the main trend (this is where the other two analyses come into play). You go long on a pullback when there's an established bull trend and you go short on a pullback when there's an established bear trend.
4. Additional Settings
I know, for an indicator with just one parameter this description is getting pretty long. There's only one thing left to cover - highlighting the buy/sell zones. It is fairly simple - when it's ON, the zones where bulls are stronger than bears will be highlighted in green. When the opposite is true, the background will be red. You can switch it OFF if it intervenes with your analysis, but I prefer having it as it shows a confluence of bull/bear force and the indicator itself. Here's an example below:
HOW MUCH DOES THIS INDICATOR COST ?
Although Trend Volume RSI Analysis may look like an incredibly simple indicator, I can assure you that a great deal of time, testing, and optimizing have gone into creating an indicator that does almost everything for you. The initial version was much more complex and a few dozen iterations were required to reach that level of simplicity and practicality. Furthermore, I will continue to update this indicator as well as introduce user-requested features if they will improve its overall performance. To find out more about how to gain access to this indicator, please use the provided information below or just message me . Thank you for your time.
Disclaimer: The purpose of all indicators is to indicate potential setups, which may lead to profitable results. No indicator is perfect and certainly, no indicator has a 100% success rate. They are subject to flaws, wrongful interpretation, bugs, etc. This indicator makes no exception. It must be used with a sound money management plan that puts the main emphasis on protecting your capital. Please, do not rely solely on any single indicator to make trading decisions instead of you. Indicators are storytellers, not fortune tellers. They help you see the bigger picture, not the future.

MACD TRADING SYSTEMThis is a conservative Trend Continuation Trading System.
Uses a Hull Moving Average to determine general trend direction
Uses MACD to initiate Trade entries
Uses a variant of Chaikin Money Flow for volume confirmation
Also uses the Average True Range (ATR) to determine take profit and stoploss.
Stoploss becomes trailing when take profit target has been hit.
I built it mainly for myself to use.
Wanted an objective trading system to take all the emotions out of my trading.

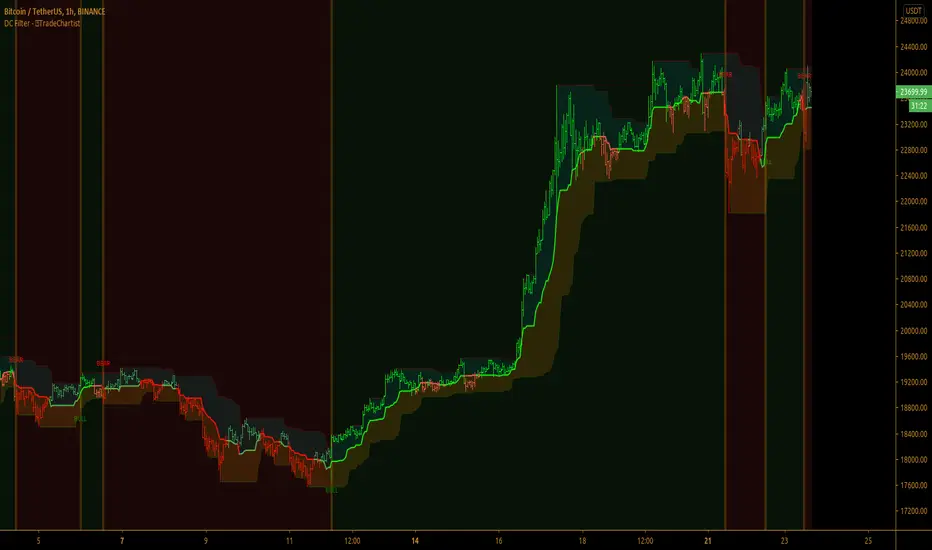
TradeChartist Donchian Channels Breakout Filter™TradeChartist Donchian Channels Breakout Filter is an elegant version of the classic Donchian Channels with few extra variations and option to filter breakouts based on user preferred Breakout price selection to generate Trade Entries.
===================================================================================================================
Features of ™TradeChartist Donchian Channels Breakout Filter
======================================================
Option to plot Donchian Channels of user preferred length, based on the Source price in addition to High/Low Donchian Channels.
Generates trade entries based on user preferred Breakout Price. For example, if the user prefers HL2 as breakout price, irrespective of the Donchian Channels type, trade entries are generated only when hl2 price (average of high/low) breaks out of the upper or lower band.
Option to plot background colour based on Breakout trend. The bull zones are filled with green background, the Bear zones are filled with red background and the bar that broke out is filled with orange background.
Option to colour price bars using Donchian Channels price trend. The Donchian Channels basis line is plotted using the same colours as coloured bars as default.
Alerts can be created for long and short entries using Once per Bar Close .
Note: This script does not repaint . To use the script for trade entries, wait for the bar close and use a second confirmator (includes fundamentals) based on asset type as some markets require users to have good pulse on the fundamentals as trading by Technicals/price action dynamic alone may not be safe.
===================================================================================================================
Best Practice: Test with different settings first using Paper Trades before trading with real money
===================================================================================================================
This is not a free to use indicator. Get in touch with me (PM me directly if you would like trial access to test the indicator)
Premium Scripts - Trial access and Information
Trial access offered on all Premium scripts.
PM me directly to request trial access to the scripts or for more information.
===================================================================================================================
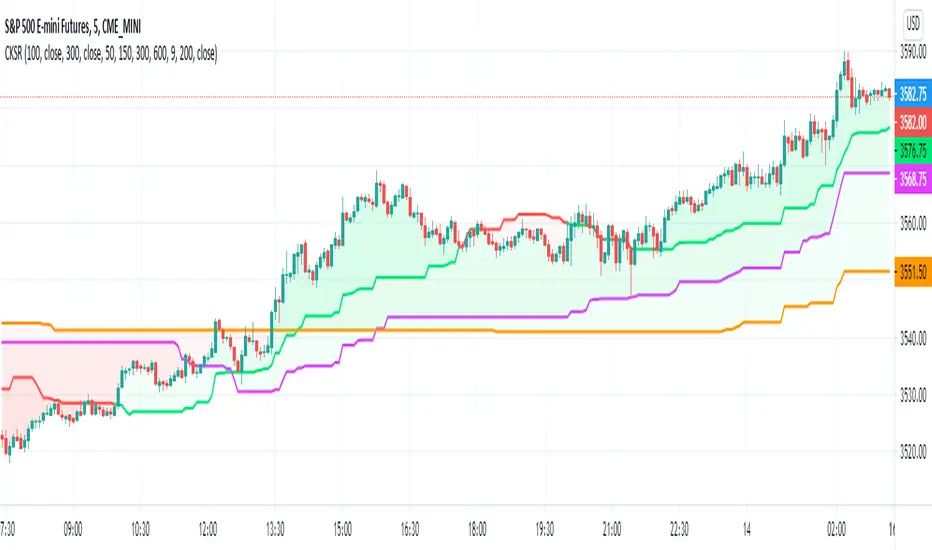
Multi Time Frame Trend, Volume and Momentum ProfileWHAT DOES THIS INDICATOR DO?
I created this indicator to address some of the significant inconveniences when analyzing a security, such as continually switching between different time frames to determine the trend and potential pullbacks, adding volume or volume-derived indicators, and finally, something that would help me determine the strength of the trend (maybe two additional indicators here). So I decided to code this all-in-one indicator that you can add multiple times to your chart depending on the settings you want to use, or just optimize the parameters for the particular asset and then switch between the options.
As the name suggests, it consists of three main sections - Trend , Volume , and Momentum . You have complete control over the parameters, including the Time Frames you want to use for each one (they can be different). So, let me explain each section in more detail.
HOW DOES THE INDICATOR WORK?
1. Trend Settings
In order to determine the trend, you need to set up two Moving Averages. You have a wide choice here - SMA, EMA, WMA, RMA, HMA, DEMA, TEMA, VWMA, and ALMA. Since the indicator does not plot the moving averages on the chart, I strongly suggest using this indicator along with the free "Trend Indicator for Directional Trading(main)" , which you can find in the Public Library. Once you set up the Trend Resolution, the Types of MAs, and their lengths, the indicator will generate a histogram of their convergences and divergences.
The change in colors should help you more easily determine the trend:
a) Bright Green - bull trend and price trending up (a good place to open long)
b) Dark Green - bull trend and price trending down (stay flat or open a long position with great caution)
c) Bright Red - bear trend and price trending down (a good place to open short)
d) Dark Red - bear trend and price trending up (stay flat or open a short position with great caution)
e) In addition, you can change the color palette to reflect the bull/bear trend momentum by scrolling to the bottom and selecting "Color Based on Bull/Bear Momentum", but I will discuss this in more detail below.
This part of the indicator is useful for opening a trade in the direction of the trend or for spotting a potential divergence. Both cases are illustrated below.
2. Volume Settings
The calculations for this part of the indicator are partially taken from "Multi Time Frame Effective Volume Profile" . I will quickly outline the specifics here, but if you want a more thorough understanding of how it works, please check the description of the MTF Effective Volume Profile indicator .
You have three elements with the following default settings - Resolution (5-min), Lookback (100), and Average (1). This means that the indicator will analyze the last one hundred 5-min bars and will plot a sum of only those that are at least 1 times bigger than the average. Those that are smaller than the average will be left out from the calculation. What you get is a trend line showing you accumulation/distribution based on modified volume parameters.
This part of the indicator is useful for spotting exhaustions and increased buying/selling volume that is opposite to the price trend. As you will see in the picture below, in frame 1 the selling pressure is decreasing, while buying volume is increasing. At one point supply dries out and the bulls take control, thus reverting the price. In frame 2, however, you can see that the higher high is not met with nearly as much buying volume as in the previous peak, showing that the bulls are exhausted and maybe a trend change will follow or at the very least that the bull trend will take a break.
3. Momentum Settings
The final part is an RSI smoothed through a Moving Average with the addition of some minor optimizations. Thus, the parameters you have to configure here aside from the resolution are the RSI length, the moving average that will be used, and its length. Out of the three, this is the most lagging component, but it's also the most accurate one. I must mention that due to the modified nature of this RSI, overbought and oversold levels carry less weight to the trading signals. Rather, pay attention to the change of colors, as they do so when the RSI changes direction based on preset parameters. The picture below shows such instances.
4. Additional Settings
This section consists of 4 elements:
a) Length of Trend - filters out the noise and gives a signal only when the trend becomes more established
b) ADX Threshold - filters out trading ranges and indecision zones when it's not recommended to open a trade
c) Select Analysis - choose what part of the indicator you want to see from a drop-down menu
d) Color Based on Bull/Bear Momentum - a global setting that will override the preset coloring of each indicator and will replace it with colors based on bull/bear strength and momentum - green for bulls, red for bears, and gray for non-trading zones.
The last part of this indicator is a combination of all of the above and is called a Points-Based System . It generates 3 rows of dots that go light green when bull criteria are met, orange when bear criteria are met, or gray when it's neither of the two. When you get a column of 3 green dots you get a buy signal. Similarly, a column of 3 orange dots gives you a sell signal. Grey zones are non-tradeable. It goes without saying that the frequency and quality of the signals you get will almost entirely depend on your settings, so feel free to experiment and adjust the indicator to catch the best moves for the given security.
In terms of indicator adjustments, I have left almost every part open to configuration. That is 15 parameters and 35 adjustable colors.
HOW MUCH DOES THE INDICATOR COST ?
As much as I would like to offer it for free (as some of my other ones), a great deal of work, trading logic, and testing have gone into creating this indicator. More than a few hundred iterations and a few dozen branches were required to reach the end result which is a precise combination of usefulness, simplicity, and practicality. Furthermore, this indicator will continue to be updated and user-requested features that improve its performance will be added.
Disclaimer: The purpose of all indicators is to indicate potential setups, which may lead to profitable results. No indicator is perfect and certainly, no indicator has a 100% success rate. They are subject to flaws, wrongful interpretation, bugs, etc. This indicator makes no exception. It must be used with a sound money management plan that puts the main emphasis on protecting your capital. Please, do not rely solely on any single indicator to make trading decisions instead of you. Indicators are storytellers, not fortune tellers. They help you see the bigger picture, not the future.
To find out more about how to gain access to this indicator, please use the provided information below or just message me. Thank you for your time.

MrBS:Directional Movement Index [Trend Friend]I started this project with the goal of making a DMI/ADX that was easy to read at a glance. Its since become a little more then just colouring the slopes. The majority of the time, the best returns come from trending markets (THE TREND IS YOUR FRIEND... until the end) and I hope this helps people become good friends with the trends.
----- Features
- A function to change the values used for calculation from real OHLC and Heikin Ashi. This allows us to look at different chart types but see the specific ADX we choose. Originally HA values were used for calculation since it is easier to see trend on HA charts. However when testing it was not as effective as the ADX calculated from the real values on normal charts. So the default function was flipped and real OHLC values are used as default.
- Two ADX plots so we can see two different smoothness's. With a smoothing of 2, a slight slow down in PA can cause a negative slope but the smoother ADX will stay trending unless its a major change. 2nd ADX is slightly transparent.
- There is an EMA of the main ADX that can be used as a exit signal filter. If the ADX starts going down but has not crossed the EMA we would stay in a trade.
- Plots (excluding EMA) are coloured based on positive or negative slopes.
- Fibonacci numbers have been used to create different trend levels, instead of the standard 25, 50, 100.
- Alerts for every useful situation to help save time and not have to manually enter levels or crosses each time.
- In the code there are 8 EMAs and 3 ADXs but it was too much so they have been slashed out, but are fully functional if you choose to activate and use them. To reactivate the 3rd ADX delete slashes on lines 50, 65, 78, 92-95, 165. The slashed out EMAs are much more obvious and easy to reactivate.
Colours:
ADX going up = Green
ADX going down = Red
DMI+ going up = Bright Aqua
DMI+ going down = Turquoise / Dark Aqua
DMI- going up = Bright Purple
DMI- going down = Dark Purple
EMA = White (50% transparent)
If there is anything that would be useful, let me know and I will add it in. I've already got some improvements/changes planned and some of my notes can be found in the code.
There is also a strategy to go with this indicator that will be uploaded very soon.

Linear Regression ChannelHello Traders,
There are several nice Linear Regression Channel scripts in the Public Library. and I tried to make one with some extra features too. This one can check if the Price breaks the channel and it shows where is was broken. Also it checks the momentum of the channel and shows it's increasing/decreasing/equal in a label, shape of the label also changes. The line colors change according to direction.
using the options, you can;
- Set the Source (Close, HL2 etc)
- Set the Channel length
- Set Deviation
- Change Up/Down Line colors
- Show/hide broken channels
- Change line width
meaning of arrows:
⇑ : Uptrend and moment incresing
⇗ : Uptrend and moment decreasing
⇓ : Downtrend and moment incresing
⇘ : Downtrend and moment decreasing
⇒ : No trend
An example for how color of lines, arrow direction and shape of label change.
Enjoy!

RSI Multi Time FrameHello Traders,
Recently we got new features in Pine such Arrays of Lines, Labels and Strings. Thanks to the Pine Team! ( here )
So I decided to make new style of Multi Time Frame indicator and I used Array of Lines in this script. here it is, RSI Multi Time Frame script. it shows RSI for current time frame as it is and also it gets RSI for the Higher Time Frame and converts it and shows it as in time frame. as you can see, RSI for HTF moves to the right on each candle until higher time frame was completed.
You have color and line width options for both RSI, also if you want you can limit the number of bars to show higher time frame RSI by the option " Number of Bars for RSI HTF ", following example show RSI HTF for 100 bars.
Most of you know that old style Multi Time Frames indicators was like:
Hope you like this new Multi time frame style ;)
Enjoy!

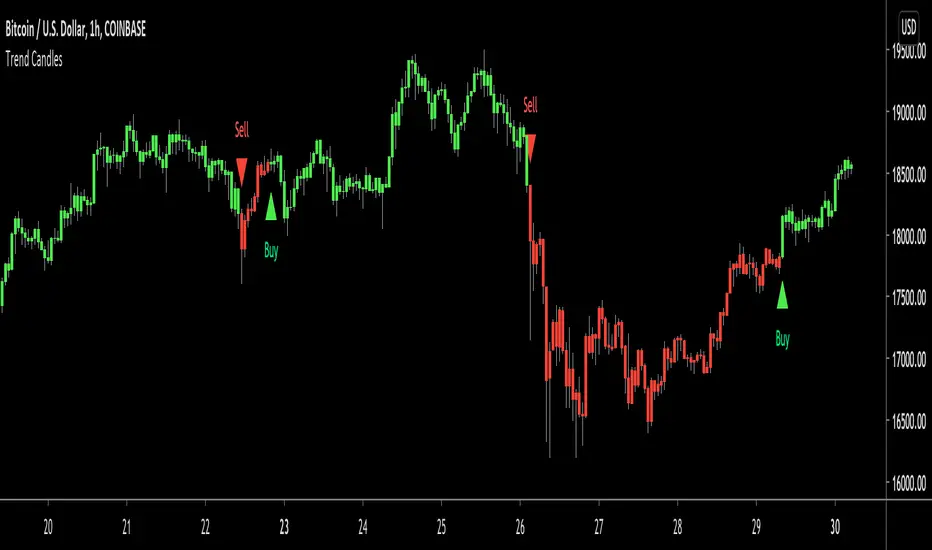
Trend CandlesTrend Candles is a simple indicator based on the trend following strategy that shows you exactly when to buy, sell and close trades on every chart, market and timeframe. It's always in a trade, either long or short as indicated by the color of the candles, when the candles are green that means go long, when they switch to red that means go short until the next green candle appears.
It's best used on markets that tend to trend a lot like currencies, futures and cryptos, however it also works well on stocks and ETFs (long-only).
How Is It Different From Other Indicators?
- Designed specifically for the trend following strategy
- Color coded candles for visually appealing chart guidance
- Signals are based on current and past volatility
- They aren't as sensitive to false signals after periods of contracted volatility
- Helps to keep you in the trend without being "shaken out"
- Can be applied to all markets and timeframes
How To Use The Indicator?
1) Visit our website URL shown below this description and subscribe
2) We will then grant your TradingView username permission to use our indicators
3) Go to your Indicators window, then the Invite-Only section and add our indicators to your chart
4) Our indicators will then show on every chart you now look at
5) You can set up alerts to be notified in real time of trading signals from our indicators
6) Read our user manual for all the best tips on how to use our indicators
7) Feel free to reach out to us for personal one-on-one help with getting setup
What Markets and Conditions Does It Work Best On?
All markets cycle between trending and ranging modes, and the key to successfully using these indicators is identifying when the market is in or likely to go into a trending mode, and as such it can be applied to all markets and timeframes. After a market has contracted for a period of time in a tight range, the 1st entry signal after the period of consolidation can become the start of a powerful trend. On the flip side taking every signal when a market is ranging will result in churn.
Our indicators are primarily designed for day trading and swing trading, however they can also be used for position trading and investing by keeping you invested in the trend which can be very difficult to do without a good indicator due to all of us being vulnerable to getting "shaken out" of a trend. This indicator will always respond to changes in price and will never keep you in a trend going against you, and like all good trend following it adheres to the principles of cutting your losses and letting your winners run so long as the trend is intact. It's the top 1-5% of your trades that account for 80-90% of your profits, as fat tail moves happen more often in markets than a normal distribution would suggest and that's why trend following albeit difficult to practice, will always work.
With stocks and ETFs, we recommend sticking to long only as shorting stocks is very difficult no matter the strategy or indicator used. If you're an investor you can use Trend Candles on the daily or weekly charts to help keep you in good stocks and industries and avoid holding onto perpetual losers.
As always indicators should be used as part of a trading strategy to assist in making decisions, instead of just blindly following every signal they produce you should always seek to compliment technical trading signals with additional analysis to reduce your risk and increase your odds of making a winning trade.
Examples Of Trend Candles On Various Markets and Timeframes
FOREX - EURJPY (5 Minute Chart)
CRYPTOCURRENCY - ETHUSD (30 Minute Chart)
STOCKS - TSLA (Daily Chart)
COMMODITIES - GOLD (Daily Chart)

To gain access to Trend Candles today visit our website shown below.
Happy Trend Following :)
Trend Indicator for Directional Trading (add-on)TIDT is a two-part trend-based indicator designed to recognize the general direction and help you identify good opportunities for going long or short (both indicators are called the same way with "main" and "add-on" additions).
This is the add-on indicator that is added below the chart and aside from identifying trending opportunities, it also shows Bullish and Bearish Divergences. Similar to the main indicator, it is based on 3 Moving Averages over which you have full control. You can choose between the following 7 types:
- Simple Moving Average ( SMA )
- Exponential Moving Average ( EMA )
- Weighted Moving Average ( WMA )
- Running Moving Average (RMA)
- Hull Moving Average ( HMA )
- Volume Weighted Moving Average ( VWMA )
- Arnaud Legoux Moving Average ( ALMA )
I strongly suggest that the types and periods for your MAs in the main and the add-on versions are identical so that you get a better visual of the whole picture. However, you may develop a trading strategy that relies on two different types of signals, so that's entirely up to you. Once you have set up the MAs and chosen the lookback period, the rest is taken care of for you. You get two types of signals:
1) Pullbacks - the divergences between your MAs generate a result, which is then averaged as a percentage gain or loss and worked out into a histogram. The colors of the histogram indicate opportunities to buy (if green), short (if red), or sit tight (if white) unless an explicit signal is given by the indicator. Overall the principle is simple - establish the trend and look for weaknesses so that you can open an order in the direction of the trend.
2) Divergences - generated in a similar way to the Pullbacks strategy with some minor adjustments and improvements to better catch the divergences. The histogram is slightly different, as the positive results are plotted above 0 and the negative ones below 0. As such, the histogram looks a lot like MACD, but with different calculations. The color principle mentioned above is the same - green for longs, red for shorts, and white for neutral unless specified by a signal. The change of the shade of the color shows an increase or a decrease in the momentum. A Long signal comes up when the price makes a lower low, while the momentum makes a higher low. A Short signal comes up when the price makes a higher high, but the momentum makes a lower high.
Ticking a box next to the signal type will show the associated histogram and its signals. Due to the different ways those two histograms are calculated and displayed I recommend having either of them On, but not both. However, you may want to be able to see both types of signals, so I've left this as an option. Once again, all colors are fully configurable.
The complete Trend Indicator for Directional Trading has gone over 1,500 revisions, has been forked over 10 times, and has been worked out to be as minimalistic, useful, and practical as possible. A great deal of work, time, and experience have been poured into this indicator to do what it's supposed to do - help you identify better entry opportunities for increased profitability.
If you have any questions regarding the indicator or suggestions on how it could be improved, please let me know. Thank you.
Trend Indicator for Directional Trading (main)TIDT is a two-part trend-based indicator that aims to recognize the general direction and help you identify good opportunities for going long or short. This is the main indicator that is plotted on the chart and is comprised of 3 Moving Averages over which you have full control. You can choose between the following 7 types:
- Simple Moving Average (SMA)
- Exponential Moving Average (EMA)
- Weighted Moving Average (WMA)
- Running Moving Average (RMA)
- Hull Moving Average (HMA)
- Volume Weighted Moving Average (VWMA)
- Arnaud Legoux Moving Average (ALMA)
For clarity of the trend whenever a fast MA crosses up or down a slower MA, the slower one changes its color. The faster MA changes color based on its direction.
Depending on your MA preferences and their period, you generate two main signal types:
1) Moving Average Bounce Signals - You will get a signal whenever the price bounces off, nearly touches or pierces your first MA (depending on your settings as described below)
2) Pullback / Retracement Signals - You will get a signal whenever a trend is established and the price retraces, thus giving you an optimal entry.
I've included 3 additional settings that you can tweak in order to reduce the noise or get more signals, all depending on your risk tolerance and trading style. Configuring these settings will filter the results you get in "Moving Average Bounce Signals". They are as follows:
1) Trend Strength - identifies ranging areas and helps you avoid choppy markets. The higher number, the stronger the trend must be for a signal.
2) Buffer Zone - allows you to receive a signal whenever price approaches your first MA. This way you will not miss a signal if the price doesn't bounce off your MA, or it will notify you in advance of a possible bounce/breakdown.
3) Max Candles Beyond MA - gives you a signal even if the price doesn't bounce off your first MA, but goes through it and then goes back up. You can select how many candles can close beyond the MA before invalidating the signal. Currently, the maximum number of candles that can close beyond the first MA is 5. This is done for your own practicality.
Almost all available options can be configured including the colors of the different signals - Bounces, Pullbacks, MA piercing depending on the number of candles, etc.
The second part of the indicator (called the same way with "add-on" at the end) is meant to complement this one and show additional trending signals, as well as Bull and Bear Divergences. For better results, both indicators must be used at the same time.
Please, note that like any other indicator, this one does exactly this - it indicates a good possibility of an entry, but does not guarantee profitability. Any indicator must be used as part of a system and strict money-management rules.
If you have any questions regarding the indicator or suggestions on how it could be improved, please let me know in the comment section below. Thank you.

GatekeeperThe Gatekeeper is based on the 30 and 34 ema and their mtf / 3D charting from the seconds to weekly charts. The 34 ema functions as a gatekeeper of the 30 minute chart and similar to the slow guppies, the 30 ema and the 34 ema function as a gatekeeper of a trend. I have included the zone fill for some time frames on this indicator that aids the trader to identify changes in trends or gauge the strength of the current trend. With the utilization of mtf / 3d charting you will see how the higher time frame 30 and/or 34 emas function as a gatekeeper of those particular time frames as well.
The degree of separation between the 13 ema and the longer term moving averages can be used as an indicator of trend strength. If there's a wide separation, then the prevailing trend is strong. Narrow separation or lines that are criss-crossing, indicates a weakening trend or a period of consolidation.
The crossover of the 13 ema and long-term moving averages 30, 34 and 62 represent trend reversals. If the 13 ema crosses above the long-term moving averages, then a bullish reversal has occurred. If the 13 ema crosses below the longer-term moving averages, then a bearish reversal is occurring. When both groups of MAs are moving horizontally or mostly moving sideways and heavily intertwined, it means the asset lacks a price trend and therefore may not be a good candidate for trend trades. A breakout of sort will be coming and it is best to be patient. These periods may be good for range trading.
TrendsniperTrendsniper is an indicator built with MTF / 3D capability from the seconds to the weekly chart. It uses 2 key simple moving averages for MTF; the 20 and 21 with the zone fill using the 8 21 cross. We have incorporated the sma to avoid the whipsaw factor that an ema has so one can allow to stay in a trade while the trend remains as noted on the higher time frames and visible with MTF.
The longer time frame MTF moving averages give you a picture of the overall trend allowing trader to objectively trade using them to measure potential reversals and price strength. You will see that every SMA has time designations such as "15S1M" which would mean that that specific SMA is for the local time frame of 15seconds with 1M mtf inclusion. 15M60M would mean that that SMA is for the 15M local time frame chart with 60M mtf inclusion; meaning you're able to see the 60M (60minute) SMA on your 15M (15minute) chart. The same goes for the other SMAs noted in Trendsniper.
You will also notice that moving averages function as support and resistance and MTF moving averages may clearly note that on the chart.
A simple moving average is a technical indicator that can aid in determining if an asset price will continue or if it will reverse a bull or bear trend. We have used the 8, 20, 21 SMAs in this indicator to assist one with identifying the existing trend and exiting a trade when his/her conditions as a trader are met.
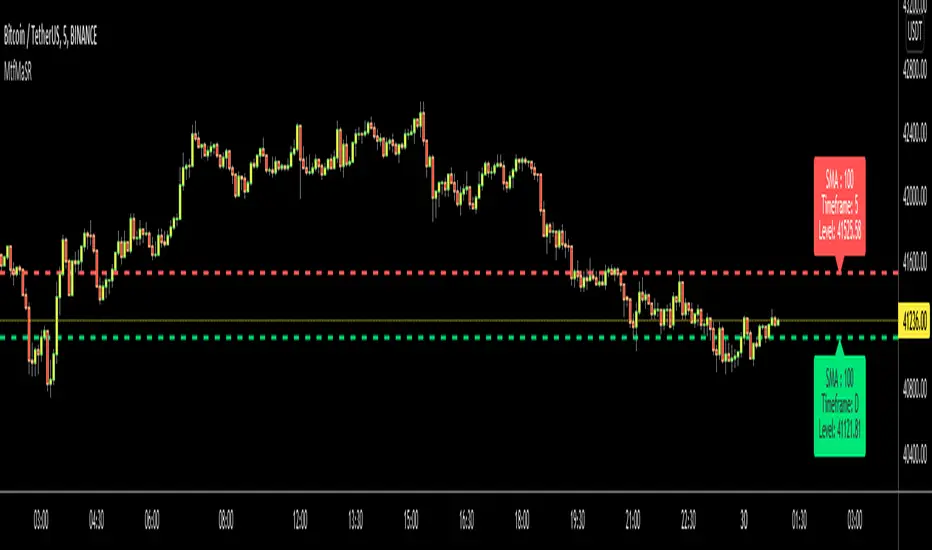
Moving Averages as Support Resistance MTFHello Traders!
As most of you know that Moving Averages with the lengths 50, 100, 150 and 200 are very important. We should use these this moving averages to figure out S/R levels, the possible reversals points, trend direction etc. we should check these moving averages on Higher Time Frames as well. for example if you look at the chart with 5mins time frame, you should also check it in 1hour and 4hour time frames to see to big picture and main trend. this is important as trend is your friend and you should not take positions against the trend.
I developed this script to show them clearly and make the chart understandable. 1 resistance line above the price and 1 support line below the price, it shows the moving average type, length, time frame and S/R level.
You have option to show SMA or EMA and to include/exclude current time frame, because you may want to see only MAs from higher time frames. you should set higher time frames accordingly.
if you add all moving averages for current and higher time frame the chart looks very crowded as following example:
The script makes it clear to understand the chart better, here an example:
It can show when S/R was broken and you get alert. here an example:
You have coloring and style options, you can change line style and colors as you wish:
Enjoy!
Step RiderRelease Note:
Idea of this script is to ride on the trend. Multiple dynamic support and resistance are identified and those levels are used
Step Lines:
There are 3 different periods by default are used to define 3 different step lines. On any trend, either of these 3 steps shall play major role
Color Strength:
Change in Red & Green color and its thickness changed based on how strong the up or down trend is.
Disclaimer:
//Disclaimer: Idea of publishing this script is to identify the strength of the instrument using multiple confirmation.
//Disclaimer: Using this indicator, changing inputs, and trading decisions are up to the users/traders.
//Courtesy: Thanks to Richard Donchian, Alan Hull as this indicator/script inspired by Donchian Channels, Hull Moving Average
ATR Trend & ATR Top/Bottom (Zeiierman)█ Overview
ATR Trend & ATR Top/Bottom (Zeiierman) blends momentum, volatility, and adaptive trend analysis into a unified framework. It fuses a dynamic oscillator with ATR-based exhaustion detection to identify trend direction, impulses, and potential reversals within the same structure.
Rather than viewing volatility as noise, this tool interprets it as trend expansion, which represents directional conviction, while contraction signals absorption or exhaustion. By combining multi-phase smoothing, adaptive ATR scaling, and contextual trend filtering, the indicator delivers a complete picture of when a market is accelerating, stabilizing, or reversing.
It performs best once a trend has matured and volatility normalizes around a directional core, giving traders the confidence to participate in established moves while dynamically managing risk.
⚪ Why This One Is Unique
Traditional trend oscillators rely on fixed parameters that degrade across assets or timeframes. ATR Trend & ATR Top/Bottom instead employs adaptive weighting and volatility-normalized filtering that automatically aligns with the current market structure.
Its framework integrates three distinct components:
Adaptive Oscillator Core that reveals the internal rhythm of trend and momentum.
ATR Top/Bottom Layer that marks exhaustion and potential turning zones.
Trend Signal & Dynamic Trailing Stop Engine that highlights directional shifts, confirms alignment with the prevailing trend, and transforms trend data into a self-adjusting risk-management system.
█ Main Features
⚪ ATR Trend (The Main Oscillator)
The ATR Trend serves as the indicator’s primary oscillator, translating price and volatility dynamics into a smooth directional curve. When the oscillator line remains above its equilibrium, bullish momentum dominates; when it stays below, bearish momentum prevails. Color transitions reflect real-time trend bias, helping traders immediately recognize whether the market is strengthening or weakening.
This component forms the structural core of the tool, defining overall trend direction, momentum intensity, and transition zones.
It also visualizes trend expansion through the fast leading signal line. When this line crosses above the upper or below the lower boundary, it signals an expansive move within the active trend, often representing short-term overbought or oversold conditions, and can also indicate trend strength in the prevailing market direction.
⚪ ATR Top/Bottom
The ATR Top/Bottom layer highlights potential exhaustion zones within the trend. Green peaks reveal areas of buy-side saturation, suggesting a possible slowdown or reversal in bullish momentum, while red peaks mark sell-side extremes, often appearing before stabilization or renewed strength. These zones help traders identify when a move is becoming stretched or losing balance, offering valuable context for managing exits, scaling out, or anticipating reversals. However, these areas can extend for a prolonged period when price is in a strong, sustained trend, reflecting persistent directional pressure rather than immediate exhaustion.
⚪ Trend Channel Hits
The Trend Channel Hits feature visualizes moments when the price interacts with the projected internal trend channel boundaries of the prevailing trend.
Green arrows appear when the price touches the upper boundary of the trend channel. This can indicate two possible outcomes:
A potential breakout from a negative trend into a developing bullish trend, as price breaks above the upper boundary of the descending channel.
A take-profit zone within an established bullish trend, as price reaches the upper channel where mean reversion is likely to occur.
Red arrows appear when the price touches the lower boundary of the trend channel. This can indicate:
A potential breakout from a positive trend into a developing bearish trend, as price breaks below the lower boundary of the rising channel.
A take-profit opportunity within an established bearish trend, as price reaches the lower channel where mean reversion or short-term recovery is likely to occur.
These signals provide early visual confirmation of trend exhaustion, continuation, or structural breakout, helping traders refine entries, exits, and profit-taking within the broader market context.
█ How to Use
⚪ Trend Following
When the oscillator line remains above the mid-level, the market is in a bullish phase. When it stays below the mid-level, the trend is bearish. Periods where the oscillator holds close to its upper or lower limits indicate strong, sustained momentum in that direction. Watch for color changes or crossovers near the mid-level, as these often signal an upcoming shift in trend control.
Bullish Trend
Bearish Trend
⚪ Trend Signals
To help traders identify and participate in trend trades, the indicator includes pre-built Trend Signals that highlight optimal entry conditions within confirmed market trends. These signals are designed to activate only once the market shows established directional momentum, ensuring higher reliability and filtering out noise from short-term fluctuations.
In addition, the indicator includes built-in take-profit markers for each signal. These serve as suggested partial exit levels, helping traders systematically secure profits while allowing the remaining position to follow the trend with the dynamic trailing stop.
Before relying on the signals, always confirm that the market has been trending for a sustained period. This ensures that entries align with genuine long-term directional strength rather than temporary volatility.
Bullish Trend Signals
Bullish Trend Signals appear during an established uptrend when the indicator detects confirmed positive momentum and stable directional structure. These signals mark potential continuation points where buyers regain control after short-term pauses or pullbacks.
The objective is to follow the trend signals, manage trades with the dynamic trailing stop, and consider taking partial profits at the inbuilt take-profit levels plotted by the indicator.
This setup works best when the market is trending clearly upward and has demonstrated consistent buying strength over time.
Bearish Trend Signals
Bearish Trend Signals occur during a confirmed downtrend, indicating that selling momentum remains dominant and the trend structure is intact. They typically appear after short-term corrective rallies, signaling that sellers are reasserting control within the broader bearish environment.
As with bullish signals, the goal is to follow the trend signals and trailing stop to capture sustained downside movement, while using the inbuilt take-profit levels to lock in partial gains as the move progresses. This approach performs best when the market is in a clear, mature downtrend with persistent selling pressure and expanding downside momentum.
⚪ Trend Impulses
Impulses represent short bursts of directional acceleration within the active trend.
A surge above the upper band reflects bullish expansion.
A move below the lower band marks bearish acceleration.
These impulses often precede short consolidations before the trend resumes. Traders can use them to scale into strong phases or take partial profits at temporary extremes.
⚪ Reversals
Enable ATR Top/Bottom to monitor momentum peaks:
Red peaks show strong selling momentum. When these peaks start to fade, it can signal that selling pressure is weakening and a potential recovery may be forming.
Green peaks show strong buying momentum. As their size shrinks, it may signal that buying pressure is slowing, and a possible pullback or reversal could follow.
⚪ Extended Trends
For traders who want to visualize intense, extended trend phases, enable the ATR Top/Bottom feature and increase the Length setting to around 30, with Sensitivity set between 40 and 50. Consider reducing the ATR Trend Length to 50 to gain clearer signals of when a trend begins and ends.
This configuration extends the ATR Top/Bottom zones across the entire duration of a major trend, making it easier to identify sustained directional strength and long-lasting momentum phases.
█ How It Works
⚪ Adaptive Oscillator Engine
The oscillator interprets directional flow through a combination of momentum mapping and volatility weighting. It continuously re-centers its equilibrium to reflect evolving market structure, producing a stable yet responsive representation of underlying trend force.
Calculation: Applies multi-domain smoothing and adaptive normalization to align amplitude with volatility while maintaining directional coherence.
⚪ ATR Top/Bottom Detection
The exhaustion layer isolates high-magnitude deviations from the current volatility envelope, identifying potential top and bottom regions where expansion may stall.
Calculation: Uses proportional volatility thresholds and dynamic range modeling to highlight statistically elevated momentum extremes without over-reacting to noise.
-----------------
Disclaimer
The content provided in my scripts, indicators, ideas, algorithms, and systems is for educational and informational purposes only. It does not constitute financial advice, investment recommendations, or a solicitation to buy or sell any financial instruments. I will not accept liability for any loss or damage, including without limitation any loss of profit, which may arise directly or indirectly from the use of or reliance on such information.
All investments involve risk, and the past performance of a security, industry, sector, market, financial product, trading strategy, backtest, or individual's trading does not guarantee future results or returns. Investors are fully responsible for any investment decisions they make. Such decisions should be based solely on an evaluation of their financial circumstances, investment objectives, risk tolerance, and liquidity needs.
سكربت مدفوع

Range & Trend (Zeiierman)█ Overview
Range & Trend (Zeiierman) is a trend-first mapping of price that fuses an adaptive Range & Trend Line, a Trend Buffer (noise gate), a volatility-aware Trend Tracker, and optional Range Levels & Candles to reveal where trend is establishing, compressing, or handing off to a ranged regime.
Execution is guided by graded Buy/Sell labels (Regular / Plus / Strong), structural HH/HL & LL/LH markers with optional Peak Profit readouts, and a multi-TF Timeframe Scanner for alignment.
⚪ Why This One Is Unique
Unlike single-source trend lines, this version layers two orthogonal stabilizers:
a Range & Trend core that adapts its band size to volatility and dispersion, and
a dynamic smoothing buffer that dampens insignificant fluctuations, ensuring only meaningful trend movements affect signal output.
Signals are graded (Regular / Plus / Strong) based on contextual conditions, allowing traders to gauge the conviction behind each trend event. Range Candles add regime context by coloring bars only when a statistically consistent range structure forms, highlighting potential consolidation or transitional market phases. A lightweight Timeframe Scanner completes the workflow, broadcasting alignment from intraday to daily without adding chart clutter.
█ Main features
⚪ Range & Trend Line – Signal Generator
Adaptive directional mapping forms the foundation of the system. It highlights the active trend through color transitions and generates graded Buy/Sell labels (Regular / Plus / Strong) to reflect the strength of confirmation. The line responds dynamically to volatility, revealing when momentum is expanding, stabilizing, or reversing.
Unlike typical reactive signal tools, this model isolates only the most strong and meaningful trend transitions — those with the structural weight to establish or extend a new long-term directional phase. Each signal represents a filtered, high-conviction shift rather than a short-term fluctuation.
⚪ Trend Buffer (Noise Gate)
A precision filter that smooths the core trend output and suppresses false flips caused by short-term noise. It enhances visual consistency and provides the confirmation layer used to promote Regular signals to Plus strength when agreement occurs between buffer and core.
⚪ Trend Tracker
A trailing validation line that tracks directional health and trend persistence. It advances only in the direction of the active move, creating an adaptive stop-like reference. Tracker alignment helps identify trend exhaustion and contributes to Strong-grade signal confirmation.
⚪ Range Levels & Candles
Contextual zones that identify periods of compression or balance. When a valid range forms, candles are shaded within it, distinguishing ranging environments from trending conditions. These zones help anticipate breakouts and define natural support and resistance areas.
⚪ Live Structure (HH/HL & LL/LH with Peak Profit)
Displays real-time structural evolution — Higher Highs/Lows during uptrends and Lower Highs/Lows during downtrends. The optional Peak Profit label shows performance since the last regime change, offering an immediate view of current trend efficiency.
⚪ Timeframe Scanner
A compact multi-timeframe alignment panel that visualizes bullish or bearish trend states across user-selected intervals. It provides fast confirmation of directional consensus, helping traders act only when the broader structure supports their chosen bias.
█ How to Use
⚪ Range & Trend Line – Signal Generator
The Range & Trend Line is the core signal engine — its color shifts mark confirmed directional changes. This is where the system produces the graded Buy/Sell signals shown as ▲ / ▼ labels. Each grade reflects how many internal layers agree at the moment of signal creation:
Regular (▲ / ▼) – Triggered by a confirmed flip in the Range & Trend core. It appears when the base trend direction changes and is the earliest signal of potential reversal.
Plus (▲ + / ▼ +) – Requires the Trend Buffer to confirm the same direction. This upgrade indicates stronger trend agreement and higher reliability.
Strong (▲ ++ / ▼ ++) – These are high-conviction continuation signals and typically occur after structural confirmation.
How to trade them: Regular signals provide early awareness; Plus signals suggest confirmation; Strong signals mark trend maturity or high-probability continuations. Always trade in the direction of the prevailing trend. Use the Trend Buffer or Live Structure to confirm the dominant directional bias before acting on a signal.
⚪ Support and Resistance
The Range & Trend Line and the Buffer Line can act as dynamic support and resistance zones. Price often reacts around these levels, confirming whether the current move is continuing or losing strength.
Look for confirmation or rejection signals near these lines. Reactions around them often mark key decision points within the active trend.
⚪ Range Levels & Candles
Highlights when price enters structured consolidation zones. Candle coloring activates only inside validated ranges, helping to identify areas that show the typical characteristics of a ranging market. These zones visually separate balanced conditions from active trends and provide context for potential transitions.
Watch how price reacts around the upper and lower range levels. Look for false or confirmed breakouts, and expect price to move between these boundaries until a clear breakout develops. Range edges can also serve as practical entry or stop zones.
█ How It Works
⚪ Range & Trend Core
The main engine that defines the chart’s directional trend line. It adapts to changing market conditions, showing a smooth and reliable view of trend strength and direction.
Calculation: Builds a range-adaptive structure whose width adjusts with current volatility. The core moves toward new highs or lows but limits pullbacks to avoid false shifts. Several smoothing methods work together to create a steady, low-lag trend path.
⚪ Trend Buffer (Noise Gate)
A stabilizing layer that keeps the main trend line steady when price noise increases. It improves visual clarity and helps confirm true direction before a trend update appears.
Calculation: Uses a feedback-based update that reacts more when movement is strong and less when noise dominates. This lets the buffer ignore minor fluctuations while staying responsive to real trend changes.
⚪ Trend Tracker
A support line that follows the main move and helps confirm when a trend remains intact. It also serves as a guide for managing active positions.
Calculation: Applies a one-way trailing system that only moves in the direction of the trend. The offset adjusts with volatility, keeping a consistent distance that tightens or widens with market energy.
⚪ Buy/Sell Signal Engine (Regular / Plus / Strong)
The signal system that classifies entries by strength and confirmation level. It reacts to real-time trend changes while filtering weak reversals.
Calculation: Detects state flips in the Range & Trend Core, checks for agreement with the buffer, and rates each signal by historical pattern support. Higher-grade signals appear only when several layers confirm continuation strength.
⚪ Range Levels & Candles
Identifies short-term balance zones and highlights candles within those areas. These zones show where price pauses before the next directional move.
Calculation: Finds upper and lower range limits based on recent highs and lows, confirming only when several bars form a stable zone. Candle colors and level lines extend slightly forward to show likely reaction areas.
⚪ Swing Points & Peak Profit
Marks key turning points and measures performance since the last reversal. It helps track the strength and duration of each movement.
Calculation: Keeps a short memory of recent pivots and updates only when a new high or low replaces the last one. The percent distance from the last flip to the current bar defines the live Peak Profit reading.
⚪ Timeframe Scanner & Alert Aggregator
Combines directional data from multiple timeframes into a single view. Alerts trigger only when all selected timeframes agree.
Calculation: Gathers the trend state from each timeframe, converts it to a simple up or down value, and compares the results. When every layer matches your chosen direction, one clear, high-confidence alert is sent.
-----------------
Disclaimer
The content provided in my scripts, indicators, ideas, algorithms, and systems is for educational and informational purposes only. It does not constitute financial advice, investment recommendations, or a solicitation to buy or sell any financial instruments. I will not accept liability for any loss or damage, including without limitation any loss of profit, which may arise directly or indirectly from the use of or reliance on such information.
All investments involve risk, and the past performance of a security, industry, sector, market, financial product, trading strategy, backtest, or individual's trading does not guarantee future results or returns. Investors are fully responsible for any investment decisions they make. Such decisions should be based solely on an evaluation of their financial circumstances, investment objectives, risk tolerance, and liquidity needs.
سكربت مدفوع

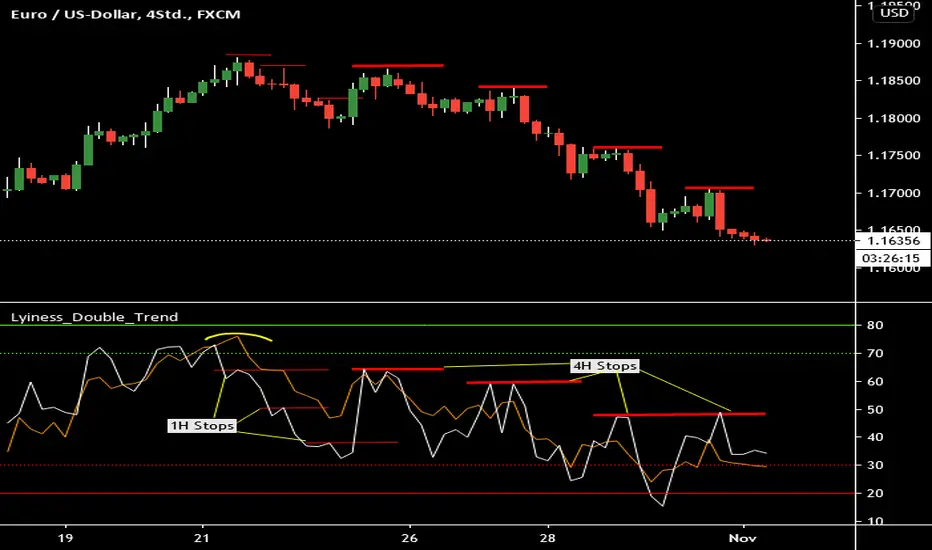
Lyiness_Double_TrendLyiness_Double_Trend/Strategie
The idea is to identify a big move in the 4H chart, which you convert into smaller trades to pull the stop into the profit zone as quickly as possible.
orange zigzag 4H
white zigzag-1H
Look for a visible trend reversal in the red and green zones at the upper and lower edges.
For example, in the settings you can change the time of the zigzag to 15 minutes in order to trade a large trend movement even more precisely.
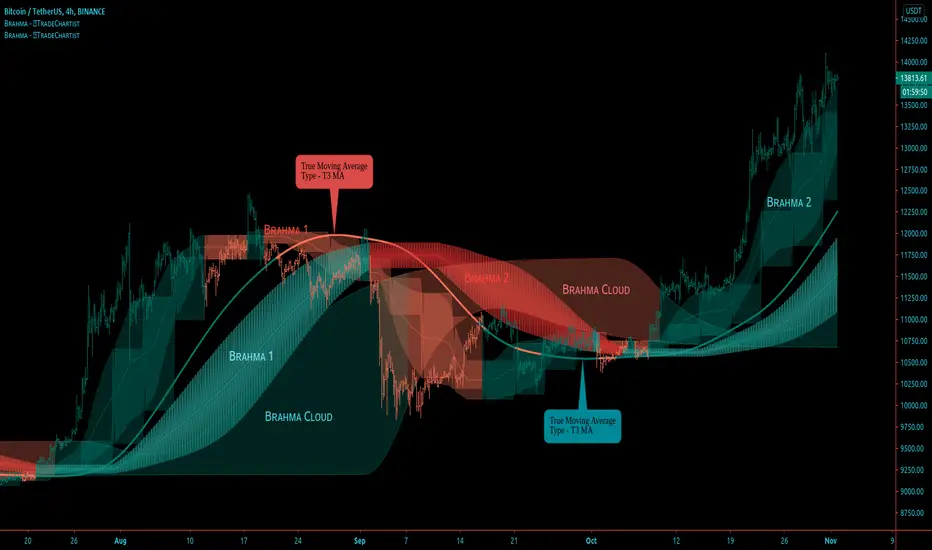
BRAHMA - Better Remodelled Adaptive Holistic Moving Average™𝗧𝗿𝗮𝗱𝗲𝗖𝗵𝗮𝗿𝘁𝗶𝘀𝘁 𝗕𝗥𝗔𝗛𝗠𝗔 (Better Remodelled Adaptive Holistic Moving Average) is an exceptionally versatile Moving Average, that can adapt, expand and transform into a better Moving Average system that consists of BRAHMA bands and BRAHMA steps, both emanating from a singular plot based on the source price and the lookback length. The system also consists of BRAHMA cloud which is based on the source price, the lookback length, the step length and the cloud factor. In addition to using the source price directly, the indicator offers 15 different Moving Average types that can be used on the source price for BRAHMA system to adapt to, offering several possibilities to visualize and trade the price action.
===================================================================================================================
™𝗧𝗿𝗮𝗱𝗲𝗖𝗵𝗮𝗿𝘁𝗶𝘀𝘁 𝗕𝗥𝗔𝗛𝗠𝗔 𝗨𝘀𝗲𝗿 𝗠𝗮𝗻𝘂𝗮𝗹
=====================================
Like any other moving average system, the source price and the lookback length determines the dynamic of BRAHMA . Source price can be selected from Sᴏᴜʀᴄᴇ dropdown and the lookback length can be enetered in the Bʀᴀʜᴍᴀ Lᴇɴɢᴛʜ input box. MA ᴛʏᴘᴇ dropdown is used to choose the type of moving average for BRAHMA to adapt to. To use the source price directly, Use Source must be selected from the dropdown.
In addition to this usual requirement, Bʀᴀʜᴍᴀ Wɪᴅᴛʜ and Bʀᴀʜᴍᴀ Sᴛᴇᴘ Lᴇɴɢᴛʜ are required to make BRAHMA moving average system complete, based on risk and reward expectations of the user.
===================================================================================================================
BRAHMA Bands and Steps
The Bands and the Steps are integral part of the BRAHMA system. When the Bʀᴀʜᴍᴀ Wɪᴅᴛʜ and Bʀᴀʜᴍᴀ Sᴛᴇᴘ Lᴇɴɢᴛʜ values are 1, the bands and steps lie dormant inside BRAHMA and they emanate from the main plot as the values are increased.
Bʀᴀʜᴍᴀ Wɪᴅᴛʜ impacts the Bands Mean line + expands or contracts the bands and Bʀᴀʜᴍᴀ Sᴛᴇᴘ Lᴇɴɢᴛʜ transforms the dormant step system (on minimum value of 1) from inside the BRAHMA bands into a powerful step/block like structure that helps find support/resistance levels and displays Bull and Bear zones based on price action in relation to the BRAHMA bands and BRAHMA steps .
Dɪsᴘʟᴀʏ Bʀᴀʜᴍᴀ Sᴛᴇᴘs plots the steps
Dɪsᴘʟᴀʏ Bʀᴀʜᴍᴀ Bᴀɴᴅs plots the bands
Enabling Cᴏʟᴏᴜʀ Bᴀʀs with Bands and Steps displayed will plot the Bull and Bear Zones on price bars and this dynamic is very different from the colouring of the bars based on the cloud as a standalone plot.
===================================================================================================================
BRAHMA Cloud
The cloud is a very useful part of this system and helps see the price action with the help of volatility of Bulls/Bears based on the lookback length, step length and the cloud factor. Price above or below the cloud helps visualize the strength of the trend along with the height/thickness of the cloud. Thinning of the cloud can signal reversals and can be used with another confirmator.
Cʟᴏᴜᴅ Fᴀᴄᴛᴏʀ (1 - 10) affects the cloud dynamic and can be changed to suit personal risk strategy and trade frequency. Cloud sensitivity is also affected by the Bʀᴀʜᴍᴀ Lᴇɴɢᴛʜ . Cloud can be used on its own with really low lookback length (even length of 1 works well).
Dɪsᴘʟᴀʏ Bʀᴀʜᴍᴀ Cʟᴏᴜᴅ plots the cloud
Enabling Bʀᴀʜᴍᴀ Cᴏʟᴏᴜʀ Bᴀʀs with Cloud displayed as the only standalone component of the indicator will plot the Bull and Bear Zones and this dynamic is very different from the colouring of the bars based on the Bands and Steps on chart. When the price enters the cloud from below after or during a period of downtrend will start painting Bull colour and when the price enters the cloud from above after or during a period of uptrend will start painting Bear colour on the price bars.
===================================================================================================================
BRAHMA Colour Scheme
The colours of the plots and fills can be changed based on user preference from the indicator settings.
There are three Themes to choose from Bʀᴀʜᴍᴀ Cᴏʟᴏᴜʀ Bᴀʀs Tʜᴇᴍᴇ (Simple, Chilli and Flame) dropdown to colour the price bars.
Enabling Bʀᴀʜᴍᴀ Cᴏʟᴏᴜʀ Bᴀʀs with Simple Theme colours the price bars based on Bull and Bear zones as explained in the sections above. Chilli and Flame themes colour the price bars with trend intensity for every bar based on the source price and lookback length.
===================================================================================================================
Alerts
Alerts can be created for Long and Short entries by using Once Per Bar Close as Alert Frequency. Entries are generated on Real time bars. It is recommended to wait for bar close before taking a position based on Trade Entries.
The indicator does not repaint and can be confidently used for alerts and trade entries without worrying about signals disappearing.
™TradeChartist BRAHMA can also be connected to ™TradeChartist Plug and Trade using 𝗕𝗥𝗔𝗛𝗠𝗔 𝗧𝗿𝗲𝗻𝗱 𝗜𝗱𝗲𝗻𝘁𝗶𝗳𝗶𝗲𝗿 as Oscillatory Signal to generate entries along with Targets, Stop Loss plots etc. Target and Stop Loss alerts can be created using Plug and Trade's Alerts system.
===================================================================================================================
Example Charts
1. The 15m chart below demonstrates how a Simple Moving Average can be transformed from a noisy pretty much untradeable MA plot to meaningful Moving Average Trade System using BRAHMA by adjusting the Width and the Step Length.
2. GBP-USD 1hr chart using 34 period Zero-Lag EMA with 21 width and 24 step length (24 hrs in a Daily candle - This helps choose length for HTF based levels)
3. NIFTY 1hr chart using 21 period TEMA (Triple Exponential MA) with 21 width and 24 step length.
4. XAU-USD Daily chart using 89 period TEMA with 24 width and 12 step length, enabling Chilli Theme based colour bars.
5. LINK-USDT 1hr chart using 21 period Hull MA with 24 width, 24 step length and cloud factor of 2 visualised using colour bars on cloud as standalone plot.
===================================================================================================================
Best Practice: Test with different settings first using Paper Trades before trading with real money
===================================================================================================================
This is not a free to use indicator. Get in touch with me (PM me directly if you would like trial access to test the indicator)
Premium Scripts - Trial access and Information
Trial access offered on all Premium scripts.
PM me directly to request trial access to the scripts or for more information.
===================================================================================================================
RSI Tops and BottomsHello Traders
This script finds Tops when RSI is in overbought area or Bottoms when RSI is in oversold area and checks the divergence between them. it checks divergence at tops/bottoms after RSI exited from OB/OS areas.
You can change overbought / oversold levels.
You can limit the time that RSI is in OB/OS area with the option "Max Number of Bars in OB/OS"
you can set the minimum/maximum distances between Tops/Bottoms with the options "Min Number of Bars between Tops/Bottoms" and "Max Number of Bars between Topss/Bottoms"
and you can set the color and line widths as you wish.
These tops or bottom must be sequential, means there mustn't be another top while checking tops or bottom while checking bottoms between them.
in next example you can see valid and invalid bottoms:
After you got signal then you better use Stop Order, a few pips higher than the high of colored candle for long positions, ( vise versa in short positions ). so you may escape from traps. ("Stop order" is filled when the price reached a pre-specified price. for example the price is now 10.0 and you set Buy Stop Order at 11.0 then if price reaches 11.0 then your buy order get filled. you can put stoploss a few pips lower than the low of colored candle or you can use ATR to decice stoploss level. how you wish)
For example in following screenshot you can see that buy stop order was not filled and you didn't take long position.
Enjoy!
