Moving Regression Band Breakout strategyFollowing the introduction of the Moving Regression Prediction Bands indicator (see link below), I'd like to propose how to utilize it in a simple band breakout strategy :
Go long after the candle closes above the upper band . The lower band (alternatively, the lower band minus the 14-period ATR or the central line ) will serve as a support line .
Exit as soon as the candle closes below the support line .
To manage the risk of false breakouts, a fixed stop loss is set to the value of the support line at the time of opening a position. When the support line moves above the position opening price, shift the stop loss to breakeven.
The same logic but in reverse applies to short positions.
As an option, it is possible to allow long entries only when the slope of the Moving Regression curve is positive (and short entries when the slope is negative).
Model parameters:
Length and Polynomial Order define the lag and smoothness of the model.
Multiplier specifies the width of the channel.
As the default model parameter values, I set those that I found to provide optimal risk / reward ratio on the daily timeframe (for both trending and range-bound market). However, the settings are very flexible and can be well-adjusted to particular market conditions. Feel free to play around and leave feedback in the comments!
Here's the original Moving Regression Prediction Bands script:
ابحث في النصوص البرمجية عن "breakout"

Vortex Range Breakout SystemThis is a Vortex Based Visual System,
Which can help you identify the Vortex Crosses based Range Breakouts/ Breakdown, over the price Scale,
How its made ?
The vortex Crosses are projected over the Price
on Same Time frame {Green and Red Filled area}
-> green Area means : Vortex Crossover Range
-> red Area means : Vortex Crossunder Range
and on Higher Timeframe
Vortex Cross Levels are Plotted, which you see as :
Blue and Orange Lines
Default Configs
Vortex Period is 14
Higher Timeframe Option is set to 60 mins
You can change the Higher timeframe to any minutes which suits your need
Also If you want to change the Higher Timeframe in Days
just know
1D = 24*60 min, = 1140mins
Enjoy!

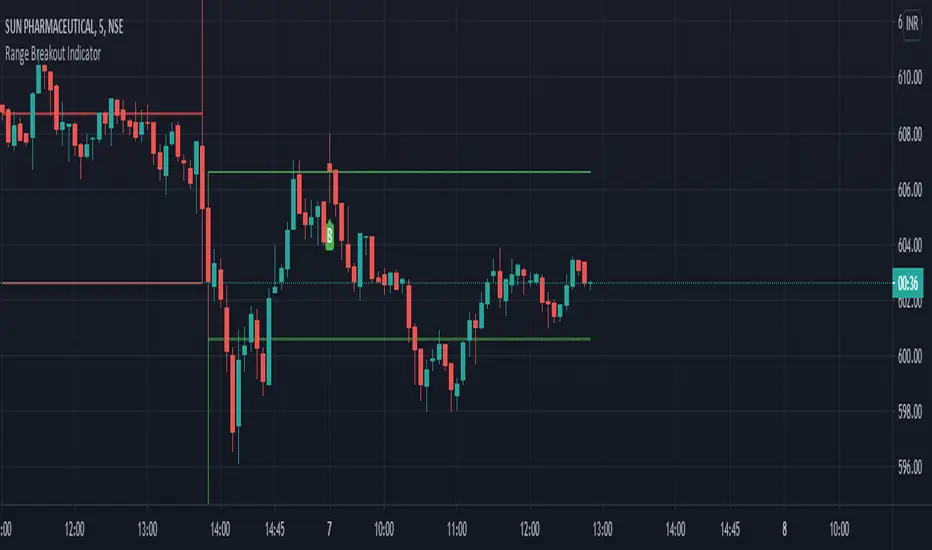
Range Breakout Indicator with trailing SLDear Traders,
This is a simple range breakout indicator where we are creating a range based on high and low of two consecutive volatile candles.
The logic is,
1) If the second candle traverse 1% up from the previous candle low (or)
2) If the second candle traverse 1% down from the previous candle high
then, the range is formed based on this high and low and
3) Buy signal will be given if the price crosses above the High
4) Sell signal will be given if the price crosses below the Low
The indication comes along with the Entry Indication, Exit Indication along with trailing SL
Option provided for changing the session time, target %, SL % and trailing SL %.
Happy Trading!
P.S: Please DM for access.
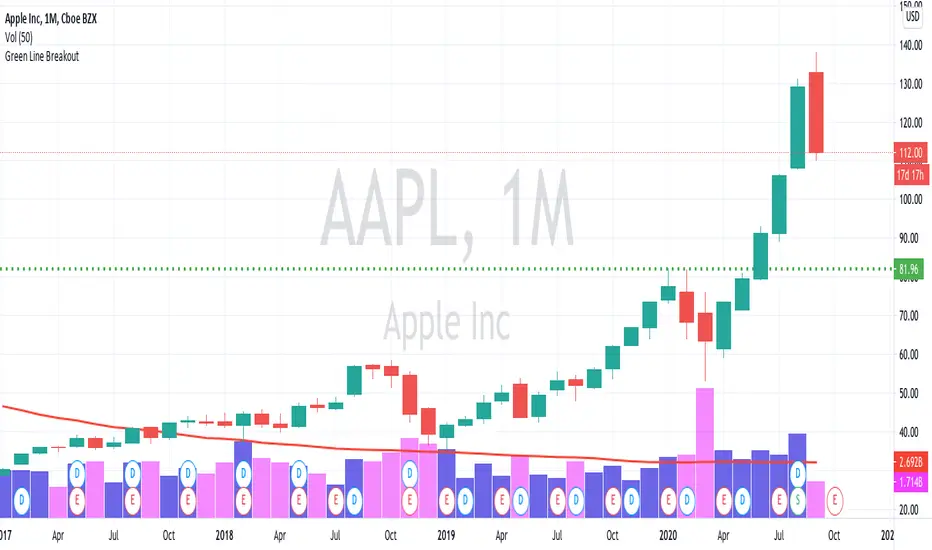
Green Line Breakout (GLB)This is an implementation of Green Line Breakout (GLB) which is popularized by Eric Wish through his Wishing Wealth Blog.
GLB indicator looks at a monthly chart for a stock that hit a new all time high recently and draw a green horizontal line at the highest price reached at any month, that has not been surpassed for at least 3 months.
In other words, this method finds stock that reached an all-time high and has then rested for at least three months. When a stock moves through the green line or is above its last green line, it is an indication of strong buying interest.
Read more about how to use the indicator in Wishing Wealth Blog.
Usage Explanation:
1. Set the time frame to Monthly for a stock and automatically a green dashed line appears based on the calculation explained above
2. If no GLB found for a stock, then green line appears at 0.0
2. If you set any other time frame other than Monthly, no Green Dashed line shown
Stock Breakout Algo by Technicaltrader615This is a Breakout Algo Suited for trading Stocks in NSE ( India) . The code looks for breakout above yesterday high and low with respect to the pivot R1 and S1. The order pings as Bracket order with 2R as target and 1R as risk. Time frame to be used is 5 mins.
We need to feed stocks with narrow range prior day for better performance.
You need to define risk in the Bridge for Each of the Stock. Lets say the stop loss is 10 points and Risk is 1000. The bridge will ping 1000/10 = 100 Shares to buy/ sell with 2R as target. the Target can be set to 3R also . This some times get rejected as Indian Stock exchange has upper circuit limit set. So we can go for 2R for ill-liquid stoks and 3R for liquid Stocks.
Similarly if 1000 Rs risk and 50 points sl , the bridge will place 1000/50 = 20 Share qty.
Breakout / Breakdown candles are Denoted by Colour change in the chart for visual purpose.
For more Details you can contact thru trading view chat window. You can also scroll down for my signature. This is only for the Students of Mine.

MARKET DYNAMICS HH LL BREAKOUTThis strategy is designed for Bank nifty and Nifty Indices on 5 min chart.This positional strategy ,go long when the long signal came and exit your buy position when sell signal generated by the strategy and again go short for next trade e g . when long signal came buy bank nifty 25 quantity ,book your profit or loss in next sell signal and again made SELL position with 25 quantity.
it is a non repainting strategy. this is just a breakout strategy and its accuracy is good. Slippages are not considered in the return.

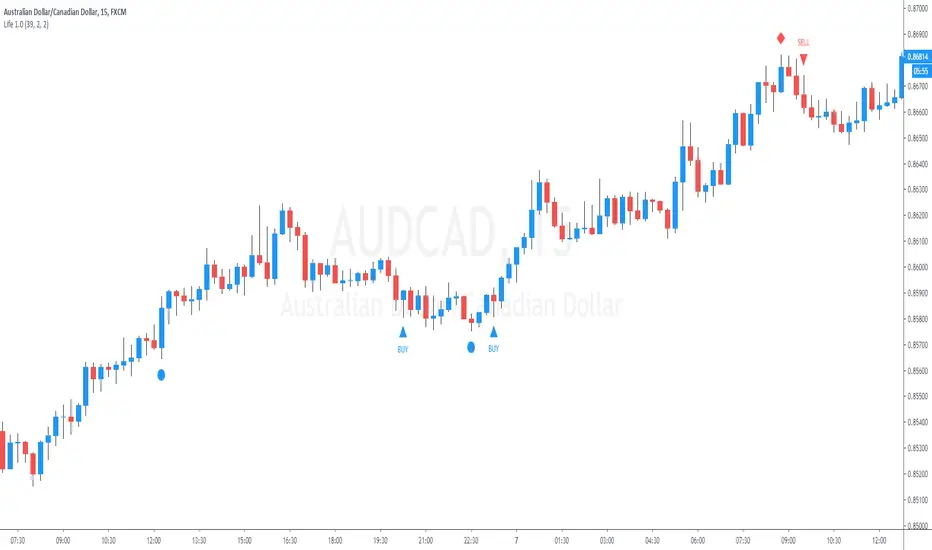
25 Life Bank BreakOutThis indicator allows the user to visually identify a swing High/Low and place a marker which will measure 2 candles either side of the swing point for the lowest body.
Once identified apply a 50% Fib to the body to ID a break out point and allow an alert to be placed.
Subsequently measures a 25% fib retracement of the breakout for a potential entry point. Alerts may also be created.
This does not provide trading signals nor is designed to do so.
It is not a trading strategy.
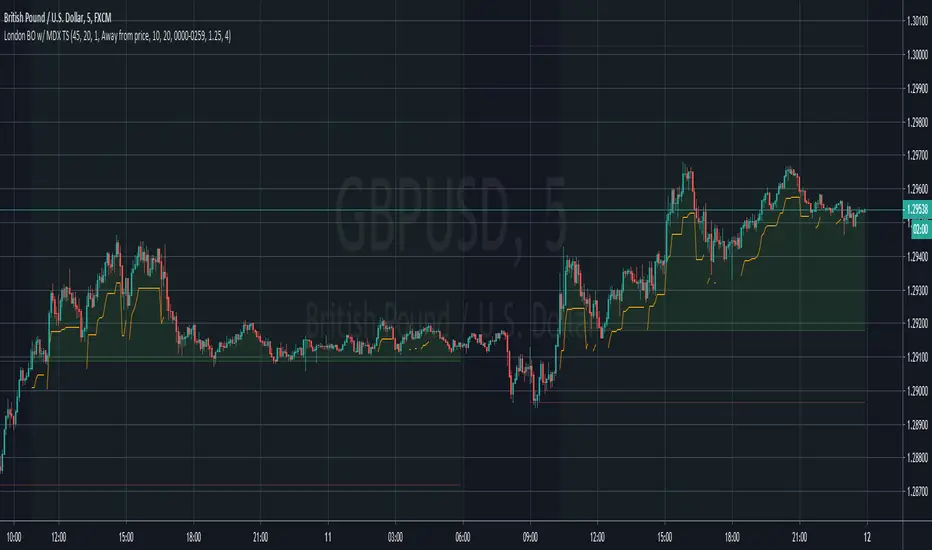
London Breakout with MDX Trailing StopThis indicator aims to aid in using the regular London Breakout strategy, as well as improve on it by adding a trailing stop based on the Mean Deviation Index.
The London Breakout strategy (according to my personal understanding) basically sees the morning before London open as the accumulation or distribution range for large buyers or sellers, and assumes the market will break either above that mornings high or below that mornings low when they start to move price. It is mostly used to trade stock indices and forex.
This indicator plots the morning high and low for each day. The green line is the morning high, and the red line is the morning low. If price moves above the green line (the morning high) it fills that area with a green color. If price moves below the green line (the morning low) it fills that area with a red color. This makes the breakouts easy to spot.
The background color of the chart turns green when the MDX is above 0 (price is more than X times ATR above the mean) and a breakout above the morning high has occurred, and stays green until the opposite happens.
The background color of the chart turns red when the MDX is below 0 (price is more than X times ATR below the mean) and a breakout above the morning high has occurred, and stays green until the opposite happens.
The default for X above is 1.0, but this can be changed in the settings by changing "ATR Multiplier".
The background is always neutral during the morning session since the morning high and morning low are not established yet.
A trailing stop is shown when price is more than X times away from the mean and a breakout has occured. The distance is set using the MDX. The trailing stop uses a separate ATR multiplier though, to make the signal and trailing stop MDX values different, if one likes. The default ATR multiplier for the trailing stop is 1.25, but this can be changed is the settings by changing "ATR multiplier for trailing stop".
When the high or low of a candle breaks the trailing stop, it is moved further away, indicating you have been stopped out, but gives opportunity to use it if you enter again (so it doesn't just disappear).
As an added bonus, take profit levels have been added based on the mornnig range. The take profit distance is set by multiplying the range with a factor. The levels are then plotted that distance from the morning high and morning low.
MDX:

Darvas Box/Turtle Way Breakouts v.2 by ZekisFor those who never heard about these two huge strategies:
* * * Darvas Box Strategy - www.netpicks.com
* * * Turtle Way Strategy - www.investopedia.com
In very short terms, both strategies are based on breakouts, probably the easiest way to trade (with proper education, obviously)
I created this indicator based on highs and lows, which will create support and resistance line, which will create a channel/box.
There is the possibility to :
- change channel/box size
- ride it till it will enter again into the channel/box
- set TPs and SL targets
- set alerts for Long, Short, Close when price enter into the channel, SL
- enable or disable 2 TP targets
- enable or disable 1 SL
- enable or disable middle line
Rules are simple:
1. Go Long when price breaks the upper line
2. Go Short when price breaks the lower line
3. Exit Long/Short when price enter into the channel/box
4. Stop Loss are added for safety
5. Added 2 layers for Take Profits
6. Added middle line that can act as Stop Loss
Legend:
1. White line - channel/box
2. Upper white line followed by green line - price cracked the channel/box - Go Long
3. Lower white line followed by red line - price cracked the channel/box - Go Short
4. Red zone - Stop Loss zone
5. Dotted red line - Stop Loss line
6. Dark green zone - first Take Profit zone
7. First dotted dark green line - first Take Profit target
8. First dotted dark green line followed by dotted lime line - price touched first Take Profit
9. Bright green zone - second Take Profit zone
10. Second dotted dark green line - second Take Profit target
11. Second dotted dark green line followed by dotted lime line - price touched second Take Profit
12. Dotted gray line - channel/box middle line
*** Don't use any indicator without knowing whatyou are doing, there is no such a magic lottery winning ticket
Trade safe!
Enjoy!
@Zekis

TradingCryptoCourse Support/ resistance BreakoutThis indicator looks for breakouts above and below the latest highs and lows.

Peso Pros Asia Breakout with AlertsAsia Breakout indicator using some magic sauce with two take profit levels and alerts to go long or short. Works on a variety of pairs as discussed in the Peso Pros group and course. SL the other side of the trade at the middle of the box or the end.
Spicytrader [BUY and SELL signals + Breakouts + Trendline]
BUY and SELL signals (with alerts)
Support and resistant breakout (with alerts)
Auto trendlines : Bullish and bearish market (with alerts)
100% Compatible with Autoview bot (Buy, Sell, Takeprofit, Stop loss)
TRY IT FOR FREE : spicytrader.com

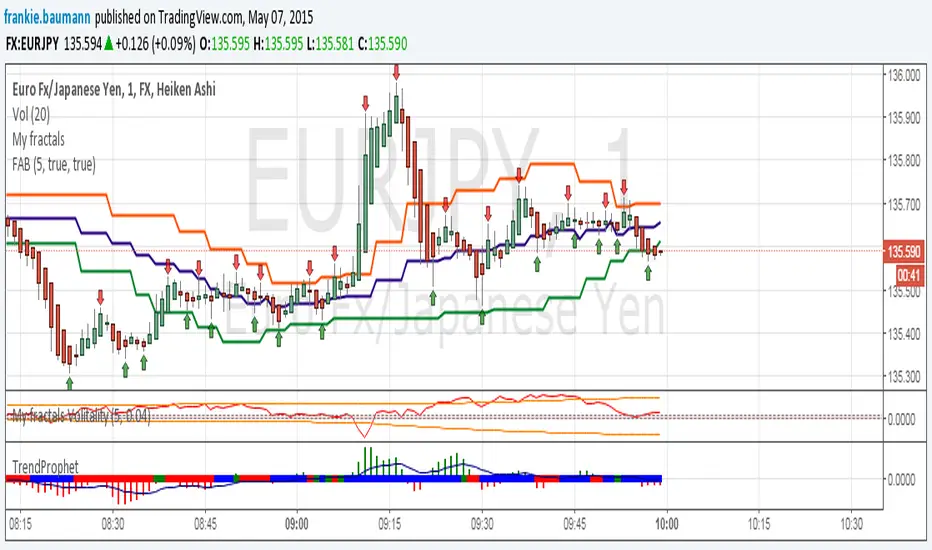
Fractals average breakout [FB]My first indicator.
A simple average of last 1 to 10 fractals (top and bottom)
Trade breakouts of top or bottom lines.
Feel free to use and experiment with.
Frank Baumann
Rectangle Breakout Patterns📊 Rectangle Breakout Pattern Detector (Support & Resistance)
This indicator is a dynamic tool designed to automatically identify and visualize Rectangle Continuation Patterns and Trading Ranges based on pure price action. It focuses on finding horizontal areas of long-term support and resistance where price is consolidating before an eventual breakout.
💡 What It Does
The core function of this indicator is to detect and plot the boundaries of significant consolidation areas on your chart. It follows a multi-step confirmation process:
Level Detection: It automatically identifies significant Pivot Highs and Lows.
Pattern Confirmation: It confirms Support and Resistance by counting the number of times price 'touches' a level (controlled by the Min Pivot Touches setting).
Visualization: Once confirmed, it draws a Box around the consolidation area. This box automatically extends to the right as long as the price remains contained, showing the active trading range.
This provides an objective, code-driven approach to a classic chart pattern often relied upon by technical analysts.

Volatility Breakout StrategyThis is a strategy used by Larry R. Williams called Volatility Breakout.
By identifying a strong uptrend that exceeds 'a certain level' on a daily basis as a breakout signal, enter long position, take advantage of long at the the next day's open.
'a certain level (Entry Price)' is calculated by { close + 'k' * high -low }, and applied logarithmic calculation.
Stop loss level is calculated by half of the previous day's Low and Entry Price.
Strategy exit always at UTC+0.
And expressed day session with the background color.
Thanks and hope this helps you.
(kor)
이건 Larry R. Williams가 사용하는 변동성 돌파 전략입니다.
특정 수준을 넘는 강한 상승세를 돌파 신호로 파악하여 매수하고, 장시간이 종료될때에 빠르게 수익을 실현하는 전략입니다.
"특정 레벨(진입가)"은 close + 'k' * high -low 로 계산되며 로그 계산을 적용했습니다.
손절 레벨은 전일 저가 및 진입 가격의 절반으로 계산됩니다.
전략은 항상 UTC+0에서 종료합니다. ( 한국 기준 오전 9시 )
그리고 배경색으로 일일세션을 표현했습니다.
트뷰에 오픈소스의 래리윌리엄스 변동성전략이 없는것 같아 간단하게나마 만들어 보았습니다. 도움이 되었으면 좋겟워요..

Fractal Breakout Strategy [KL]Fractal Breakout Strategy
This strategy will enter into a Long position when (a) bullish fractal is formed, combined with (b) ATR is relatively low. Trailing stop loss is set based on ATR.
Bullish fractal pattern :
A bullish fractal pattern looks like this:
It is formed when lower-low has reached a local minimum followed by higher-lows.
By default, this script plots the pivot point (the local minimum) using green crosses. This line will extend to the right until the next bullish fractal is formed. The local minimum pivot point is considered as key level of support. For long position entry, entry price must be higher or equal to it.
On the other hand, a bearish fractal pattern looks like the exact opposite. Reversing the logic, it is a local maximum indicated by higher-highs followed by lower-highs. This is shown by red crosses.
Why use ATR to confirm entry :
Two reasons to enter when ATR is low:
1) Since trailing stop loss is based on ATR, entering the market when ATR is low means risking less for potentially high reward.
2) Low ATR often signals price consolidation. There are two favorable scenarios, either: (i) period of accumulation, or (ii) bull flag, ideally followed by breakout.
Determining whether ATR is low :
Relative lows are quantified out by using the method in my other script: Modified ATR Indicator
The method involves applying two-tailed hypothesis testing to assess whether ATR (ie. by default lookback period of 5) has greatly deviated from a larger sample size (ie. lookback period of 50). Assuming ATR is normally distributed and variance is known, then test statistic (z) can be used to determine whether ATR5 is within the critical area under Null Hypothesis: ATR5 == ATR50. If z falls below/above the left/right critical values (ie. 1.645 for a 90% confidence interval), then ATR is determined to the relatively low/high respectively. For the purpose of assessing whether ATR is low, the left-tail is the main focus.
Profit taking :
Profits by default are taken over 3 levels based on risk to reward ratio (ie. 1R, 2R, 3R). When a target is met at each level, strategy will close out one third of current position size. Remainders (ie. already taken once at 1R, but not yet reaching 2R or 3R) will eventually be closed at the trailing stop loss price.

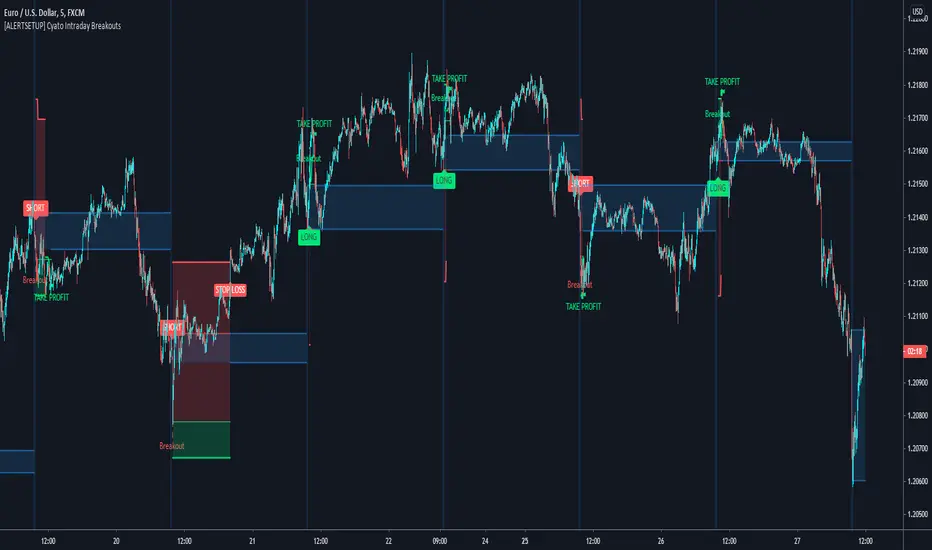
Cyatophilum Intraday Breakouts [ALERT SETUP]Private indicator.
Here is the alert version of the Triple Screen Strategy
Recap of the strategy:
The goal of this indicator is to be able to automate and backtest the strategy, all while staying on a single chart and without repainting.
Features:
Market Tide MACD configuration
Market Wave choice between 3 oscillator: Elder Force Index, Stochastic and William Percent Range
Automated Long and Short entries alerts
Integrated Trailing Stop Loss system fully configurable with automated exit alerts
Integrated Trailing Take profit system fully configurable with automated exit alerts
Indicator samples
Backtest version:
Alerts
Entry Long: Triggers on green long labels.
Take Profit Long: Triggers on the "TAKE PROFIT" green flag if the long target is reached.
Stop Loss Long: Triggers on the "STOP LOSS" or "TSSL" label if the stop loss line has been crossed.
Exit Long: Triggers on either of Take Profit Long or Stop loss long.
Entry Short: Triggers on red short labels.
Take Profit Short: Triggers on the "TAKE PROFIT" green flag if the short target is reached.
Stop Loss Short: Triggers on the "STOP LOSS" or "TSSL" label if the stop loss line has been crossed.
Exit Short: Triggers on either of Take Profit Short or Stop Loss Short.
To get access to this indicator use the link below
Thanks for reading!
Breakout/Breakdown DetectorBreakout/Breakdown Detector - Quick Overview
What it does:
This indicator automatically identifies when price breaks through key support or resistance levels, signaling potential trading opportunities.
Key Features:
📈 Breakout Detection - Alerts when price breaks ABOVE resistance (bullish signal)
📉 Breakdown Detection - Alerts when price breaks BELOW support (bearish signal)
🔊 Volume Confirmation - Optionally requires high volume to confirm the break (filters false signals)
📊 Visual Signals - Shows green triangles (breakout) and red triangles (breakdown) on chart
🎨 Support/Resistance Lines - Automatically draws key levels based on recent price action
Settings You Can Adjust:
Lookback Period (default 20) - How many candles back to find support/resistance
Volume Multiplier (default 1.5x) - How much volume needed to confirm
Breakout Threshold (default 0.5%) - How far price must break through the level
How to Use:
Add to any chart (stocks, crypto, forex, etc.)
Green triangle below bar = BUY signal (breakout)
Red triangle above bar = SELL signal (breakdown)
Set alerts to get notified automatically
Perfect for: Swing traders, breakout traders, and anyone who wants to catch momentum moves early! 🚀

ZynIQ Breakout Pro v2 - (Pro Pack)Overview
ZynIQ Breakout Pro v2 is an advanced breakout framework designed to identify high-quality expansion points from compression zones. It includes adaptive volatility filters, directional detection, optional confirmation logic and an integrated risk-mapping system for structured trade planning.
Key Features
• Adaptive breakout range detection with smart volatility filters
• Direction-aware breakout triggers
• Optional ADX or volatility conditions for confirmation
• Pullback gating to reduce low-quality continuation attempts
• Integrated Risk Helper for SL/TP structure
• Clean labels and minimal chart clutter
• Suitable for intraday and swing trading
Use Cases
• Identifying breakout moments with stronger confirmation
• Avoiding noise and clustering during choppy phases
• Structuring entries around expansion from compression
• Combining breakout signals with trend, momentum or volume tools
Notes
Breakout Pro v2 provides structural and volatility-aware breakout context. It is not a standalone trading system. Use with your own confirmation tools and risk management.

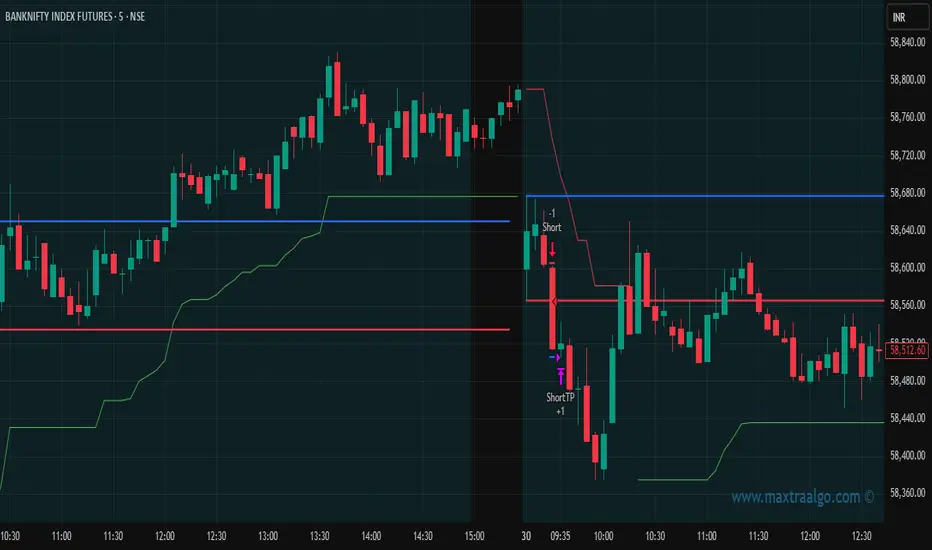
Maxtra Range Breakout StrategyRange Breakout Strategy
This strategy identifies periods of price consolidation (range) and enters trades when the price breaks above or below the defined range. A breakout above the range signals a potential uptrend (buy), while a breakout below indicates a potential downtrend (sell). It helps capture strong directional moves following low-volatility phases.
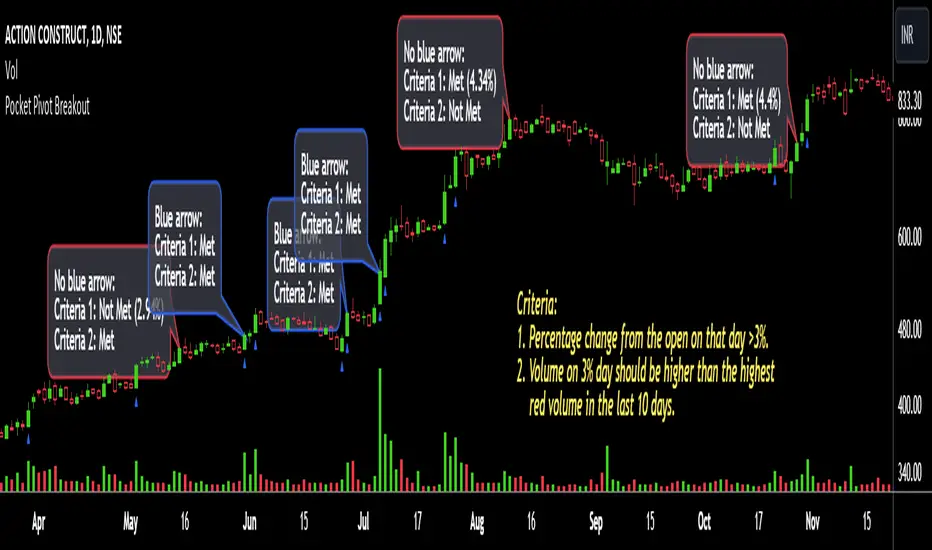
Pocket Pivot BreakoutPocket Pivot Breakout Indicator
The pocket pivot breakout indicator will show a blue arrow under the candle if both the following conditions are met:
1. The percentage change of the candle on that day from open is greater than 3%.
2. The volume on the day of 3% candle is higher than the highest red volume in the past 10 days.
The second condition is based on the 'Pocket Pivot' concept developed by Gil Morales and Chris Kacher.
If only one of the conditions is met, while the other is not, there will be no arrow.
How to use the Pocket Pivot Breakout indicator?
1. If the stock is breaking out of a proper base like (cup & handle, Darvas box etc.), you can use the blue arrow as an indicator to make your initial buy.
2. If you already own a stock, the blue arrow indicator can be used for pyramiding, following a continuation breakout from a proper base.
3. Avoid making a new entry or continuation entry if the stock is too extended from 10ma.
Gap-up > 0.5% Indicator
Gap-up Indicator displays a blue colored candle when a stock gaps up by more than 0.5% compared to previous day's close.
It is turned off by default. To activate it, check the box next to Gap-up > 0.5% in the indicator options.
How to use the Gap-up Indicator?
1. When a stock gaps up, it usually indicates strength, especially if on the day of the gap-up, the stock closes strongly.
2. This indicator should not be used in isolation but with a proper base breakout from a tight consolidation.
3. If a stock is already extended from 10ma, avoid taking any new or continuation entries.
Precautions
1. Avoid buying longs when the general market conditions are not favorable.
2. Avoid buying stocks below 200ma.
3. Avoid making a new entry or pyramid entry if a stock is too extended from 10ma.
Important Points
1. Always choose fundamentally strong stocks showing strong growth in earnings/margins/sales.
2. Buy these fundamentally strong stocks when they are breaking out of proper bases.
3. To learn more about pocket pivots and buyable gap-ups, read the book, Trade Like an O'Neil Disciple (by Gil Morales & Chris Kacher).
Cheers
Simranjit
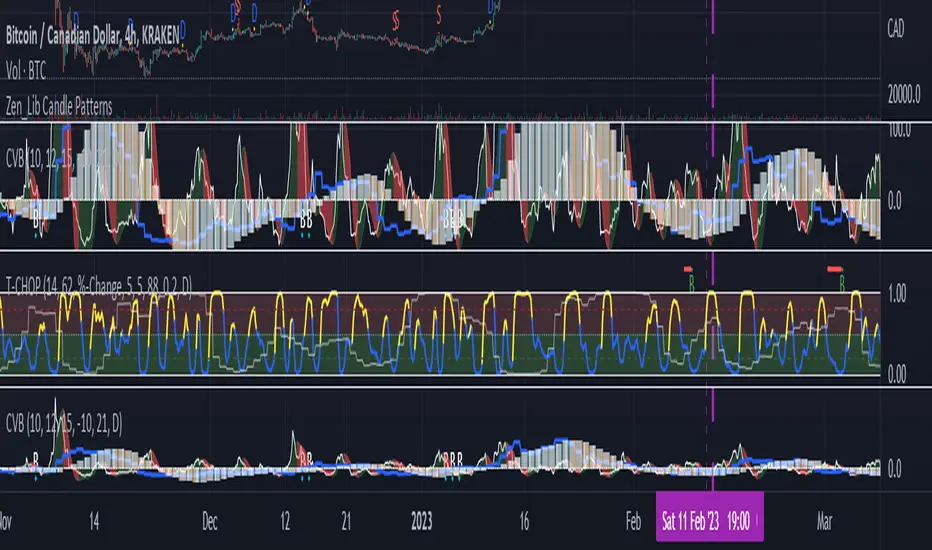
JZ_Chaikin HTF Volatility BreakoutFirst off, all credit to Harry Potter as this is a minor customization of his indicator.
Basic additions:
-- Added a Higher Timeframe that is set to Daily but can be changed. Timeframe does wait until barstate.isconfirmed so won't repaint.
-- Added HMA smoothing line to both Chart and HTF. Can be used as it's own signal, as confirmation or in combination with faster signal line -- Breakout signal & Range Highlight use both.
-- Added optional coloring of HMA based on whether increasing or decreasing.
-- Added a low volatility option that highlights Range/No Trade zones. Defval is off so needs to be selected from inputs.
Breakout Signals are very simple and both take the HTF signal and HMA. When the faster Volatility line rises from below zero and comes within the range of -10 to 0, AND the HMA signals is increasing (and also below zero) for confirmation, generates a breakout signal of an incoming big move. You can alter the breakout threshold to be greater or less than -10, I just found that works best for filtering out the noise and false signals. Won't catch everything, but pretty reliable when it does.
Tested mostly on BTC so can't vouch for other assets and would likely need modification.
I've JUST taught myself coding from scratch (and to say I'm an amateur is an understatement), so apologies in advance if anything is unclear or could be coded better. Open to any suggestions.