Trend-Following & Breakout — Index Quant Strategy (NASDAQ)📈 Trend-Following & Breakout — Index Quant Strategy (NASDAQ & S&P 500)
Type: Invite-only strategy
Markets: NASDAQ 100 (NAS100 / US100 / NQ), S&P 500 (US500 / SPX), and other major equity indices.
🧠 Concept: Continuous trend model combining EWMAC (trend-following) and Donchian (breakout) signals, scaled by forecast strength and portfolio risk.
⚙️ Execution: Rebalances only on decision-bar closes, using hysteresis and a no-trade band to reduce churn.
📊 Default bias: Long-only — aligned with equity index drift.
🧩 How it works
• EWMAC Trend: Difference between fast and slow EMAs, normalized by an EWMA of absolute returns.
• Donchian Breakout: Distance beyond a 200-bar channel (Strict mode) or relative z-score position within it.
• Forecast combination: Weighted sum of trend and breakout points, clamped to ± capPoints.
• Hysteresis: Prevents quick sign flips near zero forecast.
• Risk scaling: Maps forecast strength to position size using equity × risk budget × ATR-based stop distance.
• Rebalance: Executes only if the required quantity change exceeds the Δqty threshold; can optionally block increases on Sundays (for CFDs).
⚙️ Default parameters
Deployed on NQ / US100 / NAS100 on Daily Timeframe
• Decision timeframe = 360 min (other options from 1 min to 1 week).
• Trend (EWMAC): Fast = 64, Slow = 256, Vol Norm = 32, Weight = 0.8.
• Breakout (Donchian): Length = 200, Mode = Strict, Weight = 0.2.
• Forecast scaling: ptsPerSigma = 1.0, capPoints = 10.
• Risk % per rebalance = 4 % of equity.
• ATR stop: ATR(14) × 1.0.
• No-trade band (Δqty) = 4 units.
• Hysteresis = 2 forecast points.
• Bias = Long-only (Neutral / Long-bias 50 % optional).
• Skip Sunday increases = false (default).
📋 Backtest properties (documented)
• Initial capital = 100 000 USD.
• Commission = 0.20 % per trade.
• Pyramiding = 10.
• Calc on every tick = false.
• Point value = 1 (for NAS100 CFD).
• No financing or slippage modeled.
• If using CFDs, account for overnight funding.
• On futures (NQ / ES), carry is implicit.
📊 Typical behaviour
• Many small scratches, a few large winners.
• Performs best during multi-week / multi-month trends.
• Underperforms in tight or volatile ranges.
• Average hold ≈ 30 – 90 days in historical tests.
💡 Risk and performance guide (illustrative)
Sharpe ≈ 1.25
Sortino ≈ 1.10 – 1.30
Max drawdown ≈ –18 % to –25 %
Annual volatility ≈ 24 – 28 %
CAGR ≈ 50 – 60 % (at 4 % risk)
Edge ratio ≈ 5 (MFE / MAE)
Historical backtests only — past performance does not guarantee future results.
🌍 Intended markets and timeframes
Optimized for NASDAQ 100 and S&P 500; also effective on similar indices (DAX, Dow Jones, FTSE).
Best on Daily or higher timeframes.
Aligns with long-term index drift — suitable for long-bias systematic trend portfolios.
⚠️ Limitations
• Backtests exclude CFD funding costs.
• Trend models will have losing streaks in range-bound markets.
• Designed for experienced traders seeking systematic exposure.
🔑 Requesting access
Send a private TradingView message to with the text:
“Request access to Trend-Following & Breakout — Index Quant Strategy.”
Access is granted only on explicit request.
For further information, see my TradingView Signature.
🆕 Release notes (v1.0)
• Initial release (360 min TF): EWMAC 64/256 + Donchian 200 Strict.
• Risk 4 %, ATR × 1.0, Long-only bias, hysteresis 2 pts, Δqty ≥ 4.
• Developed for NASDAQ 100 and S&P 500 indices.
• Implements continuous risk-scaled positioning and no-trade band logic.
🧾 Originality statement
This strategy is original work built entirely from TradingView built-ins (EMA, ATR, Highest, Lowest).
It does not reuse open-source invite-only code.
Any future reuse of open scripts will be done with explicit permission and credit.
ابحث في النصوص البرمجية عن "breakout"

Swing Breakout Sequence [LuxAlgo]The Swing Breakout Sequence tool enables traders to identify a directional price action scalping sequence comprising two unsuccessful breakouts in the same direction, with the expectation of a third.
🔶 USAGE
This sequence looks for pressure on one side of a swing zone.
The market tried to break out of the zone twice but failed. This led to a pullback into the zone after each attempt. Once a reversal inside the zone is identified, the sequence is complete. It is expected that the market will move from the final reversal within the zone to the final breakout attempt outside the zone.
The sequence of price action is as follows:
Point 1: Breakout attempt out of the swing zone
Point 2: Pullback into the zone
Point 3: Breakout attempt out of Point 1
Point 4: Pullback into the zone, tapping into Point 2 liquidity
Point 5: Reversal structure with Point 4 in the form of a double top or double bottom
This sequence assumes traders will be caught off-guard when they try to capitalize on the initial breakout at Point 1, which is likely to result in a loss. If the breakout at Point 3 fails, all traders will be caught out and switch positions.
If there is enough pressure in the swing zone to cause a reversal at Point 5, the trapped traders could be the start of the next breakout attempt.
🔹 Sequence Detection
Traders can define sequence behavior and adjust detection with three parameters from the Settings panel.
Disabling Points 4 and 5 will detect the most uncompleted sequences.
🔹 Showing/Hiding Elements
Traders can change the look of sequences by showing or hiding their parts using the Style settings.
🔶 SETTINGS
Swing Length: Number of candles to confirm a swing high or swing low. A higher number detects larger swings.
Internal Length: Number of candles to confirm a internal high or internal low. A lower number detects smaller swings. It must be the same size or smaller than the swing length.
🔹 Detection
Point 4 Beyond Point 2: It only detects sequences where Point 4 is beyond Point 2.
Show Point 5: Enable/disable Point 5 detection.
Require Equal H/L at Point 5: Enable/Disable double top/bottom detection at Point 5 within a given threshold. A bigger value detects more sequences.
🔹 Style
Show Sequence Path: Enable/disable a line between sequence points.
Show Boxes: Enable/disable colored boxes for each sequence.
Show Lines: Enable/disable horizontal lines from each point of the sequence.
Default Color: Define the color or enable/disable auto color.

Breakout LevelsBreakout Levels Indicator
The Breakout Levels indicator is a tool designed to help traders identify potential breakout points based on a specified time range and market volatility. By combining user-defined time frames with Average True Range (ATR) calculations, it provides actionable entry and stop-loss levels for both upward and downward breakouts. Additionally, it includes risk management features to calculate appropriate position sizes based on your account capital and risk tolerance.
Key Features
Custom Time Range Selection: Define a specific period during which the indicator calculates the highest high and lowest low to establish breakout levels.
ATR-Based Calculations: Use the ATR to adjust entry and stop-loss levels according to market volatility.
Risk Management: Automatically calculate position sizes based on your account capital and desired risk per trade.
Indicator Inputs
Start Time : The beginning of the time range for calculating the highest high and lowest low.
End Time : The end of the time range.
Entry Multiplier: A factor that determines how far the entry level is from the breakout level, scaled by the ATR.
Stop-Loss Multiplier: A factor that determines the distance of the stop-loss from the entry level, scaled by the ATR.
Risk per Trade (%) : The percentage of your account capital you're willing to risk on each trade.
Account Capital : Your total trading capital used for position size calculations.
ATR Length : The number of periods over which the ATR is calculated.
Position Size Up / Down : Shows you Lot size to maintain no loss more than allowed percentage at that entry

Price and Volume Breakout Buy Strategy [TradeDots]The "Price and Volume Breakout Buy Strategy" is a trading strategy designed to identify buying opportunities by detecting concurrent price and volume breakouts over a specified range of candlesticks.
This strategy is optimized for assets demonstrating high volatility and significant momentum spikes.
HOW IT WORKS
The strategy first takes the specific number of candlesticks as the examination window for both price and volume.
These values are used as benchmarks to identify breakout conditions.
A trade is initiated when both the closing price and the trading volume surpass the maximum values observed within the predetermined window.
Price must be above a designated moving average, serving as the trend indicator, ensuring that all trades align with the prevailing market trend.
APPLICATION
This strategy is particularly effective for highly volatile assets such as Bitcoin and Ethereum, capitalizing on the cues from sudden price and volume breakouts indicative of significant market movement, often driven by market smart money traders.
However, for broader markets like the S&P 500, this strategy may be less effective due to less pronounced volume and price shifts compared to the cryptocurrency markets.
DEFAULT SETUP
Commission: 0.01%
Initial Capital: $10,000
Equity per Trade: 70%
Backtest result sometimes gives fewer than 100 trades under certain higher timeframes, as most trades tend to have a long holding period. Entry conditions are also more stringent, which, combined with the relatively brief history of cryptocurrencies, results in fewer trades on longer timeframes.
Users are advised to adjust and personalize this trading strategy to better match their individual trading preferences and style.
RISK DISCLAIMER
Trading entails substantial risk, and most day traders incur losses. All content, tools, scripts, articles, and education provided by TradeDots serve purely informational and educational purposes. Past performances are not definitive predictors of future results.

Range Breakout Signals (Intrabar) [LuxAlgo]The Range Breakout Signals (Intrabar) is a novel indicator highlighting trending/ranging intrabar candles and providing signals when the price breaks the extremities of a ranging intrabar candles.
🔶 USAGE
The indicator highlights candles with trending intrabar prices, with uptrending candles being highlighted in green, and down-trending candles being highlighted in red.
This highlighting is affected by the selected intrabar timeframe, with a lower timeframe returning a more precise estimation of a candle trending/ranging state.
When a candle intrabar prices are ranging the body of the candle is hidden from the chart, and one upper & lower extremities are displayed, the upper extremity is equal to the candle high and the lower extremity to the candle low. Price breaking one of these extremities generates a signal.
The indicator comes with two modes, "Trend Following" and "Reversal", these modes determine the extremities that need to be broken in order to return a signal. The "Trend Following" mode as its name suggests will provide trend-following signals, while "Reversal" will aim at providing early signals suggesting a potential reversal.
🔶 DETAILS
To determine if intrabar prices are trending or ranging we calculate the r-squared of the intrabar data, if the r-squared is above 0.5 it would suggest that lower time frame prices are trending, else ranging.
This approach allows almost obtaining a "settings" free indicator, which is uncommon. The intrabar timeframe setting only controls the intrabar precision, with a timeframe significantly lower than the chart timeframe returning more intrabar data as a result, this however might not necessarily affect the displayed information by the indicator.
🔶 SETTINGS
Intrabar Timeframe: Timeframe used to retrieve the intrabar data within a chart candle. Must be lower than the user chart timeframe.
Auto: Select the intrabar timeframe automatically. This setting is more adapted to intraday charts.
Mode: Signal generation mode.
Filter Out Successive Signals: Allows removing successive signals of the same type, returning a more easily readable chart.

Liquidity Breakout - Strategy [presentTrading]- Introduction and How It Is Different
The Liquidity Breakout Strategy is a unique trading strategy that focuses on identifying and leveraging patterns in market price data. This strategy, mainly inspired by the script "Master Pattern" by LuxAlgo, takes a different approach from many traditional strategies that rely on technical indicators or fundamental analysis. Instead, the Liquidity Breakout is based on the concept of contraction detection and liquidity levels. This approach allows traders to identify potential trading opportunities that other strategies might miss.
BTCUSDT 6h
The strategy is different from other trading strategies because it uses a unique combination of pattern detection, liquidity levels, and user-defined trading direction. This combination allows the strategy to adapt to various market conditions and trading styles, making it a versatile tool for traders.
- Strategy: How It Works
1. Contraction Detection: The strategy uses a lookback period defined by the user (default is 10 bars) to identify contractions in the market. A contraction is a period where the market is consolidating, often followed by a significant price movement. The strategy identifies contractions by finding pivot highs and pivot lows within the lookback period. If a pivot high is lower than the previous pivot high and a pivot low is higher than the previous pivot low, a contraction is detected.
2. liquidity Levels:
What are Liquidity levels? Liquidity levels, also known as liquidity pools or zones, are price levels at which there is a significant amount of trading activity. They are often areas where large institutional traders (like banks or hedge funds) have placed orders. These levels are important because they can act as support or resistance levels, and price often reacts at these levels.
In the context of this strategy, liquidity levels are used to identify potential entry and exit points for trades. When the price reaches a liquidity level, it could indicate a potential trading opportunity. For example, if the price breaks through a liquidity level, it could signal the start of a new trend. On the other hand, if the price approaches a liquidity level and then reverses, it could signal a potential reversal.
The strategy uses these two elements to identify potential trading opportunities. When a contraction is detected, the strategy will look for a breakout in the direction of the trend. If the breakout occurs at a liquidity level, the strategy will execute a trade.
The strategy also allows traders to set their stop loss based on either the Average True Range (ATR) or a fixed percentage. This flexibility allows traders to manage their risk according to their personal risk tolerance and trading style.
- Trade Direction
One of the unique features of the Master Pattern Strategy is the ability to choose the trading direction. Traders can choose to trade in the "Long" direction, the "Short" direction, or "Both". This feature allows traders to adapt the strategy to their personal trading style and market outlook.
For example, if a trader believes that the market is in an uptrend, they can choose to trade only in the "Long" direction. Conversely, if the market is in a downtrend, they can choose to trade only in the "Short" direction. If the trader believes that the market is volatile and there are opportunities in both directions, they can choose to trade in "Both" directions.
- Usage
To use the strategy, traders need to input their preferred settings, including the contraction detection lookback period, liquidity levels, stop loss type, and trading direction. Once these settings are input, the strategy will automatically detect potential trading opportunities and execute trades according to the defined parameters.
- Default Settings
The default settings for the Master Pattern Strategy are as follows:
Contraction Detection Lookback: 10
Liquidity Levels: 20
Stop Loss Type: ATR
ATR Length: 20
ATR Multiplier: 3.0
Fixed Percentage: 0.01
Trading Direction: Both
These settings can be adjusted according to the trader's personal preferences and market conditions. It's recommended that traders experiment with different settings to find the ones that work best for their trading style and goals.

Volatility Compression Breakout - LeafAlgo Pro StrategyThe Volatility Compression Breakout strategy is designed to identify periods of low volatility followed by potential breakout opportunities in the market. It aims to capture moments when the price consolidates within a narrow range, indicating a decrease in volatility, and anticipates a subsequent expansion in price movement. This strategy is based on our indicator of the same name (), but differs by offering many more options for the band/channel type and trend filters in addition to implementing the ability to use this strategy with algorithmic plug-ins (see details at the bottom).
This strategy features six types of bands/channels and five types of trend filters, for a total of 30 combinations. The six band/channel types are the Adaptive Gaussian MA channel (based on the Adaptive Gaussian MA that we previously published ()), standard Bollinger Bands, smoothed Bollinger Bands (basis is an EMA of the typical Bollinger Basis), Keltner Channels, a Quadratic Regression Channel (based on the channel that we previously published in the LeafAlgo Pro indicator ()), and Volatility-Based Mean Reversion Bands (). The five trend filters include an EMA, SMA, Weighted MA, McGinley Dynamic, and the Adaptive Gaussian MA itself.
Examples of the different band/channel types (all with EMA as the trend filter):
Adaptive Gaussian MA Channel:
Bollinger Bands:
Smoothed Bollinger Bands:
Keltner Channels:
Quadratic Regression Channel:
Volatility-Based Mean Reversion Bands:
Examples of the different trend filters (all with Keltner Channels):
EMA:
SMA:
WMA:
McGinley Dynamic:
Adaptive Gaussian MA:
How the Long/Short Entry Signals are Calculated:
A breakout signal upwards, accompanied by a long entry, is created when the high is greater than the secondary upper band (the upper band plus a standard deviation or with a multiplier, depending on which band/channel type is selected), the latest close is above the trend filter line, and the previous close was below the trend filter line. A break downwards, accompanied by a short entry, is created when the low is below the secondary lower band, the close is below the trend filter line, and the previous close was above the trend filter line. These conditions, along with a confirmed barstate, make up the strategy entry signals.
Coloration:
When the close price is above both the middle/basis and the trend filter, the bars are colored lime green, indicating a potential bullish market sentiment. When the close price is positioned above the basis but below the trend filter, or below the basis but above the trend filter, the bars are colored yellow, signifying a neutral or indecisive market condition. Conversely, when the close price falls below both the basis and the trend filter, the bars are colored fuchsia, suggesting a potential bearish market sentiment. Additionally, the coloration of the middle/basis line and the trend filter provides further visual cues for assessing the trend. When the close price is above the basis, the line is colored lime green, indicating a bullish trend. Conversely, when the close price is below the basis, the line is colored fuchsia, highlighting a bearish trend. Similarly, the trend line is colored lime green when the close price is above it, representing a bullish trend, and fuchsia when the close price is below it, indicating a bearish trend. The fill between the primary and secondary upper bands is colored lime and the fill between the primary and secondary lower bands is colored fuchsia. These colorations can be toggled on/off in the strategy settings menu.
How Changing Parameters Can Be Beneficial:
Modifying the parameters allows you to adapt the indicator to different market conditions and trading styles. For example, with Keltner Channels, increasing the compression period can help identify broader volatility patterns and major market shifts. On the other hand, decreasing the compression period provides more precise and timely signals for short-term traders. Adjusting the compression multiplier affects the width of the Keltner Channels. Higher multipliers increase the breakout threshold, filtering out smaller price movements and providing more reliable signals during significant market shifts. Lower multipliers make the indicator more sensitive to smaller price ranges, generating more frequent but potentially less reliable signals.
Changing the type of trend filter can drastically change your results. Test out each trend filter type and determine which one will work best for your purposes. Further, the MA periods in the trend filter settings can help you align your trades with the prevailing market direction. Increasing the period smoothes out the trend, filtering out shorter-term fluctuations and focusing on more sustained moves. Decreasing the period allows for quicker responses to changes in trend, capturing shorter-term price swings.
By adjusting the parameters and incorporating additional analysis techniques, you can customize the strategy to suit your trading style and preferences. However, it is crucial to exercise caution, conduct thorough analysis, and practice proper risk management to increase the likelihood of successful trades. Remember that no strategy can guarantee profits, and continuous learning and adaptation are key to long-term trading success.
Take Profit/Stop Loss Settings:
Take profit, stop loss, and trailing percentages are also included, found at the bottom of the Input tab under “TT and TTP” as well as “Stop Loss”. The take profit and stop loss levels will be reflected as green and red lines respectively on the chart as they occur. Make sure to understand the TP/SL ratio that you desire before use, as the desired hit rate/profitability percentage will be affected accordingly. The option for adding in a trailing stop has also been included, with options to choose between an ATR-based trail or a percentage-based trail. This strategy does NOT guarantee future returns. Apply caution in trading regardless of discretionary or algorithmic. Understand the concepts of risk/reward and the intricacies of each strategy choice before utilizing them in your personal trading.
Profitview/Pineconnector Settings:
If you wish to utilize Profitview’s automation system, find the included “Profitview Settings” under the Input tab of the strategy settings menu. If not, skip this section entirely as it can be left blank. Options will be “OPEN LONG TITLE”, “OPEN SHORT TITLE”, “CLOSE LONG TITLE”, and “CLOSE SHORT TITLE”. If you wished to trade SOL, for example, you would put “SOL LONG”, “SOL SHORT”, “SOL CLOSE LONG”, and “SOL CLOSE SHORT” in these areas. Within your Profitview extension, ensure that your Alerts all match these titles. To set an alert for use with Profitview, go to the “Alerts” tab in TradingView, then create an alert. Make sure that your desired asset and timeframe are currently displayed on your screen when creating the alert. Under the “Condition” option of the alert, select the strategy, then select the expiration time. If using TradingView Premium, this can be open-ended. Otherwise, select your desired expiration time and date. This can be updated whenever desired to ensure the strategy does not expire. Under “Alert actions”, nothing necessarily needs to be selected unless so desired. Leave the “Alert name” option empty. For the “Message”, delete the generated message and replace it with {{strategy.order.alert_message}} and nothing else. If using Pineconnector, follow the same directions for setting up an alert, but use the ",buy,,risk=" syntax as noted in the tooltips.
Additional Sample Settings (for ETHUSDT-Binance 45M):
Band/Channel Type - Keltner Channels (Compression Period of 20, Multiplier of 1.8x)
Trend Filter - WMA (50 length, no offset, close as the source)
TP/SL - 3.0% TP / 2.0% SL, 0.005 trailed TP, no trailed SL

Volume Breakouts v2The Volume Breakouts Indicator 2.0 is a comprehensive improvement on its predecessor "Volume Breakouts" with new features and improved performance. It offers high customization options where almost every aspect can be changed to suit your preferences.
The main functionality of the indicator is to display volume that exceeds a certain level of relative volume with a specific color, and now it also differentiates between strong up and strong down days. The legacy mode from the previous version is still available, and the calculation error has been corrected in the legacy mode.
Volume Bars in their default configuration are determined by the following factors: Up and Down days, relative volume , and a strong/weak close range. The strong/weak close range is determined by marking bars with a "strong" color only if the close price is higher/weaker than 60% or 40% of the candlestick range - otherwise the color gets downgraded by one level (for example from strong green upday to medium strong blue upday). The main options for Volume Bars are the "Multipliers", where a multiplier of 1.5 represents 150% relative volume . For example, if there is an up day closing above 60% of its range and the volume is above the defined moving average threshold times the multiplier, the bar will be colored green.
(the option: "Strong/week close range" is optional and can be disabled)
Upday and multiplier 2: green
Upday and multiplier 1: blue
Downday and multiplier 2: red
Downday and multiplier 1: pink
The indicator also integrates Pocket Pivots , which are displayed as "star" icons above the current volume bar. There are two types of Pocket Pivots:
The day's volume should be larger than the highest down volume day over the prior 10 days (Rule No. 3, Chris Kacher)
If the pocket pivot occurs in an uptrend after the stock has broken out, it should act constructively around its 10-dma." The star will appear in black if the first condition is met and red if the second condition is met. (Rule No. 4, Chris Kacher)
The signal (star) will appear in black if the first condition is met and red if the second condition is met.
A new addition to the indicator is the Dashboard of different variables, which can be individually enabled or disabled. These variables include:
Actual volume: the volume of the most recent bar
Actual dollar volume: the amount of $ traded on the most recent bar
Average volume: the average volume over a defined period of time (same as moving average)
Average dollar volume: the amount of $ traded over a defined period of time (same as moving average)
Relative volume: the relative value of the current bar compared to the moving average of the volume
Up/down volume ratio: the total of the stock's volume on days when it closes up divided by the volume traded on days when the stock closed down. The assumption is that if a stock closes up for the day, the volume was buying induced and thus the stock is under accumulation
Free floating shares: Free float, also known as public float, refers to the shares of a company that can be publicly traded and are not restricted (for example held by insiders)
Rocket Ratio: Is a value (Formula: Float/AvgVolume) which measures the liquidity of the stock. A lower value means that fewer shares can move the stock fast. The default threshold is < 150
All colors can be customized, and there is also a predefined option for dark mode.

Fibonacci Breakout Target LevelsFibonacci Extension
Fibonacci Extension is a powerful technical analysis tool that traders use to predict where the market might find support and resistance. It is based on the Fibonacci sequence and uses levels that are found by extending the 23.6%, 38.2%, 50%, 61.8%, and 100% Fibonacci ratios from a swing high or low. These levels can be used to find possible areas of support and resistance, and traders often use them to figure out when to get into or get out of a trade.
What does this indicator do?
This indicator gets five levels of the Fibonacci Extension and uses it for both the low and the high. The default lookback period is 10 days, and it checks for the highest and lowest price in that period. Then it calculates the extension levels and plots them, and it also adds a line that shows you the current breakout target levels.
How to use?
The primary use intended for this indicator is to be used to determine possible breakout target levels. Let's say you are trading a range and a breakout happens. You can use this indicator to determine possible take-profit zones and possible support and resistance zones.
Features:
Change the lookback period for the Fibonacci Extension levels.
Disable the Fibonacci Bands if you just want to see the FIB levels.
You can also change the 5 levels and add different Fibonacci numbers.
In this image, you can see how you can use this indicator to determine take-profit levels. The Fibonacci Extensions will determine potential support and resistance levels, which could be good places to exit your long or short positions.

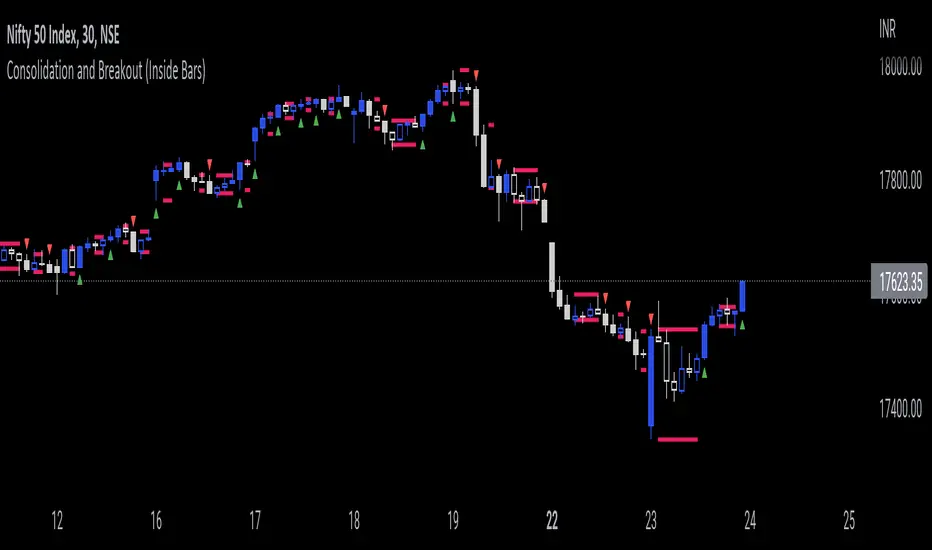
Consolidation and Breakout (Inside Bars)Consolidation indicates moments of market indecision when there is no shift in price. It is neither positive nor negative. Usually, after a price burst or strong trend movement that market falls back into a phase when traders are cautious about possible overbought or oversold positions. During this period, market reconciles before another breakout or trend emerges. Once you have identified consolidation, the next step is to keep an eye on a possible breakout.
This indicator would be useful for Breakout traders.
A candle's high and low is marked and if consequent candle fails to close above or below the marked candle, it's considered as an inside bar.
This can help breakout traders in tackling fakeouts since the wick above or below the initial candle are neglected and only the candle close above or below the range are considered as breakout.
Alpha Candle Breakout Signal on Momentum from Support Resistance
Hello traders,
Let’s start with a brief description of what this strategy/indicator is and what it does and how we trade based on Alpha Candles.
The definition of an Alpha Candle is that it is mathematically calculated, and significantly bigger than the previous candles. This could be a green candle or a red candle, as long as the body is significantly bigger than the previous candles at the end of the calculation. All calculations are done in real time, we do NOT paint the candle sticks after the close of the candle and do not use offset values. This is extremely important. You will see the candle changing it's color as the body of the candle gets bigger with real time data feed. (Recalculate On Every Tick is ON by default). Now besides the mathematical calculations, an Alpha Candle also represents the emotion in the market for that stock in that moment. We can also say that an Alpha Candle is a change in the momentum.
Now that we’ve identified the Alpha candle, the second step is, to have a look at the chart and identify if the Alpha candle is breaking to a new high / low from a consolidation period, or from a good chart pattern (ascending / descending triangle , pennant , sideways consolidation) or a sudden direction change of the stock (bounce). Remember, the script will paint all Alpha candles regardless.
NVAX day trading example
Forex
Crypto
PLUG (Bounce example)
The script will identify the Alpha candles that are breaking to a new high / low from a user input look back period (default is 20 bars back, but this can be changed by the user input). An Alpha candle that breaks the look back period, will have a stop loss line below for Green Alpha or above for Red Alpha Candle and reward targets, like target1 or target2 (both are user input fields, can be adjusted to personal R values, default values are 2R and 3R)
A 2R means two times the reward (profit) of a 1-unit risk. If you are comfortable of loosing $50 per trade which will be considered 1-unit, then 2R means $100 reward (profit) target and a 3R is $150 reward (profit) target. Those R values will be plotted and/or labelled on the chart with dollar amounts if desired. You can change your R values from the user input area, even with decimal points, like 2.5R or 3.75R. If you shoot for at least 2R, you could be wrong 6 times out of 10, and still make 2R profit, as long as the other 4 trades give you a total of 8R. This is a basic trading concept. It will force the new traders to focus on risk/reward rather then a gambling attitude.
The script is meant to work with candle stick chart patterns only, it is NOT meant to work with ranges, line charts or point and figure charts. It will work with time frames like (seconds,1,2,3,5,10 minute or any minutes, daily, weekly). If you are trading IPOs , there might not be enough data for the script to do the calculation, so just be aware.
The script will identify the candles if they are Green Alpha (going up, bullish ) or Red Alpha (going down, bearish ). In order to see them clearly, we’ve greyed out the rest of the candles, and made Green Alpha candles white, and Red Alphas are left as red. You can change the colors from the user input area.
There is also a look back period, between 1-55 and the initial value is 20 for Green Alpha and 10 for Red Alpha. So, if the Alpha Candle breaks this look back period, it will be considered as an opportunity to take the trade. The code will put the stop loss area, possible target1 and target2 areas with a blue diamond and will draw the resistance/support lines for that Alpha candle. Depending on the individual’s risk tolerance, a label on the right side of the screen will show the risk tolerance (user input value) and the number of shares to be traded based on the risk tolerance (# of shares will be for the last Alpha Candle that is formed, it will constantly update itself with the new Alpha Candle)
For those who might be familiar with the three-bar play, we implemented something similar, so the code will find them in real time. Once an Alpha Candle is formed, if the following candle is a very small candle, also called pin bar , it will be painted to orange, so you can see it clearly. This pin bar is significantly smaller than the previous candles and formed right after an Alpha Candle.
Like anything in life, nothing is free. Meaning you have to work for it. So if you are looking to buy/sell blindly based on some indicators and signals, please do not consider this script. However, once you start using it, you will see how patterns repeat, when they repeat and how they repeat. It will identify the action, but you have to check the validity from the charts, so user discretionary is advised. As an example, if the Alpha candle is breaking from a consolidation period at $10. Let’s assume stop loss is at $9 so the 2R target will be $12, but if there is a possible resistance at $11, then the trader has to decide to take the trade for a possible 1R return, or skip the trade.
We try to approach the trading as a set of rules and processing the trades one by one, with a calculated risk and reward. This script will give you the Candle stick formation that is worth consideration and will draw the Stop Loss area (you can tweak this to your liking), will draw the 2-3R Targets, and will calculate the number of shares to be purchased based on the Risk Tolerance user entered in the user input area. The rest is to let the trade take care of it self.
Charts and patterns work better, when there is enough volume in a particular stock. If the stock is trading very low in volume , things will not work as expected. So, we must focus on the abnormal stocks, like gap gainers, volume gainer stocks, or heavily traded stocks (for intraday trading). For swing or long-term traders, one could look for a Green Alpha candle, assess the risk and possible return and trade the plan on a daily chart pattern (long term), or 15,30,60 min charts for swing trades.
If you are looking to short a stock, look for stocks that are weak (gap downs), so look for Red Alpha formations in that stock.
Once the back testing is turned on, code will generate buy/sell signals, otherwise it will work as an indicator. But please keep in mind….. For day trading, the stock has to be abnormally trading, so the chart patterns and the Alpha Candles work correctly. Volume has to be more than usual. It is the best way to have predictable results for day trading. If the volume of the stock is 2-5 times or more than the average of 20 days period (early in the morning), and even more later in the day, it is a good indication that the stock is trading on an abnormal volume with some news (pre-market abnormality is a good sign for possible abnormality for that stock).
For back testing, user can select from the user input area :
• Long or Short Trades or both or use the script as an indicator
• Close any open position if an Alpha candle forms in the opposite direction
• Pyramid the trades up to 4 levels (allow to buy/sell 4 times in the same direction every time another Alpha Candle forms)
• Breakout/breakdown look back period (every time an Alpha Candle forms and breaks this look back period, it will be a trade opportunity)
• Target Reward areas
• Stop Loss area
• Time frame (change the time frame and observe which time frame made good profit. Test the plan for future trades. Test it in as many abnormal stocks for the day they were behaving abnormal as possible). Time frame is not a user input field, just the time frame of the chart, 2,5,10 min, 1 hour etc.
• Selective date testing (between two dates/times). This is very important as most of the good opportunities comes from abnormal price action with volume . If you back test with the maximum amount of data for that abnormal stock on that day, it will produce unrealistic results, because the stock will have a normal course of trend before the news. Remember, we are looking for stocks that are trading abnormal in both price and volume or stocks like AAPL , TSLA which are trading heavily on each day. It is also a good way to learn, how and when to buy/sell, where to put stop losses by observing the chart with the Alpha Candles showing the results.
• All the above values will have an impact on the total profit / loss.
F (Ford Motors)
Now that we’ve covered what the script does, let’s plan the trade and trade the plan.
Side Note:
-------------
We started coding this as an indicator to show the Alpha Candles to find opportunities in the market. Later in the development, we implemented it as a Strategy, to be able to back test the ideas, to tweak some rules for entry/exit and see the effects on our profit/loss percentages in general. We kept the original idea being an Indicator, to show us the Alpha Candles in real time. This requires the option “Indicator Mode” is to be selected from the User Input area, and leaving the “Recalculate On Every Tick” is selected from the Properties tab of the strategy (as of Pine Script v5). Strategy is turning this “On” by default.
Disclaimer: This script is an educational and personal use only tool and should be used accordingly. User can not publish any images created with this code. Do your own due diligence, do not buy / sell stocks based on any indicator, always use stop losses. We do not make any promises as this indicator or any indicator will make you a profitable trader. Trading and technical analysis is difficult, it takes time to build confidence and experience. Study the charts and candlestick formations. Study support/resistance areas and how to identify them. This will help you to tweak the script’s stop loss areas and 2R-3R targets. Do not invest any money you are not comfortable loosing.
This is an invite only strategy. We will give ample time to test it out. After that you will need to subscribe. To get access to this strategy trader can send me an email from the links below.
All the Best
Happy Trading

Range BreakoutThis indicator makes easy to identify a range breakout in both the direction
Expected input is number of days that we should expect the range to be in

Best Bulls Bears Volume trend Breakout V2 [badshah_e_alam]This is a intraday indicator. Only to be used on timeframe less than daily charts.
This indicator purely uses volume to plot the graph. The indicator helps in conforming a breakout strategy.
This indicator is advanced version of my previously developed indicator you can check this link
Total volume is made up of buying volume and selling volume . Buying volume is the number of shares, contracts, or lots that were associated with green bars, and selling volume is the number that were associated with red bars.
The labels on the right side are the current bar value and that days bulls /bears weightage.
the first value shows the current bar volume.
second value show the bulls weight in %
third value show the bears weightage throughout the day ( %)
The Blue plot in graph keeps the track of bulls movement in intraday( %)
The Red plot in graph keeps the track of bears movement in intraday ( %)
X axis is time.
Y axis ranges from 100 to -100
I use 1:2 risk to reward ratio. Do your own research.
**not a financial advice**
Example of price increasing, volume decreasing
this indicator can be used for confirming a breakout strategy with bulls or bears in action. In the current example, the buyer’s volume percentage is reducing and the price is increasing throughout the day. Hence a breakout of the trendline is confirmation of a short trade.
Example of Price reducing, volume decreasing
example of price moving down , bears losing the grip
Example of price decreasing volume increasing
Thanks to nizar9599 for giving idea to improve my previous indicator.
DISCLAIMER
Any and all liability for risks resulting from investment transactions or other asset dispositions carried out by the user based on information received or a market analysis is expressly excluded by me.
All the information made available here is generally provided to serve as an example only, without obligation and without specific recommendations for action. It does not constitute and cannot replace investment advice. We therefore recommend that you contact your personal financial advisor before carrying out specific transactions and investments.
Do your own research, This is not a financial advice.

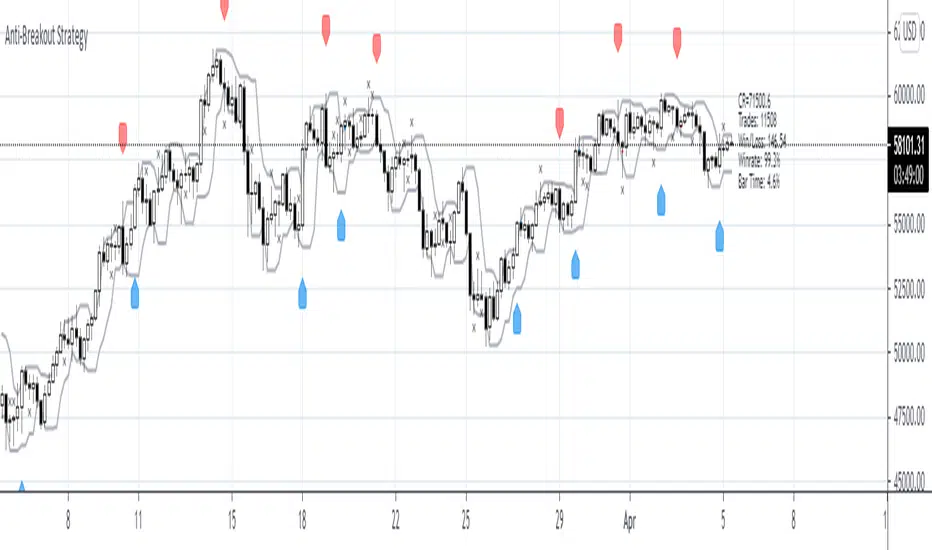
Anti-Breakout StrategyAnti-Breakout Strategy
Description:
This is a contrarian entry strategy for trading false breakouts. The high/low of the breakout bar is used for the entry in the opposite direction.
To reduce repainting set ptype variable to OHL3.
Ravih Pro Momentum BreakoutThis is a Momentum Breakout Strategy on “DAILY Timeframe”
This Breakout Strategy is specially created for Momentum Traders and for Bursa Market. The learning applied here are derived from past market behavioural approach. It takes into account of recent strength of price action and volume.
However, it can be applied for other Exchanges as well; as long as the stock is active with unusual volume.
The Momentum Set-Ups Script is designed for Short Term traders as in 3 to 60 Trading Days holding period or unless and until Exit Signal appears. Sometimes it could extend longer depending on the pace of the Momentum.
It also caters the aggressive traders as in Buy Today Sell Tomorrow/Today (BTST) and Fast in Fast Out (FIFO). These are traders...usually looking for 5% to 7% or 12% gain in a short span of time. However, do take note; momentum stocks are explosive in their moves. Therefore one could maximise the Gain Ride until Exit/Sell Signal appears.
The Script provides you the best High-Probability Profitable Set-Up Entry. The system identifies the stock/s in action Right Now. It is a powerful strategy for trading both Fast and Slow Momentum Stocks.
The Momentum Script is built around 3 Primary Factors namely…
1. Volume
2. Price Action
3. Time
And 2 Secondary Factors namely…
1. Volatility
2. Liquidity
Buy Exit/Sell Arrows are triggered based on last candle bar closed. It plots automatically.
For Long
Light Blue Up Triangle denotes Buy at the Closing Price. Entry Price is Closing Price or with + or – 2% tolerance for the following market day.
For Exit/Sell
Orange Down Triangle denotes Exit to close any remaining position to free up capital. Or...
Red Down Triangle denotes Exit to close any remaining position to free up capital.
Either one of the arrow is Final.
For Setting Up Alerts
The user has the option to Setup Alerts for chart signals that is…for Long and for Exit/Sell.
For Demonstrative purpose...
I have on purpose chosen an O&G counter from a Cold Sector from MYX. This is a time of Pandemic. Therefore, choosing Technology or Glove and Healthcare Sectors would definitely reflect good performance. The idea here is to demonstrate that the Momentum Strategy application works on all market conditions anytime of the year.
Remember...
This strategy is only built for stocks. It is Not for Indices neither for any other financial instruments.
No SHORT signals in this strategy.

TradeChartist Donchian Channels Breakout Strategy™TradeChartist Donchian Channels Breakout Strategy is the strategy backtester version of ™TradeChartist Donchian Channels Breakout Filter .
===================================================================================================================
Features of ™TradeChartist Donchian Channels Breakout Strategy
========================================================
Option to plot Donchian Channels of user preferred length, based on the Source price in addition to High/Low Donchian Channels.
Generates trade entries based on user preferred Breakout Price. For example, if the user prefers HL2 as breakout price, irrespective of the Donchian Channels type, trade entries are generated only when hl2 price (average of high/low) breaks out of the upper or lower band.
Option to plot background colour based on Breakout trend. The bull zones are filled with green background, the Bear zones are filled with red background and the bar that broke out is filled with orange background.
Option to colour price bars using Donchian Channels price trend. The Donchian Channels basis line is plotted using the same colours as coloured bars as default.
Note: This script does not repaint. To use the script for trade entries, wait for the bar close without Backtester or Strategy entries (with Backtester) and use a second confirmator (includes fundamentals) based on asset type as some markets require users to have good pulse on the fundamentals as trading by Technicals/price action dynamic alone may not be safe.
Note: Trend Based Stochastic of the same DC Length can be used from ™TradeChartist Risk Meter for Trade Confirmations too.
===================================================================================================================
Best Practice: Test with different settings first using Paper Trades before trading with real money
===================================================================================================================
This is not a free to use strategy. Get in touch with me (PM me directly if you would like trial access to test the strategy)
Premium Scripts - Trial access and Information
Trial access offered on all Premium scripts.
PM me directly to request trial access to the scripts or for more information.
===================================================================================================================

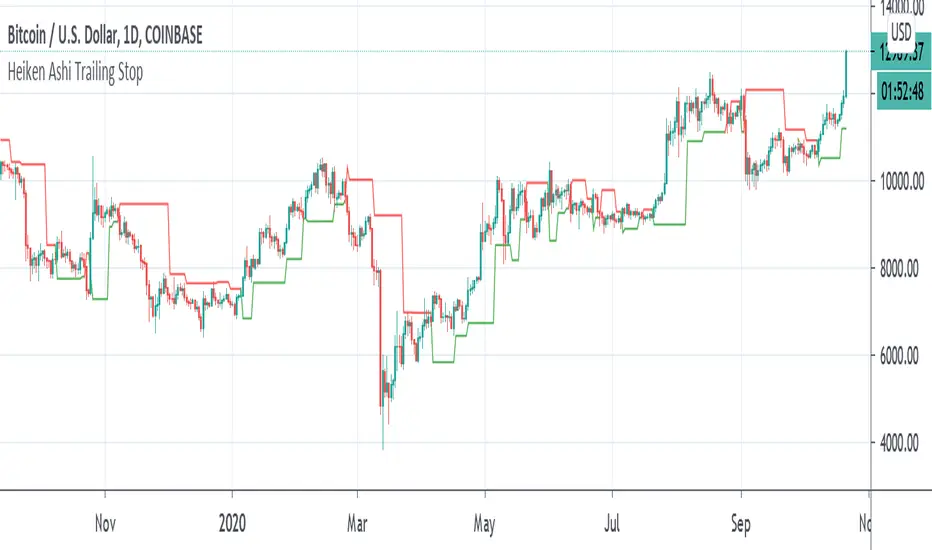
Heiken Ashi Pivot Breakout Trailing StopThis is a heiken ashi pivot based trailing stop for breakout entries and exits. It's possibly related to the Swing Index System by Welles Wilder or an alternative to it that I came up with, in case determining the swings on the Accumulative Swing Index is too much of a burden. It is believed that the ASI uses the calculation of heiken ashi in its formula. This does not use the ASI as a bottom indicator in the chart but instead uses the heiken ashi bars on the top of the chart to objectively find the swing pivots . These swings pivots act as support and resistance and can be used to confirm the start of a breakout or the end of one.
Suppose you find a chart pattern or setup, such as divergence or a pennant in the RSI , a pattern on the ASI, and/or on the chart, or the end of an elliot wave , etc and want to confirm a strong breakout and ride it to the end. Many trailing stops won't be able to confirm the beginning or would last too long or not long enough to exit out of one. On an uptrend, when the price breaks below the last swing low pivot , it can confirm the end of the breakout. On a downtrend, when the price breaks above the last swing high pivot , it can confirm the end of the breakout.
This trailing stop is not meant to replace trend following ones. The swing pivots can vary yet the price can still continue at an uptrend whereas this heiken ashi pivot based trailing stop exits as soon as it goes above or below the last resistance point. These swing points can end up being too close for trend following but can work well for breakout trading. The bigger the chart pattern or breakout, the more reliable the exit signal will be in my opinion. This is an experimental idea that I came up with from trying to interpret the ASI.
High & Low Of Custom Session - OpeningRange Breakout (Expo)High & Low Of Custom Session - OpeningRange Breakout (Expo) prints the high and the low of a custom session.
I use the indicator to trade the re-test of opening range (high/low) as well as breakouts from the opening range. The same logic can be applied to the session you have chosen.
HOW TO USE
1. Use the indicator to trade the re-tests of the session range.
2. Use the indicator to trade breakouts of session range.
INDICATOR IN ACTION
1-min chart
I hope you find this indicator useful , and please comment or contact me if you like the script or have any questions/suggestions for future improvements. Thanks!
I will continually work on this indicator, so please share your experience and feedback as it will enable me to make even better improvements. Thanks to everyone that has already contacted me regarding my scripts. Your feedback is valuable for future developments!
-----------------
Disclaimer
Copyright by Zeiierman.
The information contained in my scripts/indicators/ideas does not constitute financial advice or a solicitation to buy or sell any securities of any type. I will not accept liability for any loss or damage, including without limitation any loss of profit, which may arise directly or indirectly from the use of or reliance on such information.
All investments involve risk, and the past performance of a security, industry, sector, market, financial product, trading strategy, or individual’s trading does not guarantee future results or returns. Investors are fully responsible for any investment decisions they make. Such decisions should be based solely on an evaluation of their financial circumstances, investment objectives, risk tolerance, and liquidity needs.
My scripts/indicators/ideas are only for educational purposes!

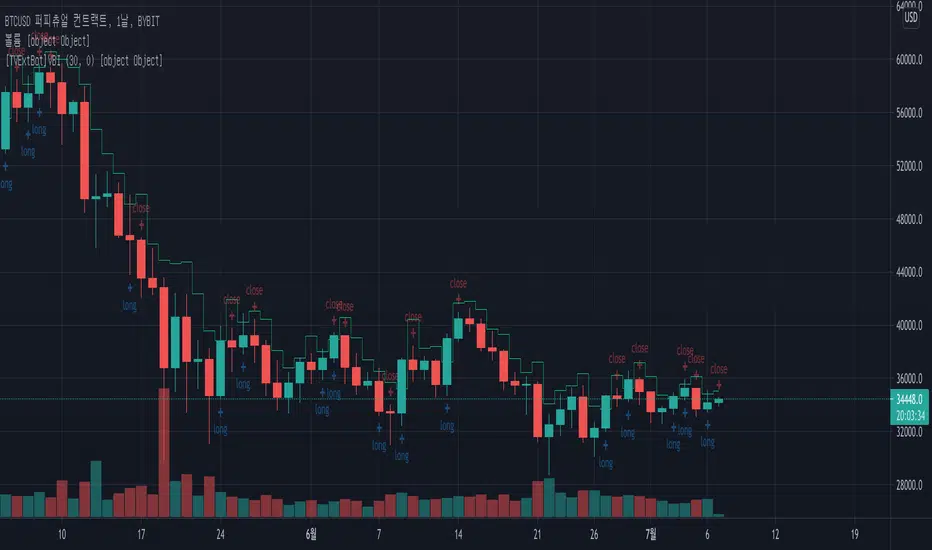
[TVExtBot]Volatility Breakout Indicator(With Alerts)Volatility Breakout Indicator(With Alerts)
It is based on the legendary trader Larry R. Williams' volatility breakout strategy.
The volatility breakout strategy is a short-term trading strategy that realizes rapid profits on a daily basis, following the upward trend of a strong upward trend that exceeds a certain level on a daily basis.
변동성 돌파 지표란 전설적인 트레이더 래리 윌리엄스(Larry R. Williams)의 변동성 돌파 전략을 기본으로 개발한 지표입니다.
변동성 돌파 전략은 일일 단위로 일정 수준 이상의 범위를 뛰어넘는 강한 상승세를 돌파 신호로 상승하는 추세를 따라가며 일 단위로 빠르게 수익을 실현하는 단기매매 전략입니다.
Areas of Support/Resistance & BreakoutA pretty little indicator showing pivotal breakouts - that is, locating critical pivot points within price action, connecting the dots and trading the breakouts from this area!
-----------
Useful for finding good entry levels, exit levels, areas of strong support/resistance and most importantly - the Breakout!
Includes "Bars to the Left" variable so you can shorten or lengthen the indicator as required.
Good Luck and Happy Trading!

ORB with Multi Breakout V.2 [MV]This ORB with Multi Breakout Indicator Session Time is Indian NSE and BSE Equity Market
This indicator Provide you 4 type Setup
Opening Range Plot Only for Observation
1st Range Breakout = Long
2nd Range Breakout = Short
3rd Range Breakout = Short
4th Range Breakout = Long
How to work This Indicator?
When Market is Open This Indicator automatically Plot Opening Range High and Low,
if Market bullish & Candle Close above Opening Range high When This Indicator automatically Plot 1st Range High and Low if You Want to 1st Range High Plot Crossingup any Candle You can Also Add Alerts
Note: When 1st Range High and Low Plot Automatically Plot 1st Range Takeprofit Buffer by Default 1 Percentage You can also Change and Add Alert.
if Bullish market Reverse Down Side and Breakout 1st Range Low Below Closing When automatically Plot 3rd Range High and low, You Can Also Add Alerts When 3rd Range Low Plot CrossingDown any Candle
Note: When 3rd Range High and Low Plot Automatically Plot 3rd Range Takeprofit Buffer by Default 1 Percentage You can also Change & Add Alert.
When Market is Open This Indicator automatically Plot Opening Range High and Low,
if Market Bearish & Candle Close Below Opening Range Low When This Indicator automatically Plot 2nd Range High and Low if You Want to 2nd Range Low Plot CrossingDown any Candle You can Also Add Alerts
Note: When 2nd Range High and Low Plot Automatically Plot 2nd Range Takeprofit Buffer by Default 1 Percentage You can also Change & Add Alert.
if Bearish market Reverse Up Side and Breakout 3rd Range High Above Closing When automatically Plot 4th Range High and low, You Can Also Add Alerts When 4th Range High Plot CrossingUp any Candle.
Note: When 4th Range High and Low Plot Automatically Plot 4th Range Takeprofit Buffer by Default 1 Percentage You can also Change & Add Alert.
If you Have any Suggestion please mention here
Thank you so much
Below some image with Other Range

ChaosSN Breakout Signals v3This signal indicator combines some key turning points including Fractals, Volume , Moving average and Momentum to try and pinpoint the moments a breakout or reversal is likely.
Purple Arrows:
Shows a possible breakout/breakdown is pending. Wait for the close and only pay attention to the most recent arrows. Place a long/short sell above or below the purple price line which will be generated at the time of the signal generated.
An ideal setup will include watching the AO/AC/Oscillator to make sure they align with the direction of the entry.
v2:
-Added labels to arrows
-Added optional rules for stricter fractal identification
-Added more toggling options to help with cleaner charting
v3:
-Added reversal signals
-Added Buy and Sell signals
Buy and Sells can be used on their own with the traditional stop losses. The ideal scenario would be to combine the Buy and Sell signals with a Fractal Breakout/Breakdown

VWMA/SMA Breakout and Divergence DetectorThis indicator compares four different values :
-Fast Simple Moving Average(SMA)
-Fast Volume Weighted Moving Average(VWMA)
-Slow SMA
-Slow VWMA
Comparing SMA's and VWMA's of the same length is a common trading tactic. Since volume is not taken into consideration when calculating Simple Moving Averages, we can gain valuable insights from the difference between the two lines.
Since volume should be increasing along with an upwards price movement, the VWMA should be greater than the SMA during a volume-supported uptrend. Thus, we can confirm an uptrend if the VWMA remains greater than the SMA. If the VWMA falls under the SMA in the midst of an upwards price movement, however, that indicates bearish divergence. The opposite is true for downtrends. If price is decreasing and volume is decreasing at the same time (as it should), then we can confirm the downtrend.
Interpreting the Graph:
If the slow SMA is greater than the slow VWMA, then the area representing the difference between the two lines is filled in red. If the slow VWMA is greater than the slow SMA, however, the area between the two is filled green.
If the fast SMA is greater than the fast VWMA, then the area between the two dotted lines is filled in red. On the other hand, the area will be filled green if the fast VWMA is greater than the slow SMA.
In addition to spotting divergences and confirming trends, the four lines can be used to spot breakouts. Typically, a VWMA crossover will precede the SMA crossover. When the fast VWMA crosses over the slow VWMA and then a SMA crossover follows shortly after, then it is a hint that a bullish trend is beginning to form.
