Squeeze Momentum Regression Clouds [SciQua]╭──────────────────────────────────────────────╮
☁️ Squeeze Momentum Regression Clouds
╰──────────────────────────────────────────────╯
🔍 Overview
The Squeeze Momentum Regression Clouds (SMRC) indicator is a powerful visual tool for identifying price compression , trend strength , and slope momentum using multiple layers of linear regression Clouds. Designed to extend the classic squeeze framework, this indicator captures the behavior of price through dynamic slope detection, percentile-based spread analytics, and an optional UI for trend inspection — across up to four customizable regression Clouds .
────────────────────────────────────────────────────────────
╭────────────────╮
⚙️ Core Features
╰────────────────╯
Up to 4 Regression Clouds – Each Cloud is created from a top and bottom linear regression line over a configurable lookback window.
Slope Detection Engine – Identifies whether each band is rising, falling, or flat based on slope-to-ATR thresholds.
Spread Compression Heatmap – Highlights compressed zones using yellow intensity, derived from historical spread analysis.
Composite Trend Scoring – Aggregates directional signals from each Cloud using your chosen weighting model.
Color-Coded Candles – Optional candle coloring reflects the real-time composite score.
UI Table – A toggleable info table shows slopes, compression levels, percentile ranks, and direction scores for each Cloud.
Gradient Cloud Styling – Apply gradient coloring from Cloud 1 to Cloud 4 for visual slope intensity.
Weight Aggregation Options – Use equal weighting, inverse-length weighting, or max pooling across Clouds to determine composite trend strength.
────────────────────────────────────────────────────────────
╭──────────────────────────────────────────╮
🧪 How to Use the Indicator
1. Understand Trend Bias with Cloud Colors
╰──────────────────────────────────────────╯
Each Cloud changes color based on its current slope:
Green indicates a rising trend.
Red indicates a falling trend.
Gray indicates a flat slope — often seen during chop or transitions.
Cloud 1 typically reflects short-term structure, while Cloud 4 represents long-term directional bias. Watch for multi-Cloud alignment — when all Clouds are green or red, the trend is strong. Divergence among Clouds often signals a potential shift.
────────────────────────────────────────────────────────────
╭───────────────────────────────────────────────╮
2. Use Compression Heat to Anticipate Breakouts
╰───────────────────────────────────────────────╯
The space between each Cloud’s top and bottom regression lines is measured, normalized, and analyzed over time. When this spread tightens relative to its history, the script highlights the band with a yellow compression glow .
This visual cue helps identify squeeze zones before volatility expands. If you see compression paired with a changing slope color (e.g., gray to green), this may indicate an impending breakout.
────────────────────────────────────────────────────────────
╭─────────────────────────────────╮
3. Leverage the Optional Table UI
╰─────────────────────────────────╯
The indicator includes a dynamic, floating table that displays real-time metrics per Cloud. These include:
Slope direction and value , with historical Min/Max reference.
Top and Bottom percentile ranks , showing how price sits within the Cloud range.
Current spread width , compared to its historical norms.
Composite score , which blends trend, slope, and compression for that Cloud.
You can customize the table’s position, theme, transparency, and whether to show a combined summary score in the header.
────────────────────────────────────────────────────────────
╭─────────────────────────────────────────────╮
4. Analyze Candle Color for Composite Signals
╰─────────────────────────────────────────────╯
When enabled, the indicator colors candles based on a weighted composite score. This score factors in:
The signed slope of each Cloud (up, down, or flat)
The percentile pressure from the top and bottom bands
The degree of spread compression
Expect green candles in bullish trend phases, red candles during bearish regimes, and gray candles in mixed or low-conviction zones.
Candle coloring provides a visual shorthand for market conditions , useful for intraday scanning or historical backtesting.
────────────────────────────────────────────────────────────
╭────────────────────────╮
🧰 Configuration Guidance
╰────────────────────────╯
To tailor the indicator to your strategy:
Use Cloud lengths like 21, 34, 55, and 89 for a balanced multi-timeframe view.
Adjust the slope threshold (default 0.05) to control how sensitive the trend coloring is.
Set the spread floor (e.g., 0.15) to tune when compression is detected and visualized.
Choose your weighting style : Inverse Length (favor faster bands), Equal, or Max Pooling (most aggressive).
Set composite weights to emphasize trend slope, percentile bias, or compression—depending on your market edge.
────────────────────────────────────────────────────────────
╭────────────────╮
✅ Best Practices
╰────────────────╯
Use aligned Cloud colors across all bands to confirm trend conviction.
Combine slope direction with compression glow for early breakout entry setups.
In choppy markets, watch for Clouds 1 and 2 turning flat while Clouds 3 and 4 remain directional — a sign of potential trend exhaustion or consolidation.
Keep the table enabled during backtesting to manually evaluate how each Cloud behaved during price turns and consolidations.
────────────────────────────────────────────────────────────
╭───────────────────────╮
📌 License & Usage Terms
╰───────────────────────╯
This script is provided under the Creative Commons Attribution-NonCommercial 4.0 International License .
✅ You are allowed to:
Use this script for personal or educational purposes
Study, learn, and adapt it for your own non-commercial strategies
❌ You are not allowed to:
Resell or redistribute the script without permission
Use it inside any paid product or service
Republish without giving clear attribution to the original author
For commercial licensing , private customization, or collaborations, please contact Joshua Danford directly.
ابحث في النصوص البرمجية عن "breakout"

Auto Channel [SciQua]Auto Channel
Purpose
Auto Channel finds the single best parallel price channel from recent price action and keeps it updated in real time. It uses ZigZag pivots to build candidate channels, scores each candidate for quality, then plots the winner. When price closes outside the channel, the script flags a breakout and can fire alerts.
How it works
1. ZigZag pivots
The script uses TradingView’s TradingView/ZigZag/7 library to generate a stream of swing highs and lows based on a percentage reversal threshold and a leg depth. These pivots are the only points the channel logic evaluates, which keeps the search fast and focused on structure rather than noise.
2. Channel candidates
From the most recent pivots, the script forms all combinations of two swing highs and two swing lows.
It computes a slope for the high line and a slope for the low line and requires that they be nearly parallel within a user-defined tolerance.
3. Quality scoring and selection
For every valid candidate, the script checks the recent pivot segments against the trial channel and computes:
Inside ratio: fraction of tested pivots that sit fully inside the channel after applying the tolerance buffer.
Violation sum: total magnitude of the breaches for any pivots outside the channel.
Current width: distance between upper and lower lines at the current bar.
The “best” channel is chosen by:
1. highest inside ratio
2. then widest current width
3. then smallest violation sum
4. Plot and projection
The upper and lower lines are anchored to the chosen pivot pairs and extend to the left. The script also projects each line to the current bar to compute the live upper and lower channel prices. Those levels drive the breakout checks and alerts.
5. Breakouts and alerts
A breakout is detected when the bar closes above the projected upper line or closes below the projected lower line, after applying the tolerance buffer. Triangle markers highlight fresh breakouts, and you can enable alert conditions to automate notification or strategy handoff.
Inputs:
ZigZag
Price deviation for reversals (%)
Default 0.2. Larger values produce fewer, larger swings. Smaller values produce more, smaller swings.
Pivot legs
Default 2. Controls the lookback depth ZigZag uses to confirm pivots.
ZigZag Color
Visual only.
Tip: If you are not seeing a stable channel, increase the ZigZag percentage to reduce minor swings.
Channel search
Number of recent pivots to consider
Default 12. Higher values search more history and try more channel combinations. Lower values make the search faster and more reactive.
Max slope difference for parallel
Default 0.0005. Maximum allowed difference between the upper and lower line slopes. Smaller values enforce stricter parallelism.
Max price tolerance outside channel
Default 0.0. A buffer added to the channel boundaries during validation and breakout checks. Use this to ignore tiny wicks that poke the lines.
Minimum inside to outside pivots ratio for valid channel (0.00–1.00)
Default 1.00. Require that at least this fraction of checked pivots lie inside the channel. For a more permissive fit, try 0.60 to 0.85.
Styling
Upper Line Color
Lower Line Color
Breakout Above Color
Breakout Below Color
Plots and visuals
Upper channel line
Lower channel line
Triangle markers on the bar that first confirms a close outside the channel, above or below.
Lines extend left from their pivot anchors. Projection to the current bar is used internally to test for breakouts and to set alerts.
Alerts
The script defines two alert conditions:
Close Above Channel
Triggers when the bar closes above the projected upper line plus tolerance.
Close Below Channel
Triggers when the bar closes below the projected lower line minus tolerance.
Practical usage
Trend channels
In a steady trend, a high inside ratio with a moderate width often highlights the dominant channel. Consider trend entries near the lower line in an uptrend or near the upper line in a downtrend, with exits or stops beyond the opposite boundary.
Breakout trades
Combine the channel breakout alert with volume or a separate momentum filter. The tolerance input helps avoid false triggers from small wicks.
Tuning for timeframe and symbol
• Faster markets or lower timeframes usually benefit from a larger ZigZag percentage and a smaller pivot count.
• Slower markets or higher timeframes can use more pivots and a tighter slope difference to enforce cleaner geometry.
Notes and limitations
Channels are derived from ZigZag pivots. If your ZigZag settings change, the detected channel will also change.
The script plots only the single best channel at any time to keep the chart clean.
Breakout markers appear on confirmed bars. For historical bars, markers appear only where a breakout would have been confirmed at that time.
Lines extend left from their anchors. The script projects the lines internally to the current bar for checks and alerts.
License and attribution
License
Creative Commons Attribution-NonCommercial 4.0 International (CC BY-NC 4.0).
Open source for educational and personal use only. Commercial use requires written permission.
Attribution
© 2025 SciQua — Joshua Danford
Libraries
Uses TradingView/ZigZag/7.
Changelog
v1.0
Initial release. Automatic parallel channel detection from ZigZag pivots, quality scoring, live plotting, and close-based breakout alerts.
FAQ
Why do I not see any channel sometimes?
There may not be a valid pair of highs and lows that pass the slope, inside ratio, and tolerance checks. Loosen the constraints by increasing Max slope difference, lowering Minimum inside ratio, or increasing the ZigZag percentage.
The channel looks too narrow or too wide?
Adjust Number of recent pivots and Minimum inside ratio. A higher inside ratio tends to favor cleaner, sometimes wider channels. A lower ratio may admit narrower, more reactive channels.
How can I reduce false breakout alerts?
Increase Max price tolerance outside channel to ignore small wicks. Add a volume or momentum confirmation in your personal alert workflow.
Thank you for using Auto Channel . Feedback and improvements are welcome.

Auto Trendlines [AlgoXcalibur]Effortlessly visualize trendlines.
This algorithm does more than just draw lines connecting structural swing points — it reveals dynamic support & resistance breakouts with clarity and precision while significantly reducing your workload compared to the hassle of manually drawing trendlines.
🧠 Algorithm Logic
This advanced Auto Trendlines indicator delivers clear market structure through an intelligent multi-fractal design, revealing useful swing structures in real time. For those seeking maximum awareness, the optional Micro Trendlines (Dotted) constantly monitors even the most recent and minor structural shifts — keeping you fully in tune with evolving market dynamics. A Break Detection Engine constantly monitors each trendline and provides instant visual feedback when structural integrity is lost: broken lines turn gray, stop extending, and remain visible to enhance clarity and situational awareness. The algorithm is carefully refined to prevent chart distortion commonly caused by forcing entire trendline structures into view — preserving a natural and accurate charting experience. To further ensure optimal readability, an integrated Clutter Control mechanism limits the number of visible trendlines — focusing attention only on the most relevant structures.
⚙️ User-Selectable Features
• Micro Trendlines (Dotted): Ultra-responsive short-term trendlines that react to even the smallest structural shifts — ideal for staying ahead of early trend changes.
• Broken Trendline Declutter: Enable to display only the most recent broken trendlines to simplify chart visuals and maintain clarity, or disable to analyze previous price action.
💡 Modern Innovation
Auto Trendline indicators are often inaccurate, clumsy, and rely on slow methods that fail to adapt. AlgoXcalibur’s Auto Trendline indicator takes a modern, refined approach — combining smart pivot logic for both speed and stability, dynamic break detection with clear visual cues, and displaying only the most relevant trendlines while prioritizing accuracy, preventing distortion, and reducing clutter — automatically.
🔐 To get access or learn more, visit the Author’s Instructions section.

15-Min Opening Range Breakout STEP-BY-STEP RULES
1. Define the Opening Range (OR)
Mark the high and low of the first 15-minute candle of the session.
This creates your Opening Range.
Example: London session opens at 08:00 GMT. Use the 08:00–08:15 candle.
2. Set Entry Triggers
Buy Breakout: Place a Buy Stop order 1 pip above the Opening Range high.
Sell Breakout: Place a Sell Stop order 1 pip below the Opening Range low.
⚠️ Only one side should be triggered. Cancel the opposite order once one is active.
3. Set Stop Loss (SL)
For Buy trades:
SL = Opening Range Low - 2 pips
For Sell trades:
SL = Opening Range High + 2 pips
This ensures you give the price enough space, while keeping risk controlled.
4. Set Take Profit (TP)
Use either of these two approaches:
✅ Fixed Risk-Reward (Preferred)
Target 1: TP = 2R (i.e., 2 × SL distance)
Target 2 (optional): Leave runner for 3R or trail stop behind minor S/R
✅ Fixed Pip Target (alternative)
TP = +50 pips
SL = -20 pips
Matches your preferred risk model of 20 SL / 50 TP
5. Trade Management
If no breakout occurs within 1 hour, cancel the pending orders. No trade that day.
If trade triggers but fails to move, consider time-based exit after 2 hours.
Optional: Move SL to breakeven once price moves 1R in your favor.

PivotBox by Nadeem Al-QahwiPivotBox by Nadeem Al-Qahwi
General Idea of the Indicator: The PivotBox indicator is an advanced technical analysis tool designed to identify key reversal points in the market based on pivot highs and pivot lows. The indicator helps traders to detect breakout and breakdown opportunities based on past price movements, guiding informed trading decisions.
Indicator Functions:
Key Reversal Points (Pivot Points):
The indicator identifies pivot highs and pivot lows over a user-defined period, helping traders spot significant price levels in the market.
These points are plotted on the chart, showing where market reversals may occur.
Breakouts and Breakdowns:
The indicator identifies breakouts when the price moves above a pivot high or breakdowns when the price falls below a pivot low.
Once these breakouts or breakdowns are detected, the indicator draws lines indicating the critical price levels for visual reference.
Trend Levels using Zero-Lag MA:
The indicator includes an option to add a Zero-Lag Moving Average (Zero-Lag MA) to display the overall trend in the market. This moving average helps filter out noise and identify the general market direction, improving trade decision-making.
Line Styles:
The pivot points (highs and lows) are displayed using different line styles, such as solid, dashed, or dotted lines. The user can customize the style based on their preference.
These lines represent the breakouts or breakdown levels in the market.
Alerts:
The indicator can activate alerts when a breakout or breakdown occurs. Users can customize the alerts to notify them when specific conditions are met, ensuring that they do not miss significant price movements.
Input Variables:
Period (prd): The time period over which the pivot highs and lows are calculated. The user can define this period based on their trading strategy.
Max Breakout Length (bo_len): The maximum time duration for a breakout or breakdown to occur. This variable helps determine the relevance of the price movement.
Threshold Rate (cwidthu): The width percentage that helps to define the price area for breakouts and breakdowns.
Line Style (lstyle): Allows the user to choose the style of lines used to display the pivot points (solid, dashed, or dotted).
Minimum Number of Tests (mintest): The minimum number of tests required before a breakout or breakdown is considered valid.
How the Indicator Works:
The indicator first calculates the pivot highs and lows based on the user-defined period (Period).
It then tracks price movements to detect if a breakout or breakdown occurs.
When a breakout or breakdown is confirmed, the indicator draws lines at these levels and shows the user the new price direction.
Alerts can be triggered based on predefined conditions such as when a breakout or breakdown occurs.
The Zero-Lag MA helps the user visualize the trend, adding another layer of analysis to the market movements.
Key Benefits:
Accurate Reversal Point Analysis: Helps traders identify key entry and exit points based on precise technical analysis.
Breakout and Breakdown Detection: Allows traders to spot breakout and breakdown opportunities in real-time.
Customizable Alerts: Users can set up alerts to notify them when a breakout or breakdown happens, ensuring they don't miss important market moves.
Flexible Customization: The indicator offers various options to customize the display (line styles, alerts, trendlines), catering to different trading strategies.

London Breakout Tracker - Box Style📊 London Breakout Tracker (Pine Script v6)
This script is designed to track the Asian session range and identify breakout opportunities when the London session begins. It highlights high-probability trade setups and helps avoid fakeouts or overly wide ranges.
🧱 1. Session Time Definitions (Adjusted for Kenyan Time)
The Asian session is defined as:
3:00 AM to 11:00 AM (Kenyan Time)
🔐 2. Asian Session High & Low
During the Asian session:
The script tracks the highest high and lowest low to define the range.
These are stored in variables: asianHigh and asianLow.
🧊 3. Box Drawing for the Asian Range
Once the Asian session ends:
A visual box is drawn around the session using box.new().
This box spans from the session start to end bars and from the high to low.
It helps visually see the range price must break out from.
🚨 4. Breakout Signals
After the Asian session:
A Long Breakout signal is generated if:
The candle closes above the Asian High.
A Short Breakout signal is generated if:
The candle closes below the Asian Low.
This corresponds to 00:00 to 08:00 UTC
These are shown with:
✅ Green up label for long breakouts
❌ Red down label for short breakouts
🧯 5. Fakeout Detection
If price breaks out but closes back inside the Asian range, it’s marked as a Fakeout:
Long Fakeout: Price breaks above high, then closes back below.
Short Fakeout: Price breaks below low, then closes back above.
These are marked with orange X-crosses above or below candles.
⚠️ 6. Wide Range Filter
If the Asian session range is too wide (e.g. > 40 pips), a gray background is drawn.
This warns you not to trade that day since breakouts from wide ranges are unreliable.
📣 7. Alert Conditions
The script can trigger alerts in TradingView when:
🔔 A Long or Short Breakout occurs
⚠️ A Fakeout is detected
You can set these up via the TradingView alert system.
🎯 Overall Purpose:
The script helps you:
Clearly see the Asian session range
Identify breakout opportunities at the London open
Avoid trading during fakeouts or wide-range sessions
Get alerted when breakout/fakeout conditions occur

Reversal & Breakout Strategy with ORB### Reversal & Breakout Strategy with ORB
This strategy combines three distinct trading approaches—reversals, trend breakouts, and opening range breakouts (ORB)—into a single, cohesive system. The goal is to capture high-probability setups across different market conditions, leveraging a mashup of technical indicators for confirmation and risk management. Below, I’ll explain why this combination works, how the components interact, and how to use it effectively.
#### Why the Mashup?
- **Reversals**: Identifies overextended moves using RSI (overbought/oversold) and SMA50 crosses, filtered by VWAP and SMA200 trend direction. This targets mean-reversion opportunities in trending markets.
- **Breakouts**: Uses EMA9/EMA20 crossovers with VWAP and SMA200 confirmation to catch momentum-driven trend continuations.
- **Opening Range Breakout (ORB)**: Detects early momentum by breaking the high/low of a user-defined opening range (default: 15 bars) with volume confirmation. This adds a time-based edge, ideal for intraday trading.
The synergy comes from blending these methods: reversals catch pullbacks, breakouts ride trends, and ORB exploits early volatility—all filtered by trend (SMA200) and anchored by VWAP for context.
#### How It Works
1. **Indicators**:
- **EMA9/EMA20**: Fast-moving averages for breakout signals.
- **SMA50**: Medium-term trend filter for reversals.
- **SMA200**: Long-term trend direction to align trades.
- **RSI (14)**: Measures overbought (>70) or oversold (<30) conditions.
- **VWAP**: Acts as a dynamic support/resistance level.
- **ATR (14)**: Sets stop-loss distance (default: 1.5x ATR).
- **Volume**: Confirms ORB breakouts (1.5x average volume of opening range).
2. **Entry Conditions**:
- **Long**: Triggers on reversal (SMA50 cross + RSI < 30 + below VWAP + uptrend), breakout (EMA9 > EMA20 + above VWAP + uptrend), or ORB (break above opening range high + volume).
- **Short**: Triggers on reversal (SMA50 cross + RSI > 70 + above VWAP + downtrend), breakout (EMA9 < EMA20 + below VWAP + downtrend), or ORB (break below opening range low + volume).
3. **Risk Management**:
- Risks 5% of equity per trade (based on the initial capital set in the strategy tester).
- Stop-loss: Based on lowest low/highest high over 7 bars ± 1.5x ATR.
- Targets: Two exits at 1:1 and 1:2 risk:reward (50% of position at each).
- Break-even: Stop moves to entry price after the first target is hit.
4. **Backtesting Settings**:
- Commission: Hardcoded at 0.1% per trade (realistic for most brokers).
- Slippage: Hardcoded at 2 ticks (realistic for most markets).
- Tested on datasets yielding 100+ trades (e.g., 2-min or 5-min charts over months).
#### How to Use It
- **Timeframe**: Works best on intraday (2-min, 5-min) or daily charts. Adjust `Opening Range Bars` (e.g., 15 bars = 30 min on 2-min chart) for your timeframe.
- **Settings**:
- Set your initial equity in the TradingView strategy tester’s "Properties" tab under "Initial Capital" (e.g., $10,000). The script automatically risks 5% of this equity per trade.
- Adjust `Stop Loss ATR Multiplier` or `Risk:Reward Targets` based on your risk tolerance.
- Note that commission (0.1%) and slippage (2 ticks) are fixed in the script for backtesting consistency.
- **Execution**: Enter on signal, monitor plotted stop (red) and targets (green/blue). The strategy supports pyramiding (up to 2 positions) for scaling into trends.
#### Backtesting Notes
Results are realistic with commission (0.1%) and slippage (2 ticks) included. For a sufficient sample, test on volatile instruments (e.g., stocks, forex) over 3-6 months on lower timeframes. The default 1.5x ATR stop may seem wide, but it’s justified to avoid premature exits in volatile markets—feel free to tweak it with justification. The script assumes an initial capital of $10,000 in the strategy tester for the 5% risk calculation (e.g., $500 risk per trade); adjust this in the "Properties" tab as needed.
This mashup isn’t just a random mix; it’s a deliberate fusion of complementary strategies, offering traders flexibility across market phases. Questions? Let me know!

Bollinger Bands MTF & Kalman Filter | Flux Charts📈 Multi-Timeframe Kalman Filtered Bollinger Bands Indicator
Introducing our MTF Kalman Filtered Bollinger Bands – a powerful multi-timeframe Bollinger Bands (BB) indicator enhanced with Kalman filtering for superior smoothing and trend analysis. This indicator dynamically adapts Bollinger Bands across multiple timeframes while incorporating volume-based gradient transparency to highlight significant price movements. This indicator is better optimized for lower timeframes.
❓ How to Interpret the Bands & Volume Gradient:
Our indicator combines Lower Timeframe (LTF) and Higher Timeframe (HTF) Bollinger Bands to provide a comprehensive trend analysis. It applies Kalman filtering to the LTF bands, ensuring smoother, noise-reduced signals. The color gradient and relative volume-based transparency offer deeper insights into price strength.
🔹 LTF Bollinger Bands: Shorter-period bands filtered with a Kalman smoothing algorithm, reducing lag and noise.
🔹 HTF Bollinger Bands: Traditional Bollinger Bands plotted on a higher timeframe, offering macro trend analysis.
🔹 Volume Gradient Transparency: The bands adjust their opacity based on relative buy/sell volume, allowing traders to assess momentum strength.
📌 How Does It Work?
1️⃣ Multi-Timeframe Bollinger Bands Calculation
The LTF BB uses Kalman filtering for a smoother price representation, helping to reduce false signals.
The HTF BB is EMA-smoothed for improved trend clarity.
2️⃣ Adaptive Gradient Transparency
The opacity of the fill color between the bands is determined by relative buy/sell volume.
Higher buy volume = stronger bullish signal (greener bands).
Higher sell volume = stronger bearish signal (redder bands).
3️⃣ Dynamic Trend Signals & Breakouts
Buy Signal: When price breaks below the HTF lower band and LTF bands start rising.
Sell Signal: When price breaks above the HTF upper band and LTF bands start falling.
⚙️ Settings & Customization:
🛠 LTF and HTF Bollinger Bands Settings:
Multiplier: The multiplier applied to the BB to determine the upper and lower bands
Length: Define the number of bars determines the BB calculations.
Custom Timeframe Selection: Choose from predefined options (e.g., 5m, 15m, 1H, 4H, etc).
🎨 Gradient & Transparency Settings:
Bullish/Bearish Color Options: Customize colors for uptrend and downtrend conditions.
Max & Min Opacity: Adjust the transparency levels based on volume intensity.
Solid vs. Gradient Mode: Choose between a gradient fill or a solid color mode for clarity.
📌 Recommended Settings for Optimal Use:
1️⃣ Timeframe Selection (LTF -> HTF):
1 min -> 5 min
2 min -> 5 min
3 min -> 15 min
5 min -> 15 min
15 min -> 1 hr
1 hr -> 4 hr
4 hr -> 1 day
2️⃣ Multiplier: Use 2.0 for LTF and 2.25 for HTF
3️⃣Length: Use a length of 20 - 30 bars
🚀 Why Use This Indicator?
✅ Multi-Timeframe Bollinger Bands with Kalman Filtering – Ideal for traders looking for reduced lag and clearer trend signals.
✅ Volume-Based Transparency – See momentum shifts instantly with adaptive opacity.
✅ Dynamic Buy & Sell Signals – Alerts based on price action + volume trends.
✅ Customizable for Any Strategy – Adjust colors, timeframes, and filtering options for personalized trading.

200 EMA Breakout & Retest Strategy200 EMA Breakout & Retest Strategy
This script is designed for traders who rely on the 200 EMA as a key indicator for trend direction and trade setups. The strategy identifies potential buy and sell opportunities based on breakouts and subsequent retests of the 200 EMA.
How It Works
EMA Breakout Detection:
The script monitors when the price crosses and closes above or below the 200 EMA.
No signal is generated immediately upon the breakout.
Retest Confirmation:
After the breakout, the price must retrace to touch the 200 EMA.
A valid signal occurs only when the price touches the EMA and the candle closes above (for buy) or below (for sell).
Trade Signal Generation:
Once the retest is confirmed:
A Buy Signal is generated if the price closes above the 200 EMA after the retest.
A Sell Signal is generated if the price closes below the 200 EMA after the retest.
The script calculates:
Stop Loss: Placed at the low of the candle for a buy signal and at the high of the candle for a sell signal.
Take Profit: Based on a customizable Risk-Reward Ratio (default is 1:2).
Visual Indicators:
The 200 EMA is plotted on the chart for reference.
Buy/Sell signals are displayed as labels on the chart.
Stop loss and take profit levels are drawn using dotted lines.
Customization Options
EMA Length: Adjustable (default is 200).
Risk-Reward Ratio: Customizable to suit different trading styles.
Who Is This For?
This strategy is ideal for traders who:
Prefer trading with the trend using EMA-based strategies.
Look for precise entry points with confirmation from retests.
Require automated calculation of risk-reward levels.

SSL Channel MTFSSL Channel with MTF support, This eliminates the noise of a basic SSL Channel script which is based on ErwinBeckers SSL Channel. So i have used a Multi Time Frame approach to have a clear confirmation of trend and reduce Noise and False signals unlike basic SSL Channel.
This script can be used to determine.
Support/Resistance
High/Low Breakout
Trend Direction
MA candles for Entry
The high and low sma are plotted as SSL CHANNEL when ever the high and low sma cross each other a direction change is observed.
The direction of SSL channel determines the trend of the price. The length of the channel can be changed as required a low value has a high noise and direction can be determined with low accuracy. Increasing the length of SSL channel has high accuracy trend confirmation.
The MTF SSL Channel uses plot from higher timeframe this helps in using SSL Channel as a Price Action Tool. Price when ever crosses over or below the channel determines a breakout. Price tries to move between the High SMA line and Low SMA Line of the SSL Channel rejection, breakouts can be easily observed on a lower timeframe using SSL Channel Plot from a higher timeframe.
I have used 5min/15min chart with MTF SSL from a 1Hr/4Hr and a length of 5 instead of 10. This helps quick direction changes over a period of 1hr to 4hr. Price is trapped within the High SMA and Low SMA lines of SSL Channel. In addition to SSL High Low and average mid line is plotted to additional reference.
Buy Sell Signals are plotted based on crossover of SMA High and Low.
Candle are Plotted Using a SMA with length of 5. This Candle Plot can be used to make an entry based on direction confirmation of SSL. keep in mind the direction of SSL Plot and the candle must be same. Preferably Entry can made above or below the midline of SSL Channel. The Candle Plot eliminates the Noise of traditional Japanese Candlesticks.
Additionally MACD Crossover and MACD Trend line confirmations can be used to confirm a Buy Sell and Entry signals
Alerts are also plotted accordingly.

Dynamic Opening Range BreakoutUnlock the Power of Breakout Trading!
Introducing the Dynamic Opening Range Breakout (DORB) indicator—your essential tool for identifying high-potential trading opportunities right from the opening bell! Designed for traders seeking to capitalize on market movements, DORB combines the classic Opening Range Breakout strategy with advanced features to enhance accuracy and profitability.
Key Features:
Dynamic Session Customization: Easily set your desired session time to adapt to various trading styles and asset classes. Whether you're trading stocks, forex, or cryptocurrencies, DORB fits your needs.
Volatility Adjustment: The indicator incorporates a volatility filter using the Average True Range (ATR). This ensures that breakouts are significant and reduces the likelihood of false signals, so you can trade with confidence.
Breakout Confirmation: DORB requires confirmation through multiple bars, helping to eliminate noise and increase the reliability of breakout signals. No more second-guessing—trade with clarity!
Visual Alerts and Signals: With background color changes and alerts for long and short breakouts, you'll never miss an opportunity. Stay informed in real-time and react swiftly to market movements.
User-Friendly Interface: The DORB indicator is designed to be intuitive and easy to use, making it suitable for both novice and experienced traders.
How It Works:
The DORB indicator establishes an opening range based on the first few minutes of trading, providing critical high and low levels. As the price moves, DORB detects potential breakouts above or below these levels, allowing you to enter trades with optimal timing. By incorporating volatility measures and breakout confirmations, DORB empowers you to make informed trading decisions.
Why Choose DORB?
Maximize Profit Potential: Capture significant price movements early in the trading day.
Reduce Risk: Filter out low-probability trades and focus on high-quality setups.
Stay Ahead of the Market: Use advanced tools to gain an edge over other traders.
Testimonials:
"DORB has transformed my trading! The volatility adjustments make all the difference, and I love the confirmation feature." - Satisfied Trader
"This indicator is a game-changer. It helps me identify breakouts with confidence, and the alerts keep me informed even when I'm away from my screen." - Happy Customer
Get Started Today!
Take your trading to the next level with the Dynamic Opening Range Breakout Indicator. Whether you're a day trader or a swing trader, DORB is your perfect companion for identifying breakout opportunities and maximizing your profits.
Don't miss out—add DORB to your trading toolkit now!

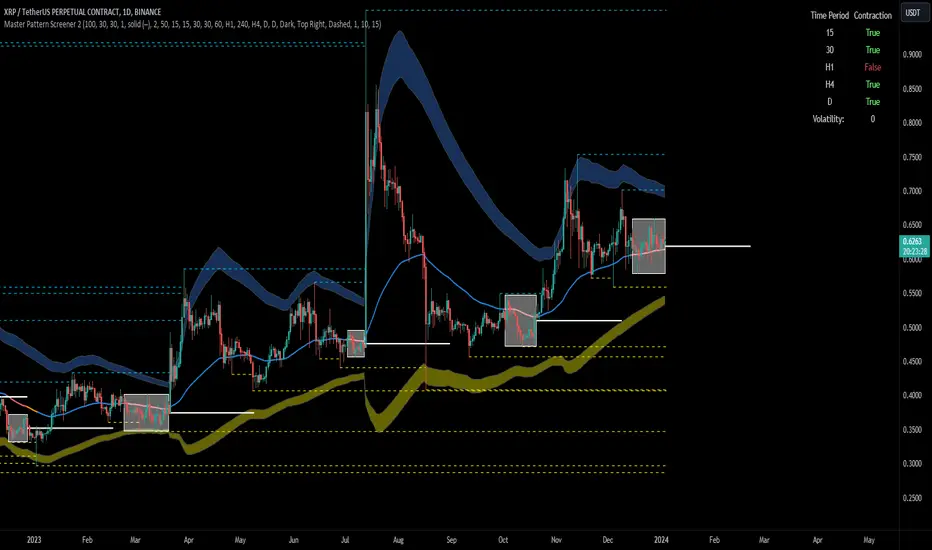
Forex Master Pattern Screener 2Overview
The Forex Master Pattern Screener 2 is based on the Master Pattern, which includes contraction, expansion, and trend phases. This indicator is designed to identify and visualize market volatility, market phases, multi-timeframe contractions, liquidity points, and pivot calculations. It provides a clear image of the market's expansion and contraction phases. It's based on an alternative form of technical analysis that reveals the psychological patterns of financial markets through three phases.
Unlike the other master pattern indicators that just use highs and lows and aren't as accurate for finding contractions, this one uses actual measures of volatility to find extremely low levels of volatility and has customizable parameters depending on what you want to do.
What is the Forex Master Pattern?
The Forex Master Pattern is a framework that revolves around understanding market cycles, comprising the three main phases: contraction, expansion, and trend.
Contraction Phase: During this phase, the market has low volatility and is consolidating within a narrow range. Institutional volume tends to be low, and it's suggested to avoid trade entries during this period.
Expansion Phase: Volatility starts to increase, and there start to be bigger moves in price. Institutional traders start accumulating positions in this phase, and they might manipulate prices to draw in retail traders, creating liquidity for their own buying or selling goals.
Trend Phase: This final phase completes the market cycle. Institutional traders begin taking profits, leading to a reversal. This triggers panic among retail traders, resulting in liquidations and stops. This generates liquidity for institutional traders to profit, leaving retail traders with overvalued positions.
Value Line:
The "value line" acts as the fair value zone or the neutral belief zone where buyers and sellers agree on fair value. It can be likened to the center of gravity and is created during contraction zones.
Applications:
Identifying these phases and understanding the value lines can help traders determine the market's general direction and make better trading decisions.
This isn't a strategy but a concept explaining market behavior, allowing traders to develop various strategies based on these principles
The contractions, which are based on volatility calculations, can help you find out when big moves will occur, known as expansions.
How traders can use this indicator
1. Identifying Market Phases:
Contraction Phase: Look for periods where the market has low volatility and is contracting, indicated by a narrow range and highlighted by the contraction box. During this phase, traders prepare for a breakout but usually avoid making new trades until a clearer trend emerges.
Expansion Phase: When the indicator signals an expansion, it suggests that the market is moving out of consolidation and may be beginning a new trend. Traders might look for entry points here, anticipating a continuation of the trend.
Trend Phase: As the market enters this phase, traders look for signs of sustained movement in one direction and consider positions that benefit from this trend.
2. Multi-Timeframe Analysis:
By looking at multiple timeframes, traders can get a broader view of the market. For instance, a contraction phase in a shorter timeframe within an expansion phase in a longer timeframe might suggest a pullback in an overall uptrend. This indicator comes with a MTF contraction screener that is customizable.
2. Fair Value Lines:
The fair value acts like a "center of gravity.". Traders could use this as a reference point for understanding market sentiment and potential reversal points. This indicator shows these values in the middle of the contraction boxes.
3. Volatility Analysis:
This indicator's volatility settings can help traders understand the market's current volatility state. High volatility indicates a more active market with larger, faster moves, while low volatility might suggest caution and tighter stop-losses or take-profits. If volatility is contracting, then an expansion is imminent. This indicator shows the volatility with percentile ranks in 0-100 values and also alerts you when volatility is contracting, aka the contraction phase.
Volatility Calculations:
This indicator uses a geometric standard deviation to measure volatility based on historical price data. This metric quantifies the variability of price changes over a specified lookback period and then computes a percentile rank within a defined sample period. This percentile calculation helps evaluate the current volatility compared to historical levels.
Based on the percentile rank, the indicator sets thresholds to determine whether the current volatility is within a range considered "contraction" or not. For example, if there are really low levels of volatility on the percentile rank, then there is currently a contraction phase. The indicator also compares the volatility value against a moving average, where values above the current moving average value signal the expansion phase.
Multi-Timeframe Analysis (MTF):
This indicator comes with a multi-timeframe table that shows contractions for 5 different timeframes, and the table is customizable.
Bands:
This indicator comes with bands that are constructed based on the statistical calculations of the standard deviation applied to the log-transformed closing prices. It is commonly assumed that the distribution of prices fits some type of right-skewed distribution. To remove most of the skewness, you can use a log transformation , which makes the distribution more symmetrical and easier to analyze, thus the use of these bands . These bands are in the 2 standard deviation range. You can use these bands to trade at extreme levels. The band parameter is based on the contraction volatility lookback, which is in the Volatility Model Settings tab.
Ways the bands could be used with the contractions:
1. Identifying Breakout trades:
Contraction Zones: These zones indicate periods of low volatility where the market is consolidating. There are usually narrow price ranges, which are considered a build-up phase before a significant price move in any direction.
Bands: When the contraction zone occurs, you might notice the bands tightening around the price on smaller lookback periods, reflecting the decreased volatility. A continuous widening of the bands could then signal the beginning of an expansion phase, indicating a potential breakout opportunity.
2. Enhancing Trade Timing:
Before the Breakout: During the contraction phase, the bands might move closer together, reflecting the lower volatility. You can monitor this phase closely and prepare for a potential expansion. The bands can provide additional confirmation; for instance, a price move toward one of the bands might show an extreme occurrence and might show what the direction of the breakout could be.
After the breakout: Once the price breaks out of the contraction zone and goes to the expansion phase, and if it coincides with the bands widening significantly, it could reinforce the strength and potential sustainability of the new trend, providing a clearer entry.
3. Price-touching bands during a contraction:
If the price repeatedly touches one of the bands during a contraction phase, it might suggest a buildup of pressure in that direction. For example, if the price is consistently touching the upper band even though the bands are narrow, it might suggest bullish pressure that could occur once the expansion phase begin.
4. Price at the band extreme levels during Expansion:
If the price is at the extreme levels of the bands once the expansion phase occurs, it might indicate unsustainable levels and a low probability of the price continuing beyond those levels. Potentially signaling that a reversal will occur. Some trades could use these extremes to place entries during the expansion phases.
Liquidity Levels:
This script comes with liquidity points, whose functionality goes towards identifying pivotal levels in price action, focusing on swing highs and swing lows in the market. These points represent areas where significant buying (for swing lows) or selling (for swing highs) activity has occurred, implying potential levels or resistance in the price movement.
These liquidity points, often identified as highs and lows, are points where market participants have shown interest in the past. These levels can act as psychological indications where traders might place orders, leading to increased trading activity when these levels are approached or breached. When used with the Forex Master Pattern phases, liquidity levels can enhance trades placed with this indicator. For instance, if the market is expanding and approaches a significant liquidity level, there might be a higher chance of a breakout or reversal, showing a possible entry or exit point.
Liquidity Levels in the Contraction Phase:
Accumulation and Distribution: During the contraction phase, liquidity levels can indicate where huge positions are likely accumulating or distributing quietly. If price is near a known liquidity level and in a contraction phase, it might suggest that a large market player is building a position in anticipation of the next move.
Breakout Points: Liquidity levels can also give clues about where price could go after the breakout from the contraction phase. A break above a liquidity level might indicate a strong move to come as the market overcomes significant selling pressure.
Liquidity Levels in Expansion Phase:
Direct Confirmation: As the expansion phase begins, breaking through liquidity levels can confirm the new trend's direction. If the price moves past these levels with huge volume, it might indicate that the market has enough momentum to continue the trend.
Target Areas: Liquidity levels can act as target areas during the expansion phase. Traders using this indicator could look to take profits if the price approaches these levels, possibly expecting a reaction from the market.
Targets For Overlay Indicators [LuxAlgo]The Targets For Overlay Indicators is a useful utility tool able to display targets during crossings made between the price and external indicators on the user chart. Users can display a series of two targets, one for crossover events and another one for crossunder event.
Alerts are included for the occurrence of a new target as well as for reached targets.
🔶 USAGE
In order for targets to be displayed users need to select an appropriate input source from the "Source" drop-down input setting. In the example above we apply the indicator to a volatility stop.
This can also easily be done by adding the "Targets For Overlay Indicators" script on the VStop indicator directly.
Targets can help users determine the price limit where the price might start deviating from an indication given by one or multiple indicators. In the context of trading, targets can help secure profits/reduce losses of a trade, as such this tool can be useful to evaluate/determine user take profits/stop losses.
Due to these essentially being horizontal levels, they can also serve as potential support/resistances, with breakouts potentially confirming new trends.
Users might be interested in obtaining new targets once one is reached, this can be done by enabling "New Target When Reached" in the target logic setting section, resulting in more frequent targets.
Lastly, users can restrict new target creation until current ones are reached. This can result in fewer and longer-term targets, with a higher reach rate.
🔹 Examples
The indicator can be applied to many overlay indicators that naturally produce crosses with the price, such as moving average, trailing stops, bands...etc.
Users can use trailing stops such as the SuperTrend or VStop to more easily create clean targets. Do note that certain SuperTrend scripts separate the upper and lower extremities of the SuperTrend into two different plot, which cannot be used with this tool, you may use the provided SuperTrend script below to have a compatible version with our tool:
//@version=5
indicator("SuperTrend", overlay = true)
factor = input.float(3, 'Factor', minval = 0)
atrLen = input.int(10, 'ATR Length', minval = 1)
= ta.supertrend(factor, atrLen)
plot(spt, 'SuperTrend', dir != dir ? na : dir < 0 ? #089981 : #f23645, 2)
plot(spt, 'Circles', dir > dir ? #f23645 : dir < dir ? #089981 : na, 3, plot.style_circles)
Using moving averages can produce more targets than other overlay indicators.
Users can apply the tool twice when using bands or any overlay indicator returning two outputs, using crossover targets for obtaining targets using the upper band as source and crossunder targets for targets using the lower band. We can also use the Trendlines with breaks indicator as example:
🔹 Dashboard
A dashboard is displayed on the top right of the chart, displaying the amount, reach rate of targets 1/2, and total amount.
This dashboard can be useful to evaluate the selected target distances relative to the selected conditions, with a higher reach rate suggesting the distance of the targets from the price allows them to be reached.
🔶 SETTINGS
Source: Indicator source used to create targets. Targets are created when the closing price crosses the specified source.
Show Target Labels: Display target labels on the chart.
Candle Coloring: Apply candle coloring based on the most recent active target.
🔹 Target
Crossover and Crossunder targets use the same settings below:
Show Target: Determines if the target is displayed or not.
Above Price Target: If selected, will create targets above the closing price.
Wait Until Reached: When enabled will not create a new target until an existing one is reached.
New Target When Reached: Will create a new target when an existing one is reached.
Evaluate Wicks: Will use high/low prices to determine if a target is reached. Unselecting this setting will use the closing price.
Target Distance From Price: Controls the distance of a target from the price. Can be determined in currencies/points, percentages, ATR multiples, or ticks.

Opening Range & Prior Day High/Low [Gorb]Introduction:
Opening Range & Prior Day High/Low indicator is an easy to use day traders tool. This indicator automatically plots the previous days high and low, as well as drawing a box from the opening range that the user specifies in the settings. These two together can help provide an indication of market sentiment and price trends for the day. They are often used as a trading strategy for day traders.
Overview:
The Opening Range , draws a box from the high to the low of the user defined time period and is extended until the end of the trading session. Most common are the 5/15/30min opening ranges.
Prior Day High/Low , draws lines from the previous days high and low that extend across the current session. These are used as support/resistance and also a marker to see market sentiment by crossing one of these levels.
The indicator is designed for all kinds of traders, offering a simple approach to automatically plot levels for you.
Features:
All skill-level friendly presets, easy to enable with one-click
Opening Range: Allows user to choose what time the range starts and ends to measure the high & low.
Extend Range Lines: allows the user to choose when the box stops extending according to the trading session time.
Enable Opening Range Box: allows the user to choose to plot the opening range or not.
ORB Border Color: allows the user to change the box border color.
ORB Box Shade Color: allows the user to change the background of the opening range box.
ORB Line Width: allows users to chose the width of the opening range box lines.
Enable Previous Day High: allows users to enable the previous days high to be plotted.
Enable Previous Day Low: allows users to enable the previous days high to be plotted.
Previous Day High Color: allows users to choose the color for this line.
Previous Day Low Color: allows users to choose the color for this line.
All colors are changeable for the user to customize to their liking.
Usage Demonstration
In the image below, we can see a basic example of how these 3 features function.
As explained above, the opening range is customizable to meet the users needs and can be disabled with one click. Same goes for the prior day high(green) and low(red) lines. All 3 are plotted each day automatically for the user if enabled.
In the image below, we can see an example of using the opening range break and prior day high together for a trading strategy.
This is a great example of using the prior day high with the opening range to use as a day trading strategy. It provides the trader with levels to watch for price to break out from for possible trade setups.
In this next image, we can see a failed breakdown from the opening range that results in a bullish breakout.
The first move was a fake breakdown with the failed rejection on the retest of the opening range lows. This led to a breakout above the range and a confirmation bounce on the breakout retest. Price did break above the prior day high and confirmed with a retest bounce on that level as well.
In the image below, we can see how previous days levels can act as resistance to use with the opening range.
Price didn't reject the opening range low, but it did reject the prior day high for the second time. This could be used as an entry or once price breaks down out of the opening range again.
Conclusion:
We believe in providing user-friendly tools to help speed up traders technical analysis and implement easy trading strategies. The goal is to provide a user-friendly indicator to automatically draw opening ranges and previous days levels to suit the users needs and trading style.
RISK DISCLAIMER
All content, tools, scripts & education provided by Monstanzer or Gorb Algo LLC are for informational & educational purposes only. Trading is risk and most lose their money, past performance does not guarantee future results.

EMA Screener with Day BreakoutsThe present script is aimed at screening number of stocks as per user input with respect to Daily Exponential Moving Average. Default is set at 200 DEMA, it can be changed by the user from settings menu as per user's preference.
The EMA cell illuminates to Green if Day's Open < EMA
The EMA cell illuminates to Purple if Day's Open > EMA
EMU cell shows the price as, EMA * EMA Price Multiplier (i.e. range below EMA, customizable from settings by user)
EMU cell illuminates to light Green when Price > EMU (i.e. the price is in range of EMA, For example suppose EMA value is 1000 and EMA Price Multiplier is 0.95 then the EMU cell value will be 950 as soon as the price crosses above 950 the EMU cell will get illuminated)
EMD cell shows the price as, EMA * EMA Price Multiplier (i.e. range above EMA, customizable from settings by user)
EMD cell illuminates to red when Price < EMD (i.e. the price is in range of EMA, For example suppose EMA value is 1000 and EMA Price Multiplier is 1.05 then the EMD cell value will be 1050 as soon as the price crosses below 1050 the EMD cell will get illuminated)
The DBO (Day Break Out) cell illuminates to Blue when the current price is near Day's high.
--Dr. Vats
Disclaimer: Only for studying price movement ideas, trading is not advised.

Bjorgum Key Levels
Key Levels Aims to capture 3 of the most significant points in price action
Breakouts
False Breakouts (Traps)
Back Checks
These 3 points alone, if properly identified, can be some of the most significant points of movement in the price history of an asset and bring significant gains to traders, if capitalized on. Here are a few examples of these setups
Breakouts
Breakouts can bring significant rallies as the market swings one sided after key levels are breached. This entry type can bring large trending runs to follow. Momentum is on your side, but the trade off is a higher entry.
False Breakouts
Also known as a bull trap or a bear trap, false breaks can lead to swift and significant reversals and potential for a large and sudden move to the opposite side. When a key level breakout fails to hold, parties entering to capitalize on the "epic breakout" can get left holding the bag forcing them to exit at a loss, which can double the force of pressure. Traps can bring swift gains from good entry prices. However, price is still in a larger trend against you so momentum is weak, so price action is susceptible to roll over.
Backchecks
Back checks are pull backs in trend that find middle ground to the 2 areas already described. Both momentum and entry price are decent, but risk is defined as a key level has flipped offering entry with stops below demand, or above supply.
Combining these 3 methods helps to diversify risk, understand trend development, and bring steady gains. This script helps to identify these points to traders with analysis of key levels, price structure, and trend direction, while providing visual signals and alerts for when they occur.
Best of luck in your coding and trading and thank you for your support

Volume Positive Negative (VPN) [LevelUp]The idea and calculations for the Volume Positive Negative (VPN) indicator were created by Markos Katsanos. Markos wrote about the indicator in the article Detecting High-Volume Breakouts, published in Technical Analysis of Stocks & Commodities April, 2021 (Vol. 39, Issue 5).
The goal of the VPN indicator is to detect breakouts using only volume. The basic idea is to compare volume on up days versus volume on down days. The indicator can oscillate between the range of -100 and 100. Values between 0 and 20 are generally considered bullish, negative are bearish.
When the plotted VPN crosses over what Markos refers to as the critical value, that may indicate a high volume breakout. The critical value can be adjusted between 0 to 20, 10 is the default,
Volume Positive Negative Calculation (VPN)
VPN = (VP - VN) / MAV / Period * 100
VP - sum of positive volume
VN - sum of negative volume
MAV - moving average of volume
Volume is considered positive when the average price is higher than the previous day's price by more than .1 of the ATR (average true range).

Swing Index System - Heiken Ashi Pivot Breakout StrategyFor Educational Purposes. Results can differ on different markets and can fail at any time. Profit is not guaranteed.
This only works in a few markets and in certain situations. Changing the settings can give better or worse results for other markets. This is a breakout strategy that uses the heiken ashi bars to find the support and resistance levels or the swing pivots to try to objectively find a breakout. When the price breaks out of a swing pivot, breakout can be confirmed and a strategy can be made. The trade exits as soon as in profit when the heiken ashi bar changes color, when the price swings start to slow down, or when the price breaks below a swing pivot. There might be many strategies and possible ideas that can be made just from knowing where the swing pivots are alone. For this one, I decided to try to emulate Wilder's Adam Theory approach by entering only a specific criteria when it makes new highs or lows that I experimented with. The Swing Index System seems to be similar to what he describes in his book (or perhaps it is the same thing).
Some say that price is the ultimate indicator, but not many really know what that really means. This is yet another approach to try to interpret what that means. This strategy only contains a piece of the complete breakout and trend strategy approach of the Adam Theory and won't be profitable in every market under every situation. This does not include price patterns that the Swing Index System is said to be able to find such as chart patterns, wedges, tops/bottoms, etc. This only includes the small breakout portion requirement in the book. I included specific entry and exit criteria to make the strategy work well that involves nothing but the price action of the swing points only due to the lack of the other missing pieces. It does not contain the missing pieces. Despite this, it can still help find where breakouts might be in an objective matter using the Swing Index System as a standalone trading system and it doesn't involve lookbacks or anything but price alone.

Trapped Traders - SR Levels/Zones (Expo) Trapped Traders - SR Levels/Zones (Expo) automatically identifies and displays support and resistance levels based on where Bulls & Bears can be trapped.
Levels are displayed where there is a high probability that market participants will be trapped and forced to exit their positions if the price breakouts from the SR level.
If the price doesn't breakouts from the SR level there's a chance that the market has topped or bottomed out.
The indicator can be used standalone or as a part of your current trading strategy.
Real-time
No repainting
Works on any market
HOW TO USE
1. Use the indicator to identify where Bulls and Bears can be trapped.
2. Use the indicator to identify potential breakouts in the trend direction.
3. Use the indicator to identify potential reversal points.
INDICATOR IN ACTION
Daily Chart
I hope you find this indicator useful , and please comment or contact me if you like the script or have any questions/suggestions for future improvements. Thanks!
I will continually work on this indicator, so please share your experience and feedback as it will enable me to make even better improvements. Thanks to everyone that has already contacted me regarding my scripts. Your feedback is valuable for future developments!
ACCESS THE INDICATOR
• Contact me on TradingView or use the links below
-----------------
Disclaimer
Copyright by Zeiierman.
The information contained in my scripts/indicators/ideas does not constitute financial advice or a solicitation to buy or sell any securities of any type. I will not accept liability for any loss or damage, including without limitation any loss of profit, which may arise directly or indirectly from the use of or reliance on such information.
All investments involve risk, and the past performance of a security, industry, sector, market, financial product, trading strategy, or individual’s trading does not guarantee future results or returns. Investors are fully responsible for any investment decisions they make. Such decisions should be based solely on an evaluation of their financial circumstances, investment objectives, risk tolerance, and liquidity needs.
My scripts/indicators/ideas are only for educational purposes!

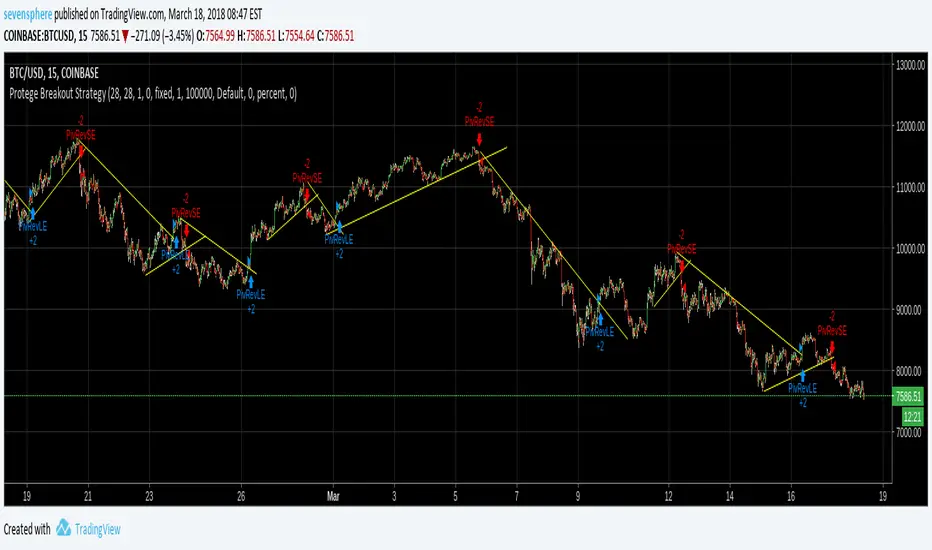
Protege Breakout StrategyThis script only detect and place a trade on each breakout.
My goal is to fusion this indicator with others great strategy to get only the best breakouts.
Hybrid Trend-Following Inside Bar BreakoutHybrid Trend-Following Inside Bar Breakout Strategy
The Hybrid Trend-Following Inside Bar Breakout Strategy is a rule-based trading system designed to capture strong directional moves while controlling risk during uncertain market conditions. It combines trend-following, price action, and volatility-based risk management into a single robust framework.
Core Concept
The strategy trades inside bar breakouts only in the direction of the dominant market trend. Inside bars represent periods of consolidation, and when price breaks out of this consolidation in a trending market, it often leads to impulsive moves with favorable risk–reward characteristics.
Key Components
1. Trend Filter
Uses 50 EMA and 200 EMA to define the market trend.
Bullish bias: 50 EMA above 200 EMA
Bearish bias: 50 EMA below 200 EMA
This filter prevents counter-trend trades and improves trade quality.
2. Volatility Filter
Compares fast ATR (14) with slow ATR (50).
Trades are taken only when volatility is expanding or above a minimum threshold.
This avoids low-volatility, choppy market conditions.
3. Inside Bar Breakout
An inside bar forms when the current candle’s high is lower than the previous candle’s high and the low is higher than the previous candle’s low.
A trade is triggered only when price breaks above or below the inside bar range in the direction of the trend.
4. Candle Quality Filter
Requires a minimum body-to-range ratio, ensuring that the breakout candle has strong momentum and is not driven by weak wicks.
Risk Management & Trade Management
Stop Loss (SL)
Placed using ATR-based dynamic stops, adapting to current market volatility.
Prevents tight stops in volatile conditions and wide stops in calm markets.
Partial Profit Taking
50% of the position is exited at 1.5R, locking in profits early.
This reduces psychological pressure and improves equity stability.
Trailing Stop
After partial profit is taken, the remaining position is managed with an ATR-based trailing stop.
Allows the strategy to capture large trend moves while protecting gains.
Cooldown Mechanism
After a losing trade, the system enters a cooldown period and skips a fixed number of bars.
This helps avoid revenge trading and overtrading during unfavorable market phases.
Why This Strategy Works
Trades only high-probability breakouts in trending markets
Adapts automatically to changing volatility
Combines price action precision with systematic risk control
Designed for consistent performance over long historical periods

Trinity Bollinger Bands Pro with BreakoutsTrinity Bollinger Bands Pro Indicator
The **Trinity Bollinger Bands Pro + Triple Bands & Expansion** is a highly customized, advanced volatility and breakout indicator built on the classic Bollinger Bands framework. It expands the standard single-pair bands into **three independent deviation levels** (typically 1σ, 2σ, and 3σ) around a user-selectable moving average basis (default EMA 20). This creates clear "zones" of volatility, with dynamic trend-based coloring, layered fills, fixed-style labels, and a statistical volatility expansion detector shown as a directional background highlight in a separate pane. The result is a visually intuitive tool that helps traders identify consolidation, building momentum, confirmed trends, and rare explosive moves with high-probability filtering.
### Why It's Good and Different from Standard Indicators
This indicator stands out by addressing common limitations of traditional Bollinger Bands and multi-deviation scripts:
- **Layered statistical significance**: Unlike single (2σ) or basic double-band setups, it provides three distinct levels—early momentum (1σ), standard confirmation (2σ), and extreme/rare breakouts (3σ)—making it easier to stage trades progressively rather than relying on one ambiguous cross.
- **Trend-aware visuals**: Bands, basis, and fills change color based on price position relative to a separate trend MA, giving immediate bullish/bearish bias without needing additional indicators.
- **Clean, fixed labels**: Tiny, arrow-pointing labels ("1/2/3 SD Above/Below", "BB Basis") with consistent colors (purple upper, blue lower, yellow basis) provide instant identification
- **Statistical expansion detection**: Uses percentile ranking of band width "bell curve" concept" to identify abnormally high volatility, triggering directional background highlights (green bullish, red bearish) earlier than raw width spikes.
- **Reduced noise and fakeouts**: Tiered breakouts + expansion filter focus alerts on high-probability moves, unlike most BB scripts that flood signals on every touch.
Compared to popular public scripts (e.g., standard Bollinger Bands, Triple BB variants, or separate BBW Percentile tools), this combines everything into one cohesive indicator with superior visual clarity and statistical rigor.
### Key Features
- **Triple customizable bands**: Enable/disable and adjust multipliers for 1σ (early), 2σ (confirmed), 3σ (extreme) deviations.
- **Trend-based dynamic coloring**: Separate editable colors for each band set (bullish/bearish).
- **Layered zone fills**: Colored between bands with transparency, reflecting current trend.
- **Fixed tiny labels**: All left-pointing arrows with purple (upper), blue (lower), yellow (basis) backgrounds for quick reference.
- **Statistical expansion overlay**: with directional background (green/red) during extreme volatility expansions (earlier trigger using 2σ width).
- **Tiered alerts**: Early (Band 1), Confirmed (Band 2), Extreme (Band 3), High-Probability (Extreme + expansion), and general expansion alerts.
- **Fully configurable basis**: Length, type (SMA/EMA/WMA/RMA), and thin fixed lines for minimal clutter.
### How Traders Can Use It
- **Spot squeezes and breakouts**: Watch for tight bands (low width) → expansion background → price closing outside Band 1 (early entry), Band 2 (add/confirm), Band 3 (strong trend conviction).
- **Filter fakeouts**: Only act on crosses accompanied by expansion background color matching trend direction—dramatically reduces whipsaws.
- **Trend riding**: Price "walking" colored bands (e.g., hugging upper purple-label bands in green background = strong bullish momentum).
- **Scalping/intraday**: On lower timeframes (e.g., 10min), use early Band 1 signals with expansion for quick moves.
- **Swing/position trading**: Wait for Band 3 extreme breakout + colored background for higher-probability, larger moves.
- **Risk management**: Place stops near basis or inner band; trail using outer bands during expansions.
Overall, this indicator excels at turning volatility into actionable, staged signals with visual simplicity—ideal for traders seeking an edge in identifying real explosive trends over noise. It's particularly powerful on volatile stocks like AMD/INTC or indices during news/events.

Advanced Volume Suite (24h, Pulse, Spikes, Breakout Pressure)Advanced Volume Suite transforms raw volume into a complete market-intelligence toolkit for breakout, momentum, and liquidity-driven trading.
Unlike the basic volume indicator, this tool analyzes volume in true USDT value, tracks rolling 24h exchange-style volume, measures volume strength vs historical averages, detects smart spikes, and highlights breakout pressure near support/resistance.
Core Features:
• USDT-based volume histogram
• 24h rolling volume line
• Volume Pulse (volume vs moving average)
• Smart spike detection with directional filters
• Breakout pressure system (breakouts + near-breakout conditions)
• 3 advanced volume color modes (Simple / Body / Delta-style)
• All signals and thresholds fully configurable
Perfect for traders who rely on volume confirmation for breakouts, momentum entries, scalping, or detecting institutional activity.
