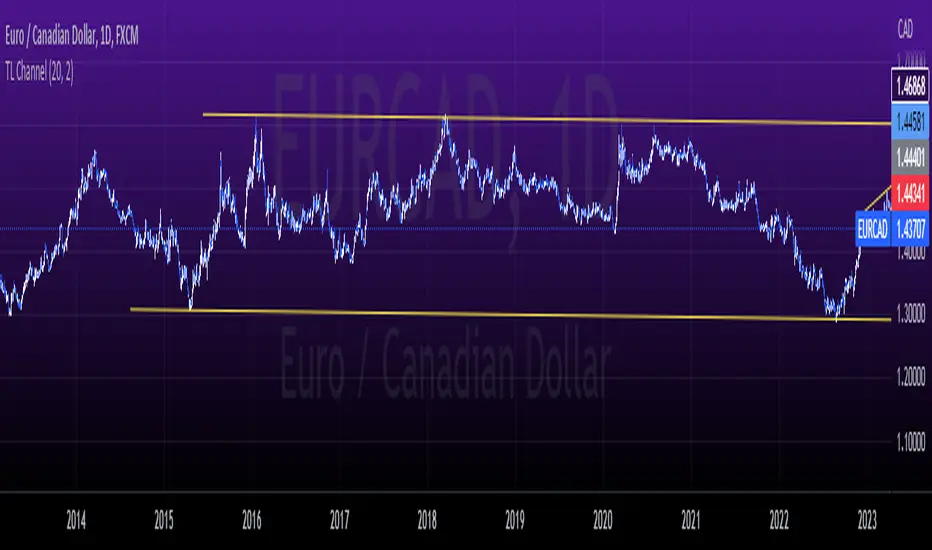
tlc with False BreakoutThe strategy aims to identify a trend line channel with the potential for a false breakout. Here's an explanation of the strategy:
The script starts by defining the input parameters. The lookback parameter determines the number of previous bars to consider for detecting the trend lines, and the threshold parameter controls the sensitivity of the trend line detection.
The script then initializes variables to store the trend lines, tap count, and the false breakout signal.
Inside the loop, the script iterates over the specified number of bars (lookback) to identify the trend lines. It checks if the current high is greater than the previous and next highs to identify an upper trend line and sets it using the line.new function. Similarly, it checks if the current low is smaller than the previous and next lows to identify a lower trend line and sets it.
The script also keeps track of the price levels of the upper and lower trend lines using the variables upperTrendLinePrice and lowerTrendLinePrice. These price levels are obtained using the line.get_y1 function.
After the fourth tap (when tapCount is equal to 4), the script checks if the current close price is above the upper trend line or below the lower trend line. If this condition is met, it sets the falseBreakout variable to true, indicating a potential false breakout.
Finally, the script plots a shape marker (plotshape) when a false breakout occurs. This is represented by an orange label displayed below the bar.
At the end of the script, the line.delete function is used to remove the old trend lines when the script reaches the last bar (barstate.islast).
By using this strategy, you can visually identify trend line channels where the upper and lower lines touch higher highs or lower highs and higher lows or lower lows. Additionally, it provides a false breakout signal when the price breaks above the upper trend line or below the lower trend line on the fifth tap.
ابحث في النصوص البرمجية عن "breakout"
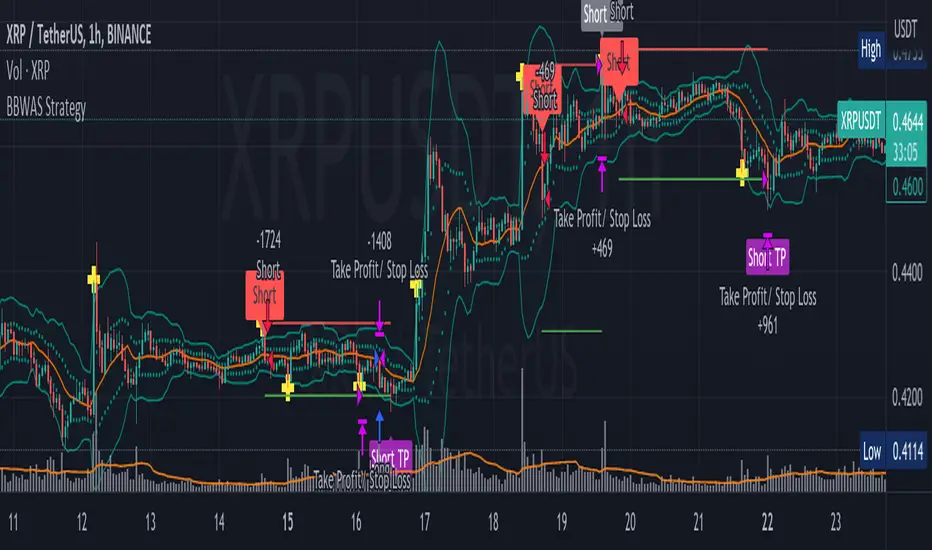
BBWAS StrategyA breakout in trading refers to a situation where the price of a security or asset moves beyond a defined level of support or resistance, which is typically indicated by technical analysis tools like Bollinger Bands . Bollinger Bands consist of three lines: the upper band, the lower band, and the middle band (or basis). The upper and lower bands are set at a specified number of standard deviations away from the middle band, and they help to define the range within which the price of an asset is expected to fluctuate.
When the price of the asset moves beyond the upper or lower band, it is said to have "broken out" of the range. If the price closes below the lower band, it is considered a bearish breakout, and if it closes above the upper band, it is considered a bullish breakout.
Once a breakout occurs, traders may look for a confirmation signal before entering a trade. In this case, crossing the middle line (or basis) after a breakout may signal a potential trend reversal and a good opportunity to enter a long or short trade, depending on the direction of the breakout.
Overall, this script provides a customizable and flexible system for traders to use Bollinger Bands to identify breakout trades, with additional features to incorporate volume and RSI divergence. The dynamic TPSL system also allows traders to manage their risk and reward by automatically setting take-profit and stop-loss levels based on the volatility of the market.
Dear traders, while we strive to provide you with the best trading tools and resources, we want to remind you to exercise caution and diligence in your investing decisions.
It is important to always do your own research and analysis before making any trades. Remember, the responsibility for your investments ultimately lies with you.
Happy trading!
Open DriveOpen Drive is a market profile concept introduced by Jim Dalton. It occurs when the price moves directionally and persistently for the first 30 minutes from the cash market open.
It is necessary to use 30-minute bars as there needs to be enough time to measure an extreme move of the cash open. This means there will be fewer trades than other strategies using faster time periodicities.
The script finds open drives from these time points 0700/ 0800 and 1300/1430.
The entry signal also has a breakout threshold using the 5-bar high and 5-bar low to only take trades moving away from the prior 5-bar range. This weeds out most mid-range trades and small range expansion bars.
If the price has had a strong move from the open and has broken either below the prior 5-bar low or above the prior 5-bar high by an amount equal to the prior 5-bar range a trade is entered in the direction of the move.
The Exit criteria; exit after 3 bars which is 90mins when using a 30min periodicity.
Note, this script is shared to show that momentum generated on or around the cash open tends to persist. The entry and exits of this strategy are quite naive but there are plenty of ways to take more aggressive entries on faster time frames when an open drive occurs. The times chosen for this strategy will suit stock index futures mainly. The user can experiment with other futures products and their corresponding pit/ cash open hours.
Google "open drive market profile" for more information on open drives and market profile concepts.
Happy trading!

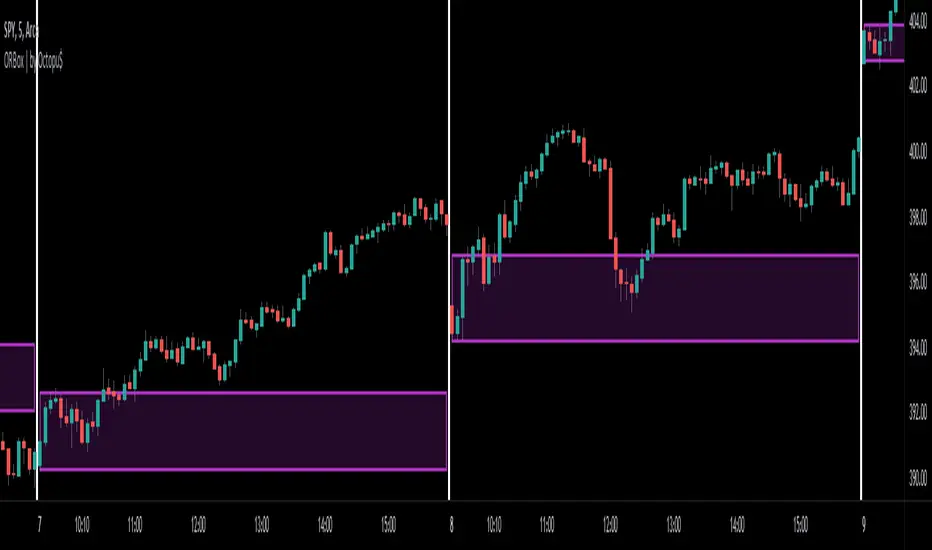
ORBox | by Octopu$📈 ORBox | by Octopu$
ORBox is a Box for the Opening Range Breakout
The Box is added automatically according to the User preferences through GUI
This Indicator includes a Dropdown selection for which Range for the Breakout you want to use
ORBox has built-in Alerts for when the Breakout happens according to your preferences
Works in any Timeframe with any Ticker
(Using SPY 5m just as an example:)
www.tradingview.com
SPY
Features:
• Opening Breakout Range (ORB)
• Dropdown menu selection to choose which TF to watch
• Built-in Alerts for Momentum Awareness
Options:
• Customization for Box Colors and Sizes
• Display ORB for Current Day or Previous
Notes:
v1.0
ORBox Indicator release
Changes and updates can come in the future for additional functionalities or per requests.
Did you like it? Shoot me a message! I'd appreciate if you dropped by to say thanks.
- Octopu$
🐙
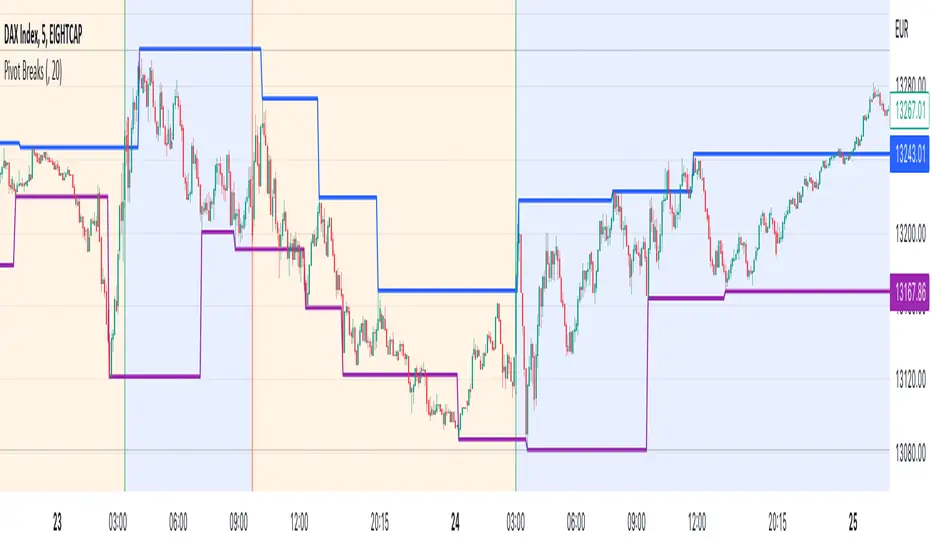
Pivot BreaksThere are built-in and published Pivot Point High Low indicators in Public Library. As far as I see none of them show the breaking candles or the trend.
with the closing price crossing over the previous / current pivot high A bearish breakOut can either indicate the progression of a lower high pattern or a trend reversal
with the closing price crossing under the previous / current pivot low A bullish breakOut can either indicate the progression of a higher low pattern or a trend reversal
This indicator can show the first breaking candle or all breaking candles . It Can also show The Breaking state (Trend) based on the last break.
Alert Mode is included, colour can be customised, Higher TimeFrame can be requested (it Can also cause repainting)
Inputs are optional as possible so have fun with it
Disclaimer: Scripts that I post publicly are experimental. They are not financial advices. Always backtest your ideas using your own methodologies.
Trend lines + Pivot Levels + Candlestick PatternsThis is a pure PRICE ACTION indicator that will show you possible trend lines, pivot lines and candlestick patterns at once.
it has been designed to determine upper and lower trend lines in the chart and you can set candlestick patterns on them with alerts!
it means that you add the indicator to the chart and set the alert and done!
whenever a pinbar or engulf or breakout(in both directions) happens, you will be notified by alerts.
you also have pivot lines on the chart by this indicator. you can set the candlesticks on pivots instead of trend lines, so if you are a fan of support and resistance you can have this one, it depends on you.
all of the pivots and trend lines and also the candle sticks are customizable, so you can exactly select the pinbar, engulfing or breakout candle that matches with your mindset. for example you can set a pinbar that long shadow is 4 times or 3 times greater than the body, it's on you.
you can also customize trendlines or pivot lines, if you are scalper you can set it to small trend lines and if you are day trader or long term trader you can set it to the number that fits with your strategy.
trends and pivots will be updated automatically and there is no need to set it every time.
Be PROFITABLE!
$kMagician /*

Linear Regression & RSI Multi-Function Screener with Table-LabelHi fellow traders..
Happy to share a Linear Regression & RSI Multi-Function Custom Screener with Table-Labels...
The Screener scans for Linear Regression 2-SD Breakouts and RSI OB/OS levels for the coded tickers and gives Summary alerts
Uses Tables (dynamica resizing) for the scanner output instead of standard labels!
This Screener cum indicator collection has two distinct objectives..
1. Attempt re-entry into trending trades.
2. Attempt Counter trend trades using linear regression , RSI and Zigzag.
Briefly about the Screener functions..
a. It uses TABLES as Labels a FIRST for any Screener on TV.
b. Tables dynamically resize based on criteria..
c. Alerts for breakouts of the UPPER and the LOWER regression channels.(2 SD)
d. In addition to LinReg it also Screens RSI for OB/OS levels so a multifunction Screener.
e. Of course has the standard summary Alerts and programmable format for Custom functions.
f. Uses only the inbuilt Auto Fib and Lin Reg code for the screener.(No proprietary stuff)
g. The auto Zigzag code is derived(Auto fib).
Question what are all these doing in a single screener ??
ZigZag is very useful in determining Trend Up or Down from one Pivot to another.
So Once you have a firm view of the Current Trend for your chosen timeframe and ticker…
We can consider few possible trading scenarios..
a. Re-entry in an Up Trend - Combination of OS Rsi And a Lower Channel breach followed by a re-entry back into the regression channel CAN be used as an effective re-entry.
b. Similarily one can join a Down Trend on OB Rsi and Upper Channel line breach followed by re-entry into the regression channel.
If ZigZag signals a range-bound market, bound within channel lines then the Upper breakout can be used to Sell and vice-versa!
In short many possibilities for using these functions together with Scanner and Alerts.
This facilitates timely PROFITABLE Trending and Counter trend opportunities across multiple tickers.
You must give a thorough READ to the various available tutorials on ZigZag / Regression and Fib retracements before attempting counter trend trades using these tools!!
A small TIP – Markets are sideways or consolidating 70% of the time!!
Acknowledgements: - Thanks a lot DGTRD for the Auto ZigZag code and also for the eagerness to help wherever possible..Respect!!
Disclaimer: The Alerts and Screener are just few tools among many and not any kind of Buy/Sell recommendations. Unless you have sufficient trading experience please consult a Financial advisor before investing real money.
*The alerts are set for crossovers however for viewing tickers trading above or below the channel use code in line 343 and 344 after setting up the Alerts!
** RSI alerts are disabled by default to avoid clutter, but if needed one can activate code lines 441,442,444 and 445
Wish you all, Happy Profitable Trading!

The Trend Oracle - The Ultimate Position ToolThe Trend Oracle is a superadaptive multi-timeframe Indicator
Ideal timeframes are 4H, and 1D
It is based on a combination of several other indicators including:
- The Superstrength Index - An adaptive indicator using volume weighted average of the traditional RSI, MFI and OBV
- The Superfast MACD - An adaptive zero lag MACD
- ADX Trend - A tweaked version of the ADX
- Chop Zones - A combination of 2 Chop indexes to identify trending and non trending conditions.
- The Adaptive Supertrend - An adaptive version of the Supertrend, (switching multipliers based on the market trend)
- Breakout & Breakdown - An algorithm computing volume compression and expansion to indicate breakout & breakdown signals.
- [bBullish and Bearish Divergences - Confirmed Bull and Bear divs shown as green and red dots at the top and bottom of the indicator.
Areas highlighted in Aqua are bullish, red are bearish.
Use this indicator as a tool to position yourself over longer timeframes.
Enjoy!
MM :)

HuD IntradayConsist of :
- standard Bollinger Band (BB) - MA20 and 2 dev
- EMA ( default 9,20,50 and 200)
- WMA ( 5 and 10 )
- Donchian Channel
Suitable for intraday trading - 15min, 30 min or 1 hour timeframe
Trading Strategy :
1. Enter trade only when
- band is Green
- line EMA20 above EMA50 and line EMA50 above EMA200 ( black > purple > red )
- RSI (default setting 14) is above level 50 and trend is positive (RSI line moving upward)
2. Possible Entry point ( 3 options )
i Breakout candle and candle still below lower BB
ii Retracement/Pullback - after Breakout and candle still inside green band. RSI still above 50
iii. Buy on Weakness (BOW) - Blue diamond icon
3. Stop Loss :
- Select "Show Stop Loss" - to display stop loss line
- Based on ATR
- adjustable depend on trader risk
Other option for stop loss :
- WMA Area ( Dark green ) - candle cross under WMA, can consider to exit trade
- EMA20 - candle cross under EMA20, can consider to exit trade.
4. Alert
Therea are 3 alerts availabe
i. Breakout signal
ii. Sell signal - candle break trailing Stop
iii. BOW - Buy on weakness signal
Note :
- This indicator only suitable for Bursa Malaysia
- Do PM me if you interested

SMT - Smart Money Thursday Boxes
The Smart Money Trading Thursday - is a very specific trading system. You only trade it on a Thursday.
The script/indicator will color Thursdays as two boxes. If you just want one color, use same color for
both boxes. The boxes is there to indicate London/New York sessions.
SETTINGS
In the setting you find a numeric value as 1700-0400:5
The "5" indicate Thursday. You can change that if you prefer to color another specific day.
For example "4" would indicate Wednesday. And you can change the hours to fit your
sessions and trading style.
You can also use the 2 boxes on different days. If you for example would like to color up
London for Wednesday and Thursday. Then set hours to fit London session and adjust the
:5 to 4 on the 1st box and 5 on the 2nd.
HOW TO USE IT?
The Smart Money works in a way retail trading does not. Smart Money has an objective
to locate retail patterns, where there will be a lot of stop loss volume to be grabbed.
So when a retail trader see a setup like a "Double Top / Bottom". The Institutional
will see $$$ of dumb money, ready to be taken. The best moves happen on a Thursday
but if you are a skilled trader, you can see the move also occur on Wednesday or Friday.
The first thing that will happen, is that the Smart Money Breaks out of session. Meaning
they will leave the current weeks high/low range. To start collect negative contracts
of the retail volume.
When you see that happen. And you see a breakout that consist of 4 in a row 1 hour
chart candles. Then you have your first rule meet.
#1 Thursday breakout of current weeks high/low. And the move is a clean 4 hour move
as 4x H1 candles. The move can start within range. But must end clearly outside.
Visual Example:
#2 Next, we await an engulf at peak or near peak. That is where Institutional
may have problem to match any more contracts, and since they used their own
money to make this move. They must now mitigate orders, and return back to
the original retail pattern as most retail traders are now stopped out.
(Normally this is a long/clear candle out of range. they rarely go lower
then retail traders entry in the 1st push. This to not save any souls :)
#3 Price returns back to where the breakout from the retail happens.
You can now take your profit as a Smart Money Trader. Trading with less risk,
you can take profit of the return of that latest 4x H1 candle move. (Order
Block)
CONCLUSION
The best trade is when you can combine a retail pattern, followed by a
breakout which holds 4x 1 hour candles in the outbreak direction.
2nd best is when you have the 4x H1 breakout and really no clear retail
pattern. Still is the same game. Just not as clear as the one above.
Study the steps in this image and you see what to look after:
Good Luck with your trading!
Regards,
The Hunter Trading Group

TradeChartist Range Bands ™TradeChartist Range Bands is an exceptionally well designed Entry/Exit indicator that plots fluid Range Bands and dynamic Support/Resistance levels on chart, along with trade entries by using both trend following and mean reversion principles.
===================================================================================================================
How does ™TradeChartist Range Bands work?
The Indicator plots Range Bands with Upper, Lower and Mean, calculated using trading models that use both Trend Following and Mean Reversion principles . It is the Range Bands that decide the trade Entries as the breakouts above upper band generates long entries and the breakouts below the lower band generates the short entries.
The Range Bands Type (Automatic, Aggressive or Normal) can be chosen from the settings. Default is Automatic and it uses Aggressive for non 24 hr markets and Normal for 24 hr markets like Cryptocurrencies.
The width of the Range Bands can be changed using the Range Multiplier from the settings. Default is 1.618 , minimum value is 0.618 and maximum value is 2.0.
The frequency of the Trade Signals depends on both Range Bands type and Range Multiplier. So it is worth spending some time to test the indicator based on these 2 factors on the asset traded, to maximise the profit potential by optimising the type and multiplier value.
In addition to the Range Bands, the indicator also plots Dynamic Support and Resistance bands that are more sensitive to price action and helps the user determine growing support/resistance which is indicated by coloured dots. These dots normally appear when the Support or Resistance stays at the same level for a few bars.
The expansion and contraction of the Support and Resistance bands also help in visualising the price volatility, and an extremely narrow squeeze of these levels within the Range Bands normally signals a lucrative market move. This is usually followed by a breakout from the bands and will be signalled by the Trade Entry plots (BUY and SELL).
The Dynamic Support and Resistance levels can be enabled or disabled from the settings. The fill between these dynamic levels helps the user to visualise the Bull and Bear strength/power. This fill can also be disabled from the settings if not required.
The indicator has a nice Fibonacci levels generator companion that helps spot near support and resistance levels using Fibonacci Retracement tool.
There are 3 types of Fib plots that can be chosen from the settings - Auto-Fibs, Fibs based on Lookback, Fibs based on Price Input .
The Auto-Fibs feature is used as default and it automatically plots fib retracement based on nearby significant high/low (highest from previous up and down trends). This is normally based on nearby trade entries too. Occasionally, during choppy markets/sideways movement, the range of these levels can be quite small and if close price exceeds the 4.618 fib level, one of the other Fib plot options can be used. Alternatively, Plot fibs from current high/low can also be used.
Fibs based on lookback can be used by choosing the number of candles or days lookback to help the indicator automatically find the high and low of the period to generate fib levels. Similarly, Fibs based on price input requires, user to manually enter the high and low price points for the indicator to generate fib levels based on user input.
The indicator has two colour schemes for the Dynamic Support/Resistance fill and bar colours. The coloured bars and the fill will help visualise the price trend. This can be changed or disabled from the settings.
The Fib levels can be disabled by unchecking lines and labels from the styles tab of indicator settings.
Long and Short entry Alerts can be created by using Once Per Bar Close .
The indicator does not repaint. Alerts may display potential repaint warning, but this is because the code uses bar index for fib labels. For confidence in the indicator, it can be tested using bar replay to make sure the real-time and bar replay trade entries and plots stay on the same bar/timestamp.
The different elements of the indicator are shown below in the chart.
===================================================================================================================
™TradeChartist Range Bands can also be connected to ™TradeChartist Plug and Trade to generate Targets, Stop Loss Plot etc. and other alerts can also be created. Use Range Bands Trend Identifier to connect as an Oscillatory Signal to Plug and Trade. Example chart shown below.
===================================================================================================================
Example charts:
1. ADA-USDT 4hr chart using Aggressive type and 1.618 Range Multiplier
2. ADA-USDT 4hr chart using Normal type and 1.618 Range Multiplier
3. XAU-USD 15m chart using Normal type and 1.618 Range Multiplier - Fibs based on 3 days lookback
4. DJI 4hr chart using Normal type and 2.0 Range Multiplier
5. GBP-USD 15m chart using Normal type and 1.618 Range Multiplier
6. LINK-USDT 1hr chart using Normal type and 1.236 Range Multiplier
===================================================================================================================
Best Practice: Test with different settings first using Paper Trades before trading with real money
===================================================================================================================
This is not a free to use indicator. Get in touch with me (PM me directly if you would like trial access to test the indicator)
Premium Scripts - Trial access and Information
Trial access offered on all Premium scripts.
PM me directly to request trial access to the scripts or for more information.
===================================================================================================================

Big Breakout IndexBig Breakout Index is a great indicator for detecting breakouts. When the current close breaks out of consolidation, the indicator will tell you.
Green - Buy
Red - Sell

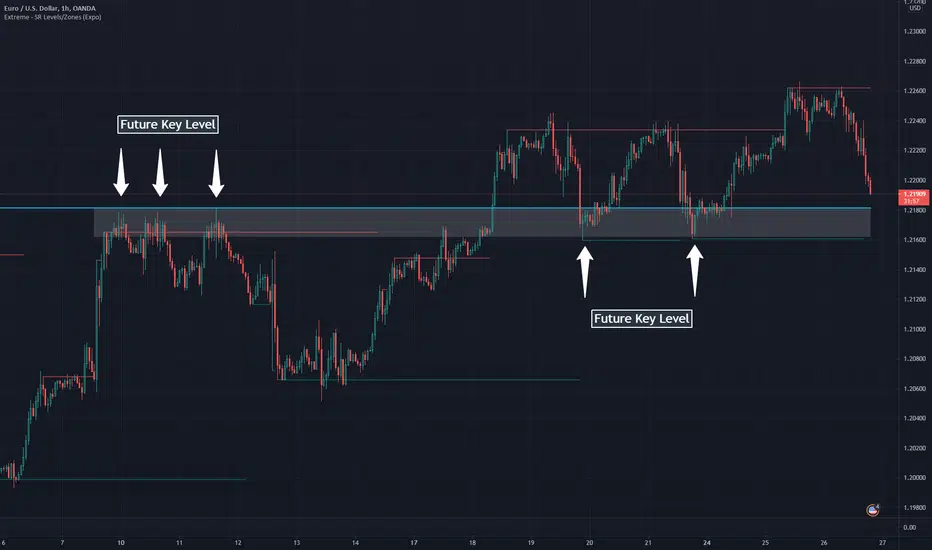
Extreme - SR Levels/Zones (Expo)Extreme - SR Levels/Zones (Expo) automatically searches and prints key support and resistance levels based on "extreme" high & low values.
When the extreme condition is met there is a high probability that the market pauses, makes a pullback, or that the trend change direction. If the current trend is strong, the price will breakout from the previous extreme level.
The indicator can be used standalone or as a part of your current trading strategy.
Real-time
No repainting
Works on any market
HOW TO USE
1. Use the indicator to identify key support and resistance levels.
2. Use the indicator to identify potential breakouts.
3. Use the indicator to identify potential reversal points.
INDICATOR IN ACTION
Daily chart
I hope you find this indicator useful , and please comment or contact me if you like the script or have any questions/suggestions for future improvements. Thanks!
I will continually work on this indicator, so please share your experience and feedback as it will enable me to make even better improvements. Thanks to everyone that has already contacted me regarding my scripts. Your feedback is valuable for future developments!
ACCESS THE INDICATOR
• Contact me on TradingView or use the links below
-----------------
Disclaimer
Copyright by Zeiierman.
The information contained in my scripts/indicators/ideas does not constitute financial advice or a solicitation to buy or sell any securities of any type. I will not accept liability for any loss or damage, including without limitation any loss of profit, which may arise directly or indirectly from the use of or reliance on such information.
All investments involve risk, and the past performance of a security, industry, sector, market, financial product, trading strategy, or individual’s trading does not guarantee future results or returns. Investors are fully responsible for any investment decisions they make. Such decisions should be based solely on an evaluation of their financial circumstances, investment objectives, risk tolerance, and liquidity needs.
My scripts/indicators/ideas are only for educational purposes!
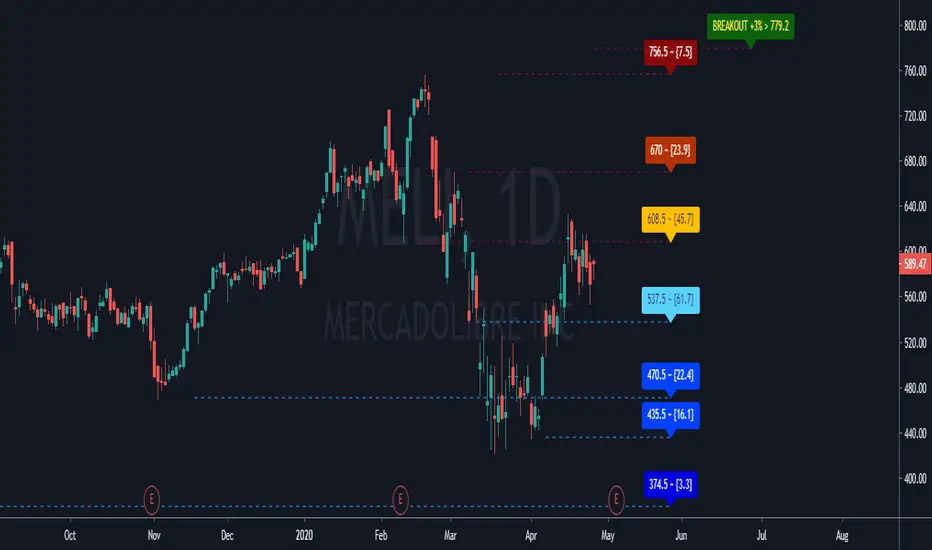
GC Supports & ResistancesThe indicator display the supports and resistances available. Breakout also are reported in case that not exists at least three resistances.
Does print lines and labels with each identified data (S, R and BO).
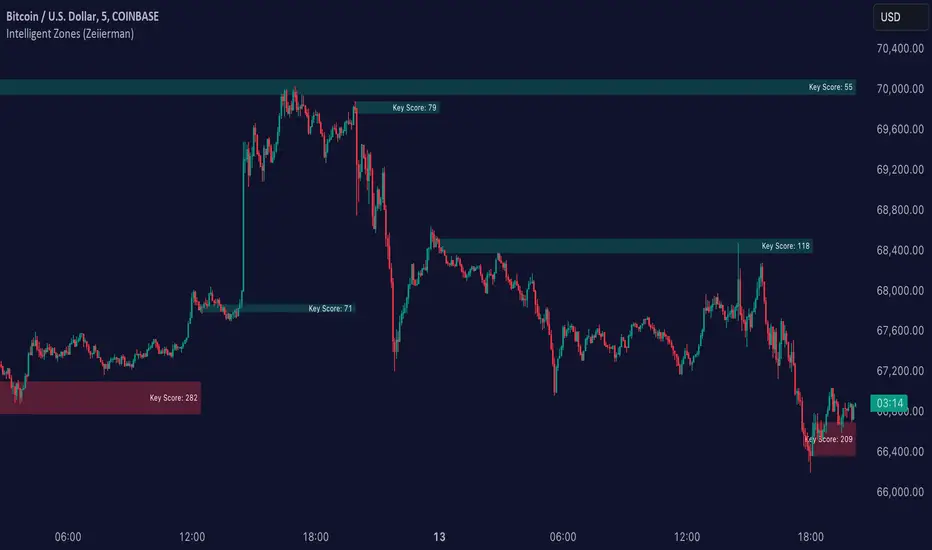
Intelligent Zones (Expo)Intelligent Zones - (Expo)
DESCRIPTION
Intelligent zones is a real-time based indicator that creates colored zones that can act as support or resistance levels. These zones that are painted on the graph are important levels that the future price will react too.
Generally, strategy:
--> If the price crosses up from the cloud it can be considered as a positive “breakout” and the price will most probably continue in that direction.
--> If the price crosses down from the cloud it can be considered as negative “breakout” and the price will most probably continue in that direction.
--> If the price is above the black line it can be considered as positive sentiment, and if the price is below the black line it can be considered as a negative sentiment.
--> The indicator comes in 2 versions. The main difference is how the intelligent cloud is calculated. Sensitive or not.
HOW TO USE
1. Use the indicator to identify real-time market zones.
2. Use the indicator to visualize breakouts.
INDICATOR IN ACTION
The indicator is best presented live, the graphs below are a good guide.
EURUSD
BTCUSD
BRENT
I hope you find this indicator useful , and please comment or contact me if you like the script or have any questions/suggestions for future improvements. Thanks!
I will continue to work on this indicator, so please share your experience and feedback with me so that I can continuously improve it. Thanks to everyone that have contacted me regarding my scripts. Your feedback is valuable for future developments!
ACCESS THE INDICATOR
• Contact me on TradingView or use the links below
-----------------
Disclaimer
Copyright by Zeiierman.
The information contained in my scripts/indicators/ideas does not constitute financial advice or a solicitation to buy or sell any securities of any type. I will not accept liability for any loss or damage, including without limitation any loss of profit, which may arise directly or indirectly from use of or reliance on such information.
All investments involve risk, and the past performance of a security, industry, sector, market, financial product, trading strategy, or individual’s trading does not guarantee future results or returns. Investors are fully responsible for any investment decisions they make. Such decisions should be based solely on an evaluation of their financial circumstances, investment objectives, risk tolerance, and liquidity needs.
My scripts/indicators/ideas are only for educational purposes!
TMA Indicator v2.2This indicator is designed to show support and resistance at local extremes. Configurable SMA crossover events can be used to impart a bullish or bearish bias. This helps to reduce noise on the chart and increase profit factor. In other words, the indicator will only look for bullish breakouts if the fast moving average is above the slow moving average and vice-versa.
SMA Crossover events can be used to filter bullish or bearish resistance levels.
SMA Crossover events can be used to filter bullish or bearish breakout alerts.
Supports alerts for entries and exits based on breakouts of local extrema.
Alerts can be generated at every breakout or with SMA crossover filtering active.
Backtests would suggest that filtering with SMA crossovers often yields slightly lower profit but with a considerable improvement to profit factor.
Green/Red indicates long/short entry
Yellow/Orange indicates long/short exit
See here for an example backtest and visualization of active SMA signal filtering:
For paper trading only. Do not use on real markets. Never make investment decisions based on this indicator alone.

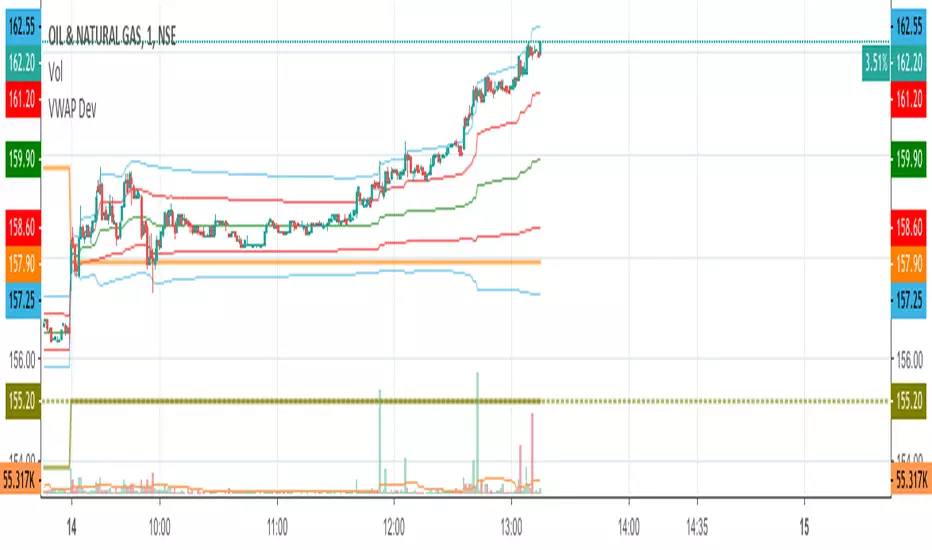
VWAP Stdev BandsCurrent price always obeys VWAP and is very useful for intraday traders. The Price will never go beyond the second deviation of VWAP at any point of time. The deviation bands are also very useful in predicting the volatility of the script.
Breakout trades can be taken based on the previous day's VWAP and it's deviations.
One can say that the stock has experienced breakout if current price crosses the fourth deviation of the previous day's VWAP or price bounces off that level, the price movement will be rapid if this occurs providing a good trading opportunity with low risk-reward ratio.
Power Trend by Atilla YurtsevenPower Trend is the indicator that i have developed for myself and would like to share with you.
Power Trend automatically detects High / Low points and draw trend lines. If you have a look at the graph, you can simply draw a line over last 2 points to combine them and see the trends current state. You can also change High and Low points' sources. I often use Horizontal trend lines by selecting "close" for both High and Low sources.
I also love to use Horizontal Trends. They usually shows breakouts. Expect a breakout when lines are close to each other.
Remember; this is a lagging indicator. If there is a point in the current bar, indicator will draw it after 2 bars!
Disclaimer: All the information in this article, including the algorithm/indicator, was provided and published for informational purposes only and should not be considered legal or financial advice.
Happy trading :)
Atilla Yurtseven

Systematic TF IndicatorThis is a simple trend following indicator which works off moving averages for trend bias and breakouts for entry.

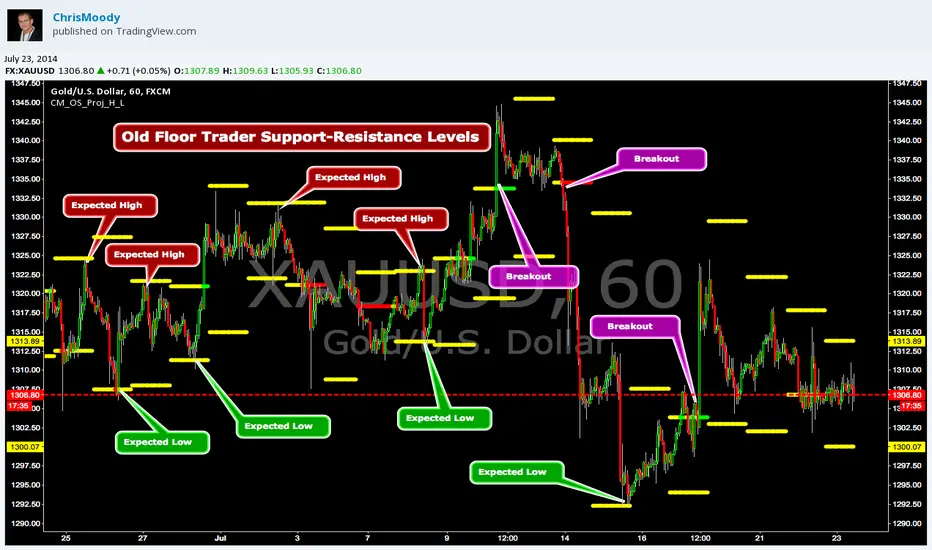
CM_OldSchool_Projected_high_LowHeard this story from Larry Williams…the trader who holds the record for winning the U.S. Trading Championship by turning $10K in to 2 Million.
A trader named Owen Taylor developed this formula as a Floor Trader before to calculate the Projected High and Low of the next day.
The formula worked so well…Owen charged other Traders 1K to get it.
I was pretty impressed with the results…so I coded it for the Weekly, Monthly, Quarterly, and Yearly Projected High Low.
While Owen considered these levels to be major support and resistance, Larry has developed many strategies based on the Breakout of the Projected High Low.
Therefore I coded it so the Levels would plot Yellow, and change to Green if the Projected High was taken out, and Red if the Projected Low was taken out.
***I’ve noticed on many instruments, Stocks, Index’s, Forex etc., depending on the instrument it works great as Support/Resistance or Breakouts.
***On a Daily Chart put the Quarterly and Yearly levels on SPY and EURUSD and go back about 10 years. Levels are pretty accurate.
TSLA 15min EntryTSLA 15min Entry
Indicator Type: Market Structure Breakout & Momentum Confirmation Tool
Timeframe: Optimized for 15-minute charts
The TSLA 15min Entry indicator is designed to identify high-probability directional setups based on structural breakout behavior combined with volume-weighted momentum confirmation.
It highlights potential entry zones where price is showing a decisive break from short-term equilibrium, then provides dynamic stop-loss and tiered take-profit targets to help manage trades systematically.
Key features include:
✅ Automatic Entry Signals: Generates clear LONG or SHORT entries when price confirms a structural breakout pattern.
🟡 Dynamic Stop-Loss: Optional “Tight SL” mode for active day traders, or a balanced default mode for smoother setups.
🔵 Tiered Take-Profit Lines: Displays up to three adjustable TP levels (TP1, TP2, TP3) directly on the chart.
⚙️ Clean Chart Options: Each line (SL, TP1–3) can be toggled on or off individually for a customizable view.
📊 Squeeze & Trend Panel: Helps visualize contraction and expansion phases in momentum — useful for timing entries during volatility shifts.
🕒 Session-Based Logic: All signals and lines reset daily, making it ideal for intraday traders focused on short-term market structure.
This indicator was specifically built and optimized for trading TSLA on the 15-minute timeframe.
Other tickers or timeframes are not recommended, as the logic and signal timing are tuned exclusively for TSLA’s price behavior and volatility.
Extended Hours must be turned on in your TradingView chart settings for the indicator to function properly.
⚠️ Disclaimer: This indicator is for educational and informational purposes only. It does not constitute financial advice or a recommendation to buy or sell any security. Always perform your own analysis and trade responsibly.

ORB Algo⚡ ORB Strategy + Backtesting (Pine Script v5)
This script implements a complete Opening Range Breakout (ORB) strategy, featuring built-in backtesting, advanced TP/SL visualization, full style customization, and a performance dashboard. It is designed for traders who want to clearly evaluate breakout performance directly on the chart.
🕑 ORB Window Configuration
🔹 Session selection: choose between Market Timezone or Custom Session.
🔹 Timezone support: configurable from UTC-8 to UTC+12.
🔹 Daily limit: option to allow only one trade per day.
🔹 Risk/Reward (RR) settings:
Configurable TP1, TP2, and TP3 levels.
Stop Loss calculated dynamically from the ORB range.
📊 Backtesting Engine
🔹 Interactive dashboard showing trades, wins, losses, and win rate.
🔹 Adjustable partial exits for each TP (TP1, TP2, TP3).
🔹 Automatic calculation of percentage-based profit and loss.
🔹 Tracks total trades, total profit, and average profit per trade.
🎨 Visual Customization
🔹 Fully customizable colors:
ORB high/low lines and range fill.
Buy/Sell entry labels.
TP and SL lines with background zones.
🔹 Line style and thickness options (solid, dotted, dashed).
🔹 Visibility controls for each TP/SL level.
🔹 Clear profit and loss zones drawn directly on the chart.
🚀 Trading Logic
🔹 LONG entries: triggered when price breaks above the ORB high.
🔹 SHORT entries: triggered when price breaks below the ORB low.
🔹 Automatic calculation of Stop Loss and TP1, TP2, TP3 based on ORB range and RR.
🔹 Customizable BUY / SELL labels displayed at entry.
✅ TP / SL Detection
🔹 Real-time detection of TP1, TP2, TP3, and SL hits.
🔹 Prevents double counting of the same level.
🔹 Extended TP/SL lines with shaded zones for better clarity.
📈 Backtesting Dashboard
🔹 Displayed in the top-right corner of the chart.
🔹 Shows:
Total trades
Wins / Losses
Win rate (%)
Total profit (%)
Average profit per trade
🔹 Fully customizable panel color.
✨ Summary
This script combines:
Opening Range detection
Breakout trading logic with advanced risk management
Professional-grade visualizations
Integrated historical performance tracking
High customization for sessions, styles, and colors
💡 Ideal for traders who want to trade ORB setups with clarity, structure, and measurable results.

Opening Range Breakout with VWAP & RSI ConfirmationThis indicator identifies breakout trading opportunities based on the Opening Range Breakout (ORB) strategy combined with intraday VWAP and higher timeframe RSI confirmation.
Opening Range: Calculates the high, low, and midpoint of the first 15 or 30 minutes (configurable) after your specified market open time.
Intraday VWAP: A volume-weighted average price calculated manually and reset daily, tracking price action throughout the trading day.
RSI Confirmation: Uses RSI from a user-selected higher timeframe (1H, 4H, or Daily) to confirm signals.
Buy Signal: Triggered when VWAP breaks above the Opening Range High AND the RSI is below or equal to the buy threshold (default 30).
Sell Signal: Triggered when VWAP breaks below the Opening Range Low AND the RSI is above or equal to the sell threshold (default 70).
Visuals: Plots Opening Range levels and VWAP on the chart with clear buy/sell markers and optional labels showing RSI values.
Alerts: Provides alert conditions for buy and sell signals to facilitate timely trading decisions.
This tool helps traders capture momentum breakouts while filtering trades based on momentum strength indicated by RSI.
