SimplicityA simple all in one indicator. Combines a simple moving average with an ATR-based money management system. Simply buy when a candle closes above the MA, and sell when it closes below. Set first TP at 1ATR and initial SL at 1.5-1ATR. When price hits 1st TP, exit half of your position. Use the MA to trail your stop on the other half of the position.
المتوسط المتحرك البسيط

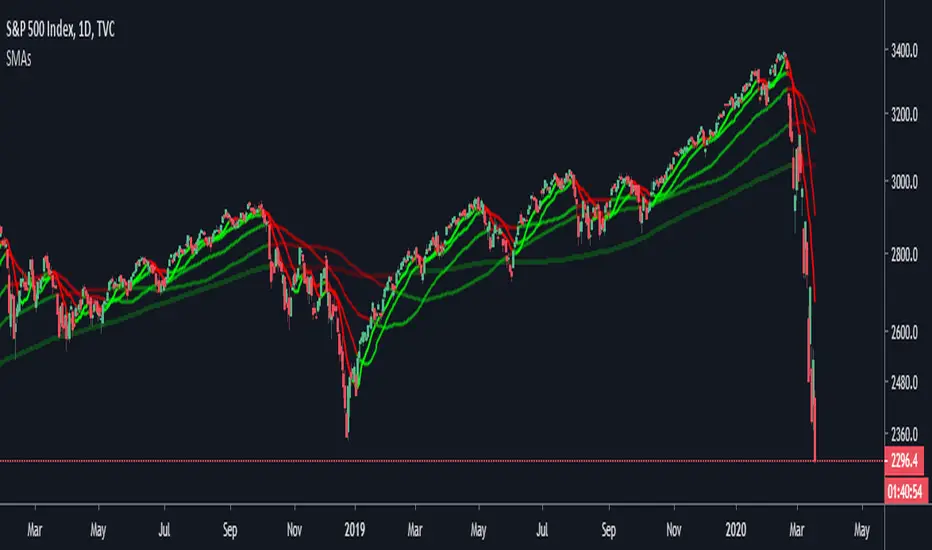
Color Changing SMAsEnter any 5 Simple Moving Averages in Input.
The SMA will be green if the price is above it.
The SMA will be red if the price is below it.
By default the color is set to green and red for all of them. I identify them by their transparency.
You can change the colors and the transparency levels to your liking in the settings.
XBT_Calc._TradersStreamLiqudity Calculator for XBTUSD. And Simplified SMA Cross Overs. If value is True than SMA 21 and 200 is active else SMA 30 and 40. Most of the Traders use this cross overs for Scalping purpose.

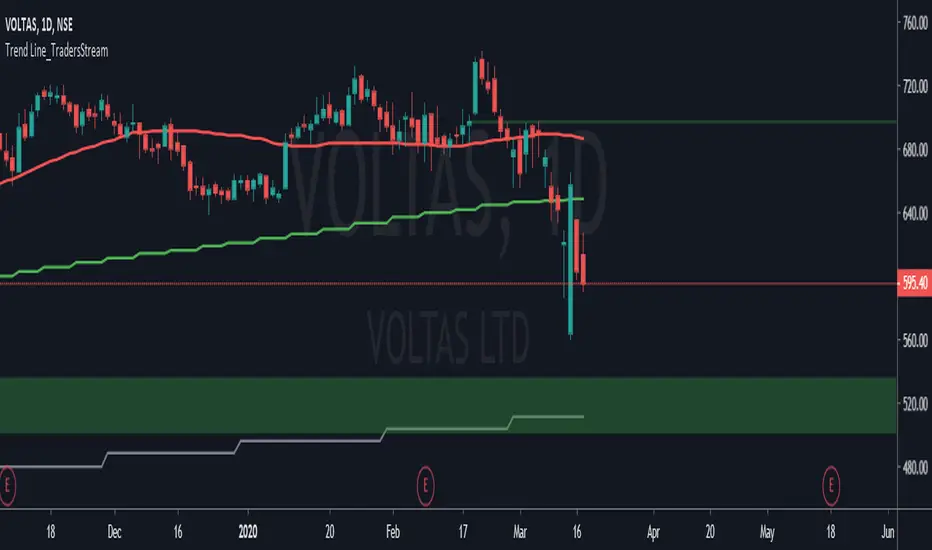
Trend Line_TradersStreamIn this Indicator you will find Multiple Trend Lines like SMA , EMA, RMA, WMA and VWMA. And this Trend lines shows Daily, Weekly and Monthly Trend on any time frame chart. So, that you can get overall trend of the Stock.
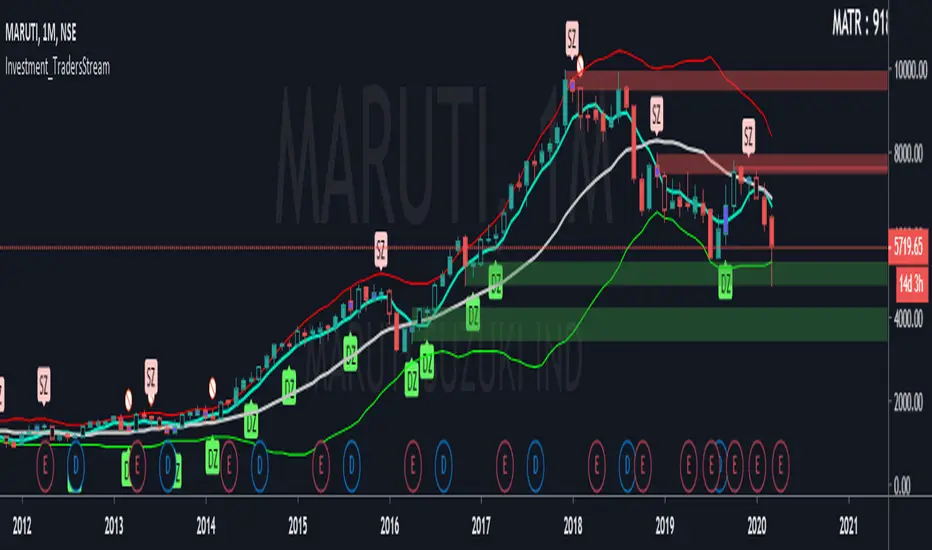
Investment_TradersStreamHello Guys here we are introducing another important tool, in that you can anticipate when to enter Market for Long term Investment and when to Exit you Positions from Long term Investments. We introduced some of uniq indicators that helps to calculate the Risk. Those are Exhaust Candle, Time or Price correction of stock after a strong movement special Moving average to calculate monthly Trend and one of the popular indicator to know that how much movement happened in a stock from a mean line (Bollinger Band). Please comment below for any information.......
ATS Masters Indicator #2This ATS Master Indicator #2 is a collection of multiple useful indicators, which only requires one indicator slot in TradingView.
In this collection you will find the following 12 indicators:
Bollinger Bands (three different types: Fibonacci, Standard, Improved)
Moving Averages (up to two individual MA indicators)
Exponential Moving Averages (up to two individual EMA indicators)
Double Exponential Moving Averages (up to two individual DEMA indicators)
Tripple Exponential Moving Averages (up to two individual TEMA indicators)
Volume Weighted Moving Average
Weighted Moving Average
So, using this master indicator you are able to use up to 12 indicators in one.
If you would like to test this master indicator drop me a line and send a request for it.

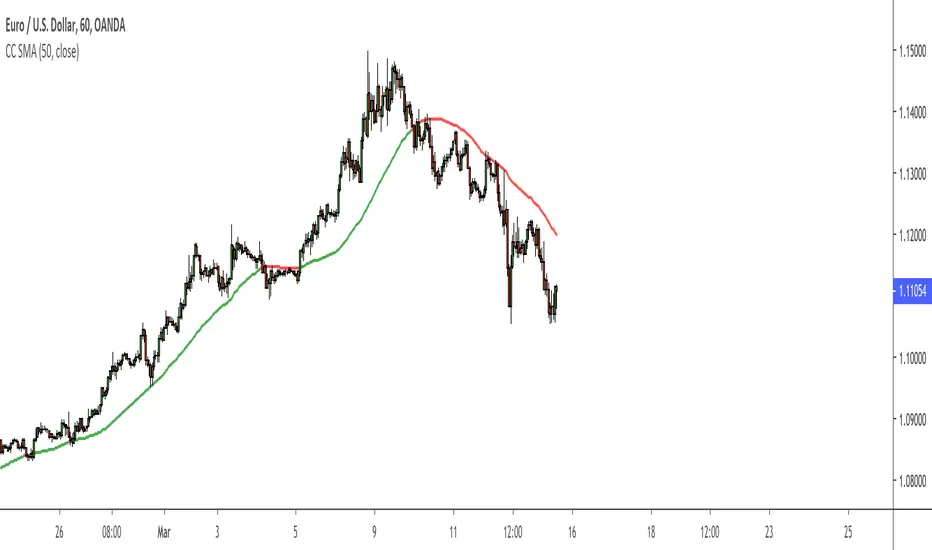
Color Change 50 SMAThis 50 SMA changes color based on the trend of the market.
If the SMA is green, use your edge to determine when to buy.
If the SMA is red, use your edge to determine when to sell.
Can be used on any timeframe and market.
Customize this to meet your needs.
Bitcoin Cycle Top IndicatorBitcoin Cycle Top Indicator on the 1W Bitcoin Logarithmic chart.
Called all 3 tops so far to a T, this indicator will be great use for the next upcoming cycle.
I kept it sweet and simple, no need to overcomplicate. That's all this indicator does.

Golf StrategyHello Everyone This Golf Strategy Base of Multi-Indicator with Multy Condition
By Default, I Add Take profit 1 percentage from Long And Short Side
By Default, I Add Stoploss 1 percentage From Short Long and Short Side
You Can also Change percentage Long and Short side
Thank you so much

WIM-[WorldIsMine]An entry index that adds VWMA as an essence to be aware of trading volume in addition to SMA and BB which are valid in all investment markets.
With alert.

GMS: RSI & ROC StrategyThis is a basic strategy like the RSI one I posted. This one adds in the Rate of Change indicator as well.
You can separate the two for RSI only and ROC only. Everything else is the same as the RSI strategy.
- Simple moving average trend filter.
- Simple moving average trade exit.
- Both long and short or each on it's own.
The source code should be open if you want to see it or modify it for your own project. I hope it helps!
Andre
Global Market Signals

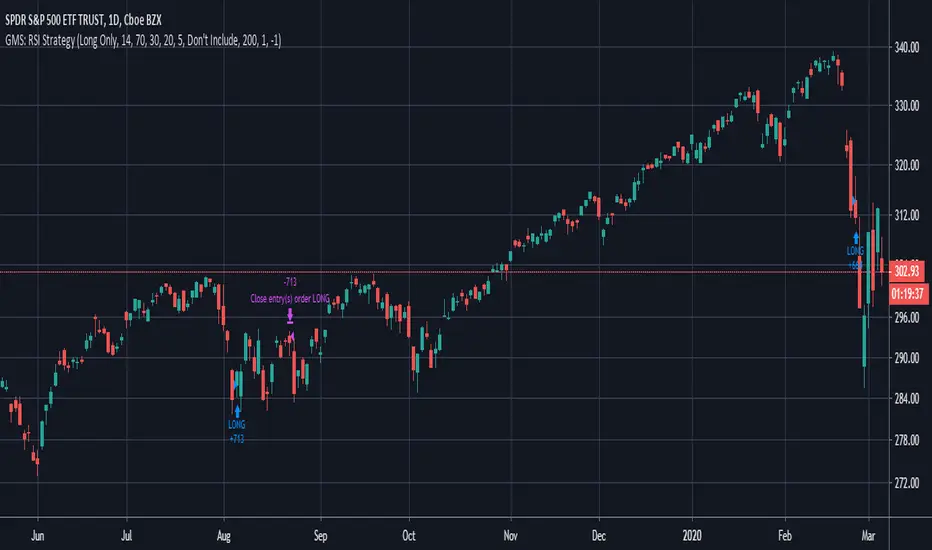
GMS: RSI StrategyThis is just a basic RSI strategy that it easy to use and quite comprehensive so you can quickly test out an idea based on RSI.
- I made it comprehensive in that you can select long, short, or both.
- There is a simple moving average trend filter. You can filter for trades above, below, or don't include it at all.
- The exit is based on a simple moving average.
The source code should be open if you want to see it or modify it for your own project. I hope it helps!
Andre
Global Market Signals
Multiple Moving Averages {Cybernetwork}Multiple moving average (MA) plots in a single script.
Can select between different MA types, and enable/disable a particular MA in the settings.
Enjoy. :)

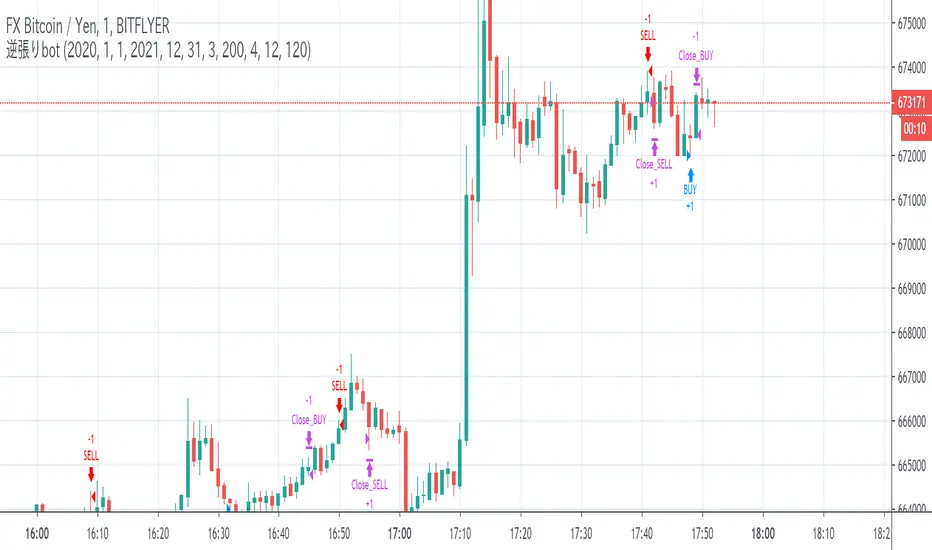
bot strategy1分足逆張りです.この前公開したのよりは遥かに高性能(なはず)です.strategy.exitでstop使ってます.少し詳しくは英文で.
This strategy is the counter trade strategy that I am actually trying to implement, and is realized by a simple combination of 3 indicators (maybe 2 ?. eg. sma ). There is no plan to release the strategy, but it is a script that I personally expect because I am hooked on how to stop the contrarian and the timing of entry. I don't use "security" ,but using strategy.enter(limit) and strategy.exit(stop). It seems that the performance is better than the publicly available "stoploss" because it is not a specific price (eg. 500) range but a variable according to the market price. Since all entry, close, and stop values are shown in the graph, it is possible to find the value back from that value. Good luck.
※Tested environment : FXBTCJPY , 1min
[fikira] MTF MA/EMA'sHere is my take on MA/EMA's and MTF, based on the most excellent work of
"PineCoders" (MTF Selection Framework functions)!
The big advantage is that on 1 image you can easily see where
price is compared to different MA/EMA's (each of different Time Frames).
This gives a lot of Support and Resistance area's!
Includes:
- MA/EMA 20
- MA/EMA 50
- MA/EMA 100
- MA/EMA 200
The present Time Frame MA/EMA has a coloured circle at the side.
Each can be altered in length (the length is visible at the side and changed with the settings)
Each has an extra 4 different Time Frames (multiple settings possible)
Crossover and crossunder MA/EMA 50 with 100 (Silver Cross) and 200 (Golden Cross) is included.
The present Time Frame Cross has a "o" above the Cross
Time Frame 1 Cross has a "1" above the Cross
Time Frame 1 Cross has a "2" above the Cross
Time Frame 1 Cross has a "3" above the Cross
Time Frame 1 Cross has a "4" above the Cross

HIROroom mix indicator「ALL」Moon phases 2020 for Japan
月の満ち欠け 2020年度 日本向け
Full Moon is Purple line
満月は紫色
New Moon is Red line
新月は赤色
ーーーーーーーーーーーーーーーー
Planet orbit cycle Line
惑星の公転周期
Bulu Line : MERCUR
青:水星
Yellow Line : VENUS
黄色:金星
Green Line : EARTH
緑:地球
Orange Line : MSRS
オレンジ:火星
A line that divides one lap into four
1周を4分割したライン
ーーーーーーーーーーーーーーーー
EMA、SMA period can be set
Background used KDJ、SMA logic
When the background is green, there is a chance to buy and when it is red, there is a chance to sell
複数のEMA、SMAを表示できます。
EMA、SMAの期間が設定でき、表示/非表示の設定も可能です。
背景にはKDJのロジックを使用しています。
背景が緑色の時は買いのチャンスで、赤色の時は売りのチャンスです

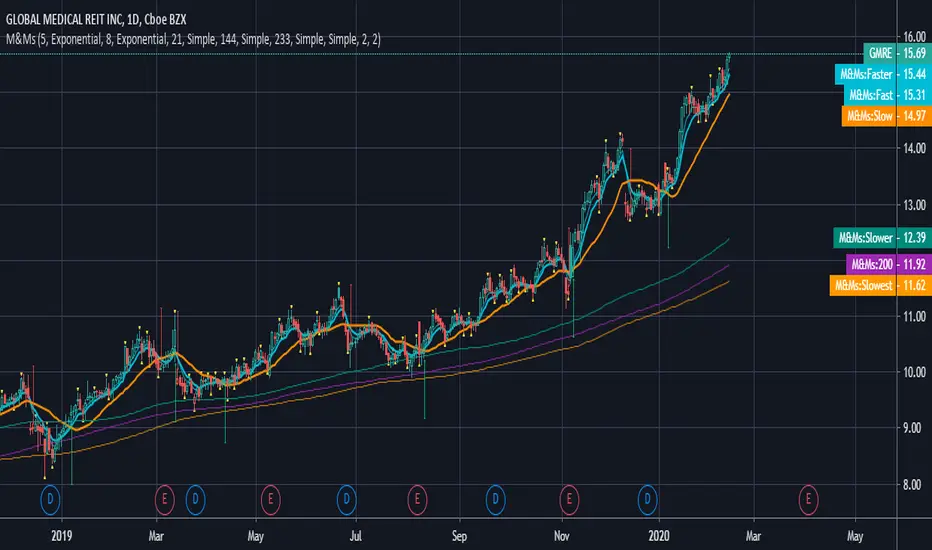
M&Ms - Multiple Moving Average Indicators This version includes Simple, Exponential and Weighted Moving Averages.
TFs Golden Cross - Status BoxThis simple strategy demonstrates the use of Pine Script version 4 "label" feature to show status box.
This box can display anything, in this case it shows current market position, current profit and close price. It renders the box in green if profit is positive, red if negative and blue if neutral.

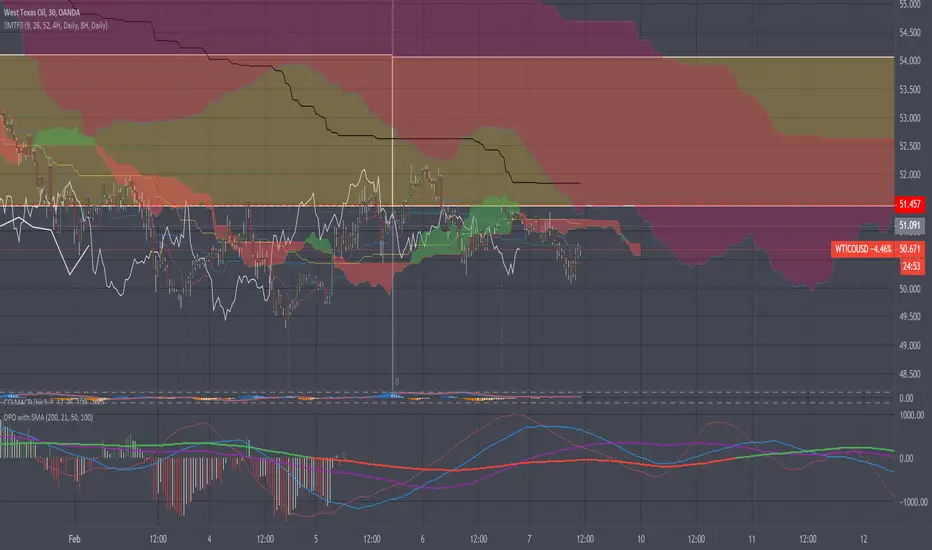
Detrended Price Oscillator with projected SMAHaven't seen any DPO scripts like this one...
Dpo is generaly use to find cycles in the market rather than prices trends.
As you can see a centralized Dpo is ploted with barsback *actual is shown behing actual price timeline.
Using timeline diferences between the two last highest or the two last lowest histogram bands can give you an aproximation of those market cycles.
Dpo SMA's trends can also be use to compare actual price timeline direction in 3 ways...
#-1: Is the actual price (candles) trend is against or with the dpo SMA's (convergence;divergence) ?
#-2: Is the actual price trend is condensed or dispersed ( criticals values)?
#-3: Does the dpo SMA's are near or far from the dpo cycle bottoms or cycle tops ?
Make sure to know that this indicator isn't a trading reccomandation and may not be suited for your trading style as well that it can be badly interpreted. USE WITH CAUTIONS !
//----Coder----//
R.V.
//----Thanx----//
[fikira] Fibma/Fibema StrategyMy strategy regarding the Fibma/Fibema lines (also see my Fibma/Fibema study)
You can enable/disable each strategy to see what
works best in what timeframe
Thanks!
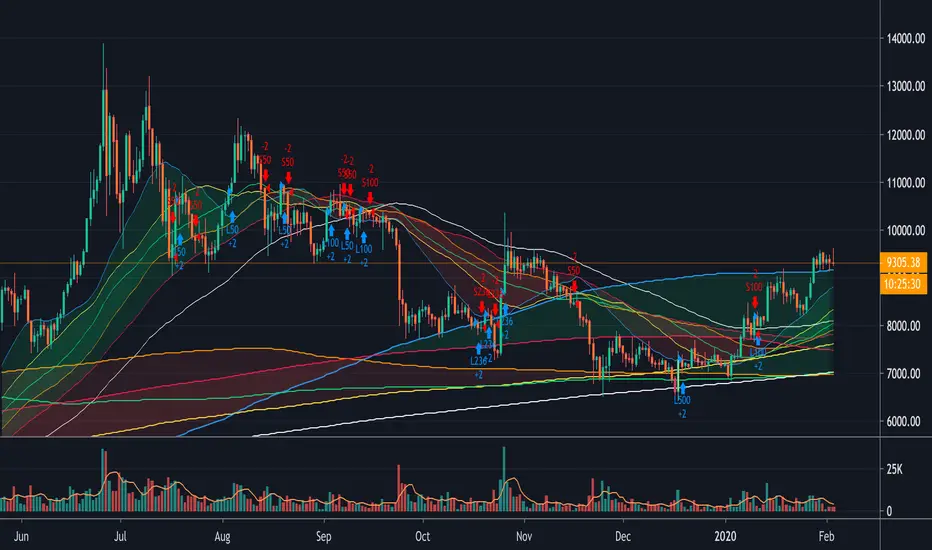
[fikira] Fibonacci MA / EMA's (Fibma / Fibema)I've made SMA/EMA's NOT based on the principle of the 2(1+1), 3(2+1),
5(3+2), 8(5+3), 13(8+5), 21(13+8), 34(21+13), 55(34+21), ... numbers,
but based on these following Fibonacci numbers:
0,236
0,382
0,500
0,618
0,764
1
Ending up with 2 series of Fibma / Fibema:
"Tiny Fibma / Fibema":
24, 38, 50, 62, 76, 100
"Big Fibma / Fibema":
236, 382, 500, 618, 764, 1000
IMHO it is striking how these lines often act as Resistance/Support,
although (except the 50, 100 & 500) they are not typical MA/EMA's.
They perform very well on every Timeframe as well!
Week:
3 Days:
1 Day:
4h:
1h:
Even on the 15 minutes:
Or 5':
Things to watch for:
Price compared to the Tiny or Big Fibma / Fibema (below or above)
Price compared to important Fibma / Fibema (for example below or
above MA 236, MA 764, MA 1000, ...)
Crossing of Fibma / Fibema 24/76, 236/764 and 38/62, 382/618
(bullish crossover = Lime coloured "cloud", bearish crossunder = Red coloured "cloud"),
...
I've made a change in barcolor if the close crosses the "Big Fibma / Fibema 500"
If price closes above MA/EMA 500, the first bar is yellow coloured,
if price stays above this level, candles are coloured lime/orange (= very bullish)
If price closes under MA/EMA 500, the first bar is purple,
if price stays under this level, candles are standard coloured (= very bearish)
Strategy will follow,
Thanks!

MA 12, MA 24, RSI OB-OS, CCI by WP@SITechDeveloped by Worachart Pirunruk, MD - Siam Intelligence Technology
This is the signal that generates based on 4 Technical Analysis Tools:
1. SMA 12,
2. SMA 26,
3. RSI 14,3,3
4. CCI
Signal to Buy/Long when the RSI below Dynamic oversold line based on close price back 60 bars.
Parameter. This signal doesn't have to best TP point, I'm working on improvement, now. Btw, don't forget to calculate you Margin Level. I'll teach you guys later of how to calculate.
Have fun Trading guys, and don't forget to give back to others. Because, Giving is Receiving."
WP@SITech

Price Average [Indicator]It is an index that shows the average price when you buy the same quantity every minute, every hour, every day, every week, every month.
The value at the n-bar is equal to the value of the n moving average.
You can specify a start date and an end date.
매분, 매시, 매일, 매주, 매월 동일한 수량을 매수 했을때의 평단가를 보여주는 지표입니다.
n봉에서의 값은 n평균이동선의 값과 동일합니다.
시작 날짜와 종료 날짜를 지정할 수 있습니다.
