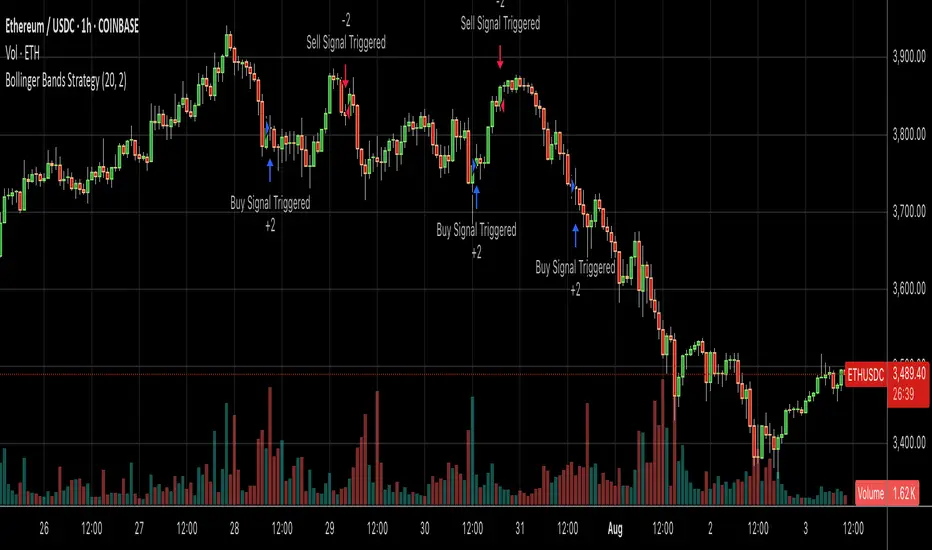
Bollinger Bands SMA 20_2 StrategyMean reversion strategy using Bollinger Bands (20-period SMA with 2.0 standard deviation bands).
Trade Triggers:
🟢 BUY SIGNAL:
When: Price crosses above the lower Bollinger Band
Logic: Price has hit oversold territory and is bouncing back
Action: Places a long position with stop at the lower band
🔴 SELL SIGNAL:
When: Price crosses below the upper Bollinger Band
Logic: Price has hit overbought territory and is pulling back
Action: Places a short position with stop at the upper band
المتوسط المتحرك البسيط
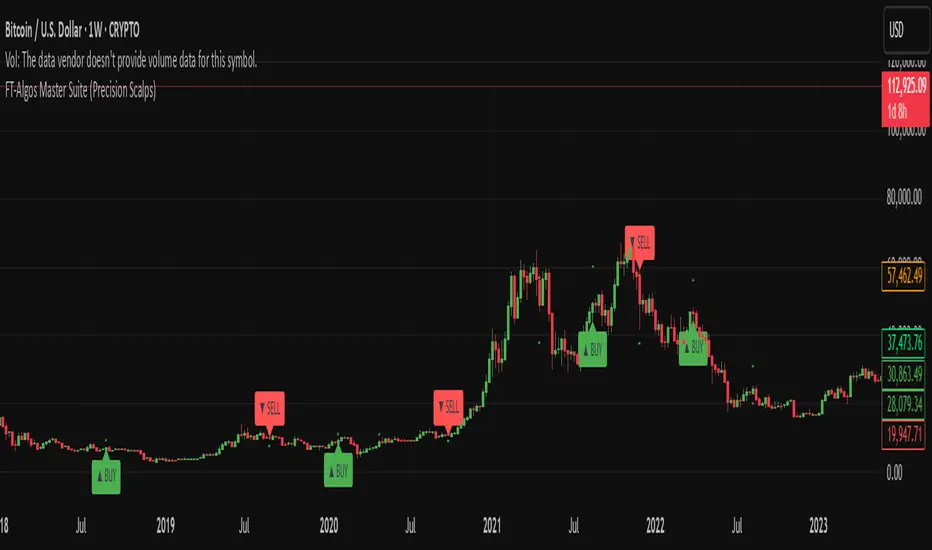
FT-Algos Master SuiteFT-Algos: Unified Alpha Suite
FT-Algos is an all-in-one Pine Script indicator designed to support traders across scalping and swing trading styles with unique multi-strategy logic and clear signals.
Key Features:
Three Trading Modes:
Quick Scalps — Fast momentum-based entries optimized for ultra-short timeframes.
Precision Scalps — Combines MACD flips, Kalman smoothing, Gaussian filters, ZLEMA, and Heikin Ashi SuperTrend to generate high-confidence scalping signals.
Swing Trades — Uses trend stacking with Kalman, ZLEMA, and MACD crossovers confirmed by higher timeframe SuperTrend direction.
Non-Repainting Signals: All entries rely on confirmed candle closes to avoid repainting and false signals.
Visual Entry Markers: Compact BUY and SELL triangle labels placed directly above/below candles for clear signal visualization.
Dynamic Take Profit and Stop Loss Levels: Calculated using Average True Range (ATR) to adjust for current market volatility.
User Configurable Settings: Easily toggle signal visibility, TP/SL display, and short entry signals.
Alert Conditions: Built-in alerts for buy and sell signals enable integration with TradingView’s alert system.
How FT-Algos works:
FT-Algos uniquely blends several filtering methods including Kalman and Gaussian smoothing, momentum evaluation, and multi-timeframe trend validation to minimize noise and improve entry precision. Each mode serves different trading styles—from rapid scalping to higher timeframe swing trading—allowing traders to adapt to their preferred strategy seamlessly.
Disclaimer:
This script is provided as-is for educational and informational purposes only. It does not constitute financial advice. Please test thoroughly and trade responsibly.
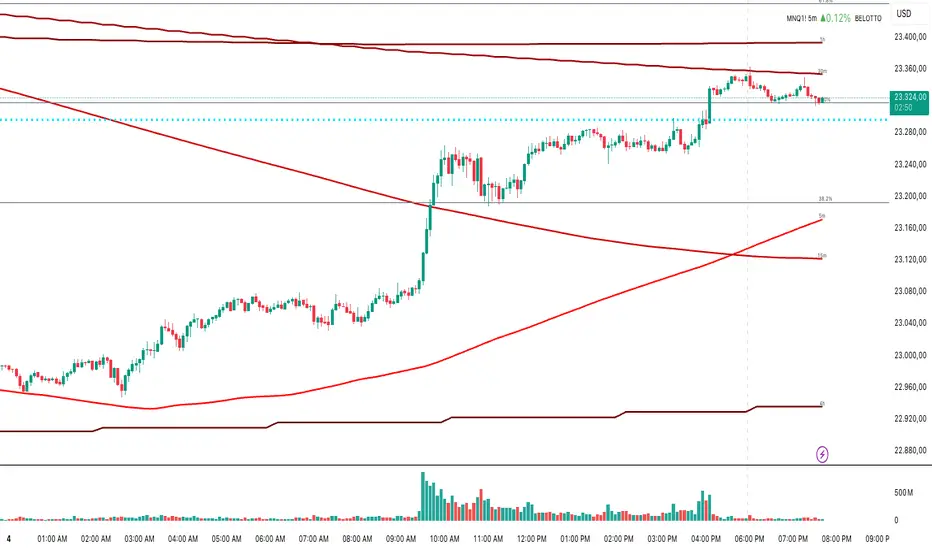
Multi-Timeframe MA 200Multi-Timeframe MA 200
This powerful tool plots the 200-period Moving Average across multiple timeframes (5m, 15m, 30m, 1h, 4h, Daily) directly on your active chart. You can switch between SMA (Simple Moving Average) and EMA (Exponential Moving Average) for all timeframes at once.
Key features:
✅ 100% accurate calculation using the original timeframe
✅ Option to choose SMA or EMA
✅ Visual smoothing for cleaner display
✅ Floating labels showing the origin timeframe
✅ Clean interface – no clutter or legends
✅ Ideal for scalping, intraday, and swing traders
Developed by BELOTTO TRADER, founder of the CLUBE DO GAIN – one of the most engaged trading communities in the Portuguese-speaking world.
Multi Averages - CustomizableThis script adds up to 5 moving averages to your plot!
Both type and length are customizable.

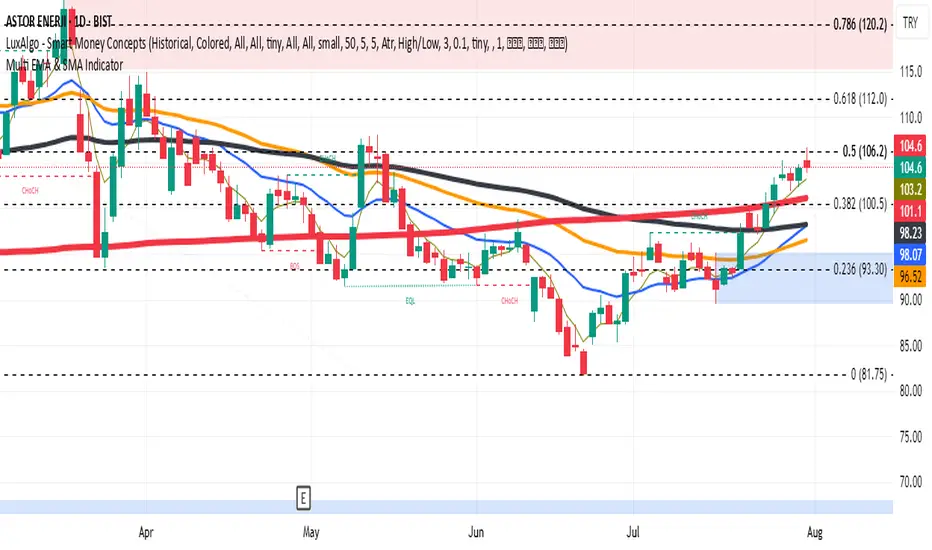
Multi EMA & SMA IndicatorDraws EMA 5/20/50/100 and SMA 200 in different colors and thickness in a single indicator
Super SMA [UnMatrix]Super SMA — Trend-following & Target Tool
The Super SMA is a powerful, user-friendly trend-following indicator designed to help traders identify high-probability entries, exits, and targets on any chart and timeframe. It combines classic moving average cross strategies with volatility, momentum, and separation filters to generate reliable buy and sell signals.
Key Features:
1. Signal Clarity: Instantly spots market momentum shifts using dual SMA crossovers.
2. Volatility Filter: Includes an ATR check to avoid choppy, low-volatility conditions.
3. Momentum Confirmation: Optional filter ensures signals only trigger with supporting candle momentum.
4. Automatic Targets: Instantly plots entry, stop loss, and three take profit levels based on ATR and risk.
5. Clean Visuals: Lines and labels are clearly placed for easy reading without cluttering the chart.
6. No repainting: Once a signal appears, it stays, making backtesting and live trading straightforward.
How it Works:
a) Signal Generation: When the fast SMA crosses above (buy) or below (sell) the slower trend SMA, and all filters are met, a trade signal is issued.
b) Trade Management: The indicator automatically draws lines for Entry (EP), Stop Loss (SL), and Take Profits (TP1, TP2, TP3), helping you manage trades visually.
c) Smart Filtering: Only signals with sufficient volatility, momentum, and SMA separation are triggered — reducing false positives.
Best For:
a) Trend-following traders seeking reliable entries and risk management.
b) Any asset or timeframe, from crypto to forex, stocks, and indices.
How to Use:
a) Wait for a Buy+ or Sell+ signal.
b) Use the plotted entry, stop loss, and targets for trade planning.
c) Optionally, combine with your favorite price action or confirmation tools.
Give Super SMA a try and streamline your trend-trading with confidence!

EMA 10,20 SMA 50, 200This indicator is very helpful for swing traders who plan their trades using EMAs and SMAs. It is used on the daily chart and displays the 10- and 20-EMA, as well as the 50- and 200-SMA.

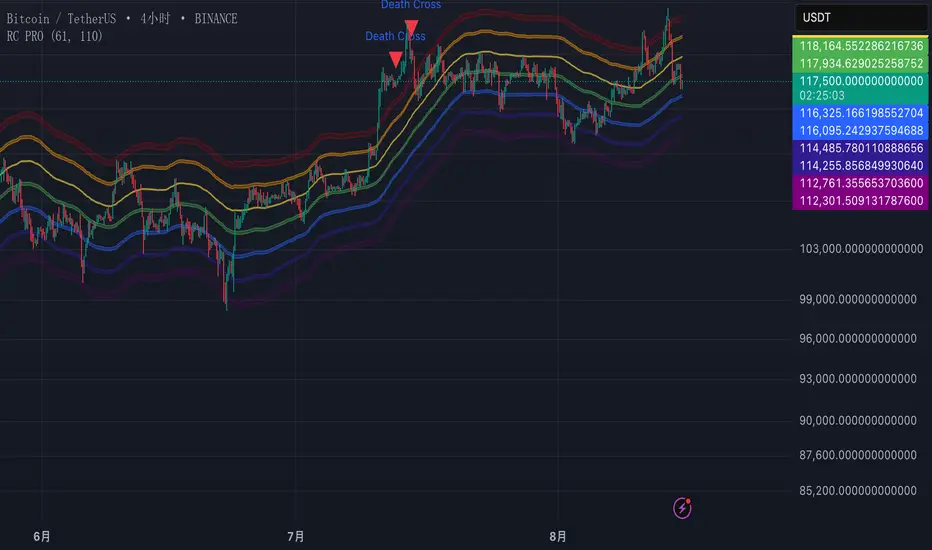
Rainbow Channels(PRO) by MrLazycatPro版和Free版的区别
懒猫先生的免费版Rainbow Channels仅仅展示了价格的虹色通道,没有对价格进入重要压力或支撑区域进行额外视觉提示或警报。
但这个PRO版增加其他功能
1.警报功能: PRO版增加了两个重要警报,帮助用户实时监控市场动态。
当价格从下方升穿红色压力区时,会触发警报,提示用户价格可能进入压力区域。
当价格从上方跌破紫色支撑区时,会触发警报,提示用户价格可能进入支撑区域。
2. 视觉增强功能: PRO版通过填充红色和紫色区域之间的底色,增强了图表的视觉表现,使用户更直观地识别关键压力和支撑区域。
Difference between free version and pro version
The free version Rainbow Channels by MrLazycat displays only the rainbow channels without additional visual cues or alerts for crossing into key pressure or support zones.
This PRO Version Rainbow Channels includes:
1.Alert Feature: The PRO version introduces two critical alerts to help users monitor market dynamics in real-time.
An alert is triggered when the price crosses up from below into the red pressure zone, notifying users of potential entry into a pressure area.
An alert is triggered when the price breaks down from above into the purple support zone, notifying users of potential entry into a support area.
2.Enhanced Visuals: The PRO version fills the areas between the red and purple lines, enhancing the chart's visual representation and allowing users to more intuitively identify key pressure and support zones.
This PRO version provides a more comprehensive toolset for traders by combining real-time alerts with enhanced visual cues, making crucial zones easier to spot and react to.

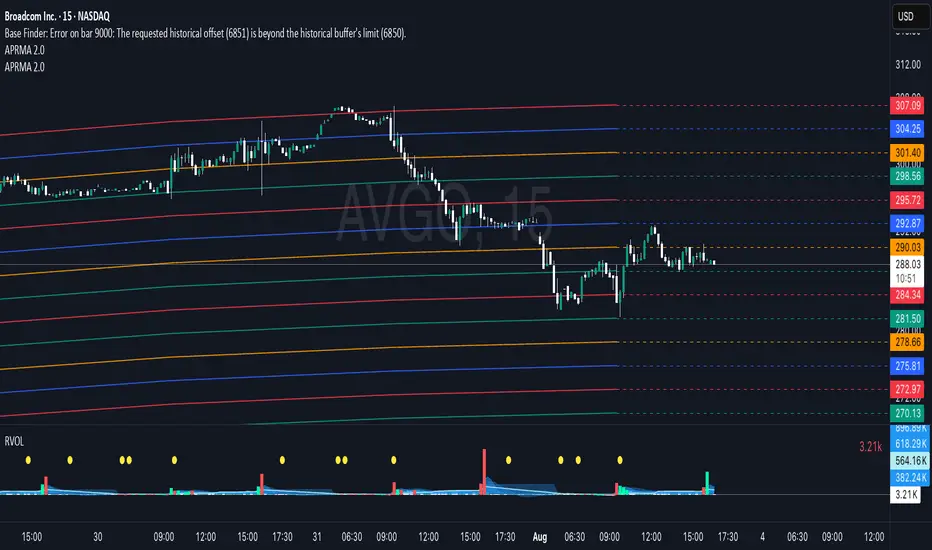
Adjustable Percentage Range Moving Average - Add'l LinesThe Adjustable Percentage Range Moving Average (APRMA), originally developed by @ReallyWendy, is a versatile PineScript indicator designed for traders and market analysts to analyze market volatility and identify trends dynamically. Building on the original concept, this updated version plots a central moving average (MA) with four customizable percentage-based range bands around it. Users can select the MA type (SMA, EMA, HMA, RMA, SWMA, TMA, WMA, VWMA), timeframe, and length, tailoring the indicator to their trading style. Each range band (upper and lower) is calculated as a percentage offset from the MA, with adjustable colors and transparency settings for enhanced visual clarity. Extension lines project the latest values forward, with customizable styles (solid, dashed, dotted). The indicator includes toggleable display options for the MA and each range pair, making it an effective tool for identifying price ranges, support/resistance levels, and trend dynamics.
Credit to @ReallyWendy for the foundational concept.
200 SMA (5%/-3% Buffer) for SPY & QQQ In my testing TQQQ is an absolute monster of an ETF that performs extremely well even from a buy and hold standpoint over long periods of time, its largest drawback is the massive drawdown exposure that it faces which can be easily sidestepped with this strategy.
This strategy is meant to basically abuse TQQQ's insane outperformance while augmenting the typical 200SMA strategy in a way that uses all of its strengths while avoiding getting whipsawed in sideways markets.
The strategy BUYS when price crosses 5% over the 200SMA and then SELLS when price drops 3% below the 200SMA. Between trades I'll be parking my entire account in SGOV.
So maximizing profit while minimizing risk.
You use the strategy based off of QQQ and then make the trades on TQQQ when it tells you to BUY/SELL.
Here are some reasons why I will be using this strategy:
Simple emotionless BUY and SELL signals where I don't care who the president is, what is happening in the world, who is bombing who, who the leadership team is, no attachment to individual companies and diversified across the NASDAQ.
~85% win percentage and when it does lose the loses are nothing compared to the wins and after a loss you're basically set up for a massive win in the next trade.
Max drawdown of around 53% when using TQQQ
You benefit massively when the market is doing well and when there is a recession you basically sit in SGOV for a year and then are set up for a monster recovery with a clear easy BUY signal. So as long as you're patient you win regardless of what happens.
The trades are often very long term resulting in you taking advantage of Long Term Capital Gains tax advantage which could mean saving up to 15-20% in taxes.
With only a few trades you can spend time doing other stuff and don't have to track or pay attention to anything that is happening.
Simple, easy, and massively profitable.

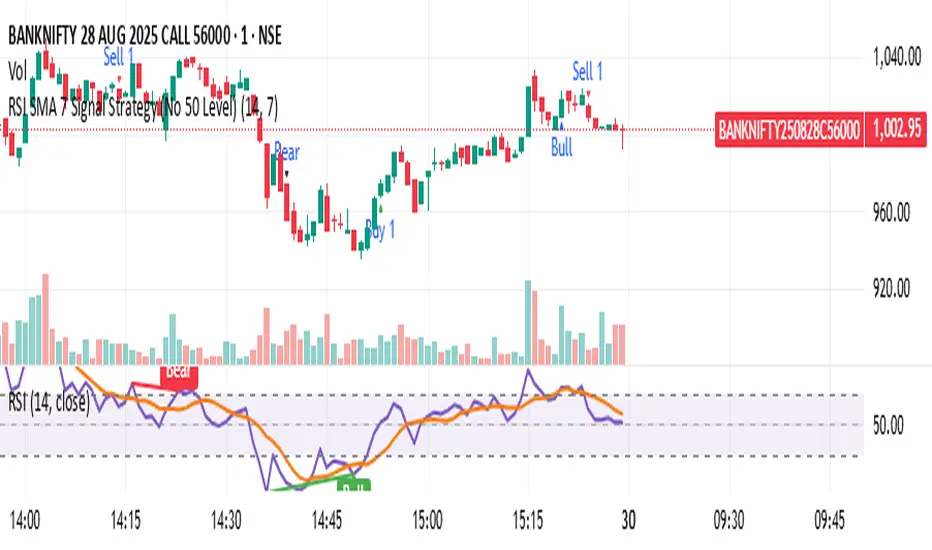
RSI SMA 7 Signal Strategy (No 50 Level)Script uses SMA 7 Perio and 14 Period RSI
If SMA crosses 40 RSI level from below consider it a buy zone or buy signal, if SMA crosses from below 60 RSI level, then super bullish, IF SMA crosses 60 RSI level from above its a profit taking time and Sell zone, if SMA crosses 40 level from above then super bearish sell signal.
SMA WAVE // SUNIL SETHI // V1.0This TradingView indicator visualizes the relationship between two simple moving averages (SMAs) of your choice — default 10-period and 20-period — to help traders quickly identify short-term trend shifts and momentum through color-coded wave fills and line trends.
✅ Dual SMA Calculation
Calculates two SMAs: SMA 1 (default 10) and SMA 2 (default 20).
Option to use any custom timeframe for both SMAs via the SMA Timeframe input.
🎨 Dynamic Visual Feedback
SMA lines change color based on direction:
Rising = Green (or custom)
Falling = Red (or custom)
Optional toggle to use static colors instead.
Wave area between SMA1 and SMA2 is filled with color to show crossovers and divergence.
👁️🗨️ Visibility Controls
Toggle visibility for:
SMA 1 line
SMA 2 line
The wave fill between SMAs
⚙️ Customization Options
Adjust:
SMA lengths
Wave fill transparency
Colors when rising or falling
Manual override colors for SMA lines
📈 How It Works
When SMA 1 > SMA 2, the wave fill shows a rising trend (e.g., green).
When SMA 1 < SMA 2, the fill switches to a falling trend (e.g., red).
The lines themselves also reflect momentum (rising/falling) based on current vs previous value unless overridden.
🧠 Use Cases
Spot short-term trend reversals or momentum shifts
Confirm entries/exits based on SMA crossovers
Visualize trend strength through color intensity and divergence

Breakout Range Signal with Quality Analysis [Dova Lazarus]📌 Breakout Range Signal with Quality Analysis
🎓 Training-focused indicator for breakout logic, SL & TP behavior and signal quality assessment
🔷 PURPOSE
This tool identifies breakout candles from a calculated channel range and visually simulates entries, stop losses, and take profits, providing live and historical performance metrics.
⚙️ MAIN SETTINGS
1️⃣ Channel Setup
channel_length = 10 → how many candles are averaged to form channel boundaries
channel_multiplier = 0.0 → adds expansion above/below the base channel
channel_smoothing_type = SMA → smoothing method for high/low averaging
📊 The channel consists of two moving averages: one from highs, the other from lows. When expanded (via multiplier), it creates a buffer range for breakout validation.
2️⃣ Signal Detection
Body > Channel % = 50 → a breakout candle's body must exceed 150% of the channel width
Signal Mode:
• Weak → every valid breakout candle is highlighted
• Strong → only the first signal in a sequence is shown (helps reduce noise)
🟦 Bullish signals (blue):
• Candle opens inside the channel
• Closes above the channel
• Body is large enough
• Optional: confirms with trend (if enabled)
🟨 Bearish signals (yellow):
• Candle opens inside the channel
• Closes below the channel
• Body is large enough
• Optional: confirms with trend
3️⃣ Trend Filter (optional)
Enabled via checkbox
Uses a higher timeframe MA to filter signals
Bullish signals are allowed only if price is below the trend MA
Bearish signals only if price is above it
⏱️ trend_timeframe = 1D (typically set higher than the chart's timeframe)
🟢 Trend line is plotted if enabled
🎯 ENTRY, STOP LOSS & TAKE PROFIT LOGIC
SL and TP are based on channel width, not fixed pip/tick size:
📍 Entry Price = close of the breakout candle
🛑 Stop Loss:
• Bullish → below the lower channel border (minus offset)
• Bearish → above the upper channel border (plus offset)
🎯 Take Profit:
• Bullish → entry + channel width × profit multiplier
• Bearish → entry − channel width × profit multiplier
You can control:
Profit Target Multiplier (e.g., 1.0 → TP = 1×channel width)
Stop Loss Target Multiplier (e.g., 0.5 → SL = 0.5×channel width)
Signals to Show = how many historical SL/TP setups to display
📈 Lines and labels ("TP", "SL") are drawn on the chart for clarity.
🧪 QUALITY ANALYSIS MODULE
If enabled, the indicator will:
Track each new signal (entry, SL, TP)
Analyze outcomes:
• Win = TP hit before SL
• Loss = SL hit before TP
• Expired = signal unresolved after N bars
Display statistics in a table (top-right corner):
📋 Table fields:
✅ Overall win rate
📈 Bullish win rate
📉 Bearish win rate
🔢 Total signals
🕓 Pending (still active trades)
Maximum bars to wait for outcome is customizable (max_bars_to_analyze).
📐 VISUALIZATION TOOLS
TP / SL lines per signal
Labels “TP” and “SL”
Optional channel lines and trendline for better context
Colored bars for valid signals (blue/yellow)
📌 BEST USE CASES
Understand how breakout signals are formed
Learn SL/TP logic based on dynamic range
Test how volatility affects trade outcomes
Use as a visual simulation of trade behavior over time

FFI-Trend Rider ProFFI-Trend Rider Pro is a trend-following strategy designed to help traders make more structured and disciplined entries.
It uses a crossover between the 11 EMA and 21 SMA to detect potential trend shifts, while avoiding premature entries by checking how far the price is from the moving averages. If the price is extended, it waits for a pullback — just like professional traders do.
The indicator also includes:
Auto stoploss based on 21 SMA
Visual background colors based on RSI to help gauge trend strength
A built-in trade info table showing current trade type, entry price, stoploss, and trailing SL
Strategy-enabled functionality for easy backtesting
🔍 Ideal For:
Intraday & Swing Traders
Traders who want fewer, high-quality trades
Anyone looking to reduce emotional decision-making
⚠️ Disclaimer:
This script is for educational purposes only and does not constitute financial advice. Always do your own analysis before making any trading decisions. Past performance is not indicative of future results.

Daily Moving Average to Intraday ChartPlaces 200D, 100D, 50D SMAs as well as the 20D EMA onto intraday charts. (Script v6)

Multiple SMAsPlots multiple SMAs in a single indicator.
This script only plots the SMAs if the timeframe is set to daily.
- SMA10 in light blue
- SMA20 in yellow
- SMA50 in red
- SMA100 in green
- SMA200 in blue
It also plots the crosses between SMA20 and SMA50
10/20 MA Coil: Progressive Colors & Multi-Day BreakoutThis indicator detects price “coil” setups and highlights potential breakout or breakdown opportunities using moving average alignment and volatility compression.
Features:
• Coil Detection:
• Identifies consolidation when:
• The 10 and 20 MAs are tightly aligned (within user-defined tolerance)
• Price is above both MAs and within 1.5x ADR of them
• The 50 MA is rising
• Progressive Coil Coloring:
• Coil candles are colored in progressively darker orange as the streak continues
• Bullish Breakout Signal:
• Triggers when a green candle follows a coiled bar
• The candle’s body must be greater than or equal to 1 ATR
• Colored lime green
• Bearish Breakdown Signal:
• Triggers when a red candle follows a coiled bar
• The candle’s body must be greater than or equal to 1 ATR to the downside
• Colored black
• Custom Candle Rendering:
• Candle body color represents coil or breakout state
• Wick and border are red or green to reflect price direction
• Optional Debug Tools:
• Coil streak, ATR, and distance from MAs can be plotted for deeper analysis
This script is designed for traders looking to spot price compression and prepare for high-probability moves following low-volatility setups.

Multi-Timeframe 200 SMAs (2m, 5m, 10m, 1H, 1D)Intraday 200 SMA Multi-Timeframe Overlay
This indicator displays the 200-period Simple Moving Averages (SMA) from the 2-minute, 5-minute, 10-minute, 1-hour, and 1-day timeframes on any chart — providing powerful multi-timeframe context for intraday trading.
Each moving average is color-coded and labeled for quick reference, helping traders identify dynamic support and resistance levels across key timeframes without needing to switch charts. Designed specifically for day traders, this tool enhances situational awareness and assists in aligning trades with broader trend direction.
Features:
2-minute 200 SMA (Yellow)
5-minute 200 SMA (Light Orange)
10-minute 200 SMA (Dark Orange)
1-hour 200 SMA (Red)
1-day 200 SMA (Purple)
Displayed on any intraday chart
Clean line styles with optional labels for timeframe reference
Perfect for scalpers and intraday swing traders who rely on higher timeframe moving averages for confluence and trade validation.
Daily 50‑ & 200‑SMA Ceiling Radar — EnhancedDescription:
This custom TradingView indicator, developed by Trader Malik and licensed under Trades Per Minute, is a powerful visual tool for identifying how price behaves relative to major daily moving averages — the 50-SMA and 200-SMA. It helps traders quickly understand key technical dynamics such as trend alignment, MA proximity, and short-term momentum sentiment — all displayed on a clean, minimal overlay with visual alerts and an adjustable data table.
FEATURES
1. Daily 50 & 200 Simple Moving Averages (SMA):**
- Displayed directly on the chart using distinct blue and orange lines.
- These serve as primary trend filters and support/resistance zones.
2. Price Highlighting:
- A red background flashes momentarily when the price crosses either the 50-SMA or 200-SMA.
- A green background fills the chart when price is above both MAs (bullish zone).
- A red background persists if price is below both MAs (bearish zone).
3. MA Gap Analysis Table:
- 50-SMA Row**: Shows % gap between 50-SMA and 200-SMA.
- 200-SMA Row**: Shows % gap between 200-SMA and 50-SMA.
- Sentiment Row**: Displays short-term trend bias based on the slope of the past 7 daily closes — Bullish, Neutral, or Bearish.
USER SETTINGS
Table Location: Choose between **Top Right** or **Bottom Right** of the chart.
Table Size: Select **Small**, **Medium**, or **Large** to suit screen preferences and layout aesthetics.
This script is **intellectual property of Trades Per Minute** and distributed by **Trader Malik** for use under licensing terms. Redistribution or repurposing without authorization is strictly prohibited.

Multi SMA AnalyzerMulti SMA Analyzer with Custom SMA Table & Advanced Session Logic
A feature-rich SMA analysis suite for traders, offering up to 7 configurable SMAs, in-depth trend detection, real-time table, and true session-aware calculations.
Ideal for those who want to combine intraday, swing, and higher-timeframe trend analysis with maximum chart flexibility.
Key Features
📊 Multi-SMA Overlay
- 7 SMAs (default: 5, 20, 50, 100, 200, 21, 34)—individually configurable (period, source, color, line style)
- Show/hide each SMA, custom line style (solid, stepline, circles), and color logic
- Dynamic color: full opacity above SMA, reduced when below
⏰ Session-Aware SMAs
- Each SMA can be calculated using only user-defined session hours/days/timezone
- “Ignore extended hours” option for accurate intraday trend
📋 Smart Data Table
- Live SMA values, % distance from price, and directional arrows (↑/↓/→)
- Bull/Bear/Sideways trend classification
- Custom table position, size, colors, transparency
- Table can run on chart or custom (higher) timeframe for multi-TF analysis
🎯 Golden/Death Cross Detection
- Flexible crossover engine: select any two from (5, 10, 20, 50, 100, 200) for fast/slow SMA cross signals
- Plots icons (★ Golden, 💀 Death), optional crossover labels with custom size/colors
🏷️ SMA Labels
- Optional on-chart SMA period labels
- Custom placement (above/below/on line), size, color, offset
🚨 Signal & Trend Engine
- Bull/Bear/Sideways logic: price vs. multiple SMAs (not just one pair)
- Volume spike detection (2x 20-period SMA)
- Bullish engulfing candlestick detection
- All signals can use chart or custom table timeframe
🎨 Visual Customization
- Dynamic background color (Bull: green, Bear: red, Neutral: gray)
- Every visual aspect is customizable: label/table colors, transparency, size, position
🔔 Built-in Alerts
- Crossovers (SMA20/50, Golden/Death)
- Bull trend, volume spikes, engulfing pattern—all alert-ready
How It Works
- Session Filtering:
- SMAs can be set to count only bars from your chosen market session, for true intraday/trading-hour signals
Dynamic Table & Signals:
- Table and all signal logic run on your selected chart or custom timeframe
Flexible Crossover:
- Choose any pair (5, 10, 20, 50, 100, 200) for cross detection—SMA 10 is available for crossover even if not shown as an SMA line
Everything is modular:
- Toggle features, set visuals, and alerts to your workflow
🚨 How to Use Alerts
- All key signals (crossovers, trend shifts, volume spikes, engulfing patterns) are available as alert conditions.
To enable:
- Click the “Alerts” (clock) icon at the top of TradingView.
- Select your desired signal (e.g., “Golden Cross”) from the condition dropdown.
- Set your alert preferences and create the alert.
- Now, you’ll get notified automatically whenever a signal occurs!
Perfect For
- Multi-timeframe and swing traders seeking higher timeframe SMA confirmation
- Intraday traders who want to ignore pre/post-market data
- Anyone wanting a modern, powerful, fully customizable multi-SMA overlay
// P.S: Experiment with Golden Cross where Fast SMA is 5 and Slow SMA is 20.
// Set custom timeframe for 4 hr while monitoring your chart on 15 min time frame.
// Enable Background Color and Use Table Timeframe for Background.
// Uncheck Pine labels in Style tab.
Clean, open-source, and loaded with pro features—enjoy!
Like, share, and let me know if you'd like any new features added.

Crypto Narratives: Relative Strength V2Simple Indicator that displays the relative strength of 8 Key narratives against BTC as "Spaghetti" chart. The chart plots an aggregated RSI value for the 5 highest Market Cap cryopto's within each relevant narrative. The chart plots a 14 period SMA RSI for each narrative.
Functionality:
The indicator calculates the average RSI values for the current leading tokens associated with ten different crypto narratives:
- AI (Artificial Intelligence)
- DeFi (Decentralized Finance)
- Memes
- Gaming
- Level 1 (Layer 1 Protocols)
- AI Agents
- Storage/DePin
- RWA (Real-World Assets)
- BTC
Usage Notes:
The 5 crypto coins should be regularly checked and updated (in the script) by overtyping the current values from Rows 24 - 92 to ensure that you are using the up to date list of highest marketcap coins (or coins of your choosing).
The 14 period SMA can be changed in the indicator settings.
The indicator resets every 24 hours and is set to UTC+10. This can be changed by editing the script line 19 and changing the value of "resetHour = 1" to whatever value works for your timezone.
There is also a Rate of Change table that details the % rate of change of each narrative against BTC
Horizontal lines have been included to provide an indication of overbought and oversold levels.
The upper and lower horizontal line (overbought and oversold) can be adjusted through the settings.
The line width, and label offset can be customised through the input options.
Alerts can be set to triggered when a narrative's RSI crosses above the overbought level or below the oversold level. The alerts include the narrative name, RSI value, and the RSI level.

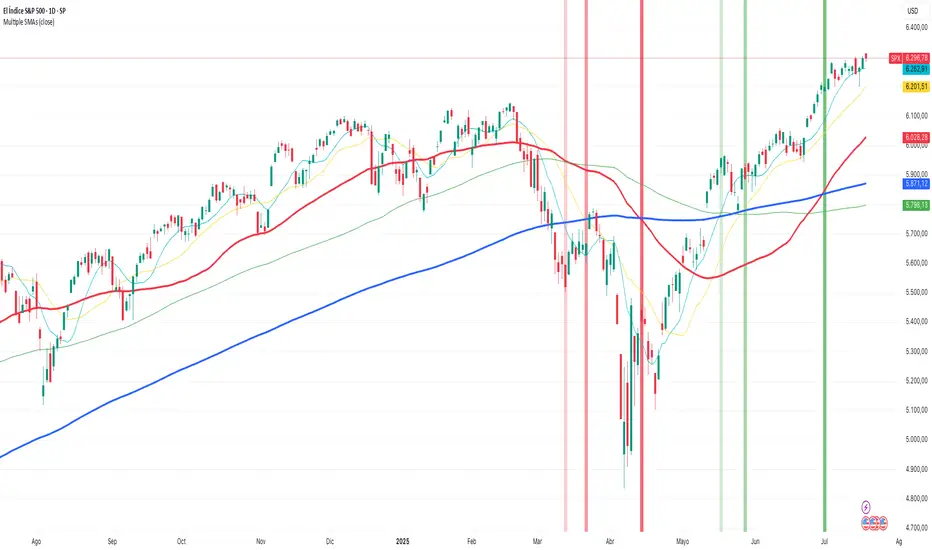
Holy GrailThis is a long-only educational strategy that simulates what happens if you keep adding to a position during pullbacks and only exit when the asset hits a new All-Time High (ATH). It is intended for learning purposes only — not for live trading.
🧠 How it works:
The strategy identifies pullbacks using a simple moving average (MA).
When price dips below the MA, it begins monitoring for the first green candle (close > open).
That green candle signals a potential bottom, so it adds to the position.
If price goes lower, it waits for the next green candle and adds again.
The exit happens after ATH — it sells on each red candle (close < open) once a new ATH is reached.
You can adjust:
MA length (defines what’s considered a pullback)
Initial buy % (how much to pre-fill before signals start)
Buy % per signal (after pullback green candle)
Exit % per red candle after ATH
📊 Intended assets & timeframes:
This strategy is designed for broad market indices and long-term appreciating assets, such as:
SPY, NASDAQ, DAX, FTSE
Use it only on 1D or higher timeframes — it’s not meant for scalping or short-term trading.
⚠️ Important Limitations:
Long-only: The script does not short. It assumes the asset will eventually recover to a new ATH.
Not for all assets: It won't work on assets that may never recover (e.g., single stocks or speculative tokens).
Slow capital deployment: Entries happen gradually and may take a long time to close.
Not optimized for returns: Buy & hold can outperform this strategy.
No slippage, fees, or funding costs included.
This is not a performance strategy. It’s a teaching tool to show that:
High win rate ≠ high profitability
Patience can be deceiving
Many signals = long capital lock-in
🎓 Why it exists:
The purpose of this strategy is to demonstrate market psychology and risk overconfidence. Traders often chase strategies with high win rates without considering holding time, drawdowns, or opportunity cost.
This script helps visualize that phenomenon.
