Moving Average Daily (& Weekly) 50,100,200Free to use Moving Average indicator for 50, 100 and 200 days that displays both the daily and weekly Moving Averages on the same chart - revealing key support and resistance lines that might otherwise be overlooked. Please ensure to view in daily view only.
What is a Moving Average?
Smooths out the price across each period to reveal short, medium and long term trends and their relationship to each other. In principal, when the price is above a moving average the trend is up, when the price is below a moving average the trend is down.
When a short term MA crosses above a long term MA (a "golden cross") it is a strong buy signal. Conversely when a short term MA crosses below a long term MA (a "death cross") it is a strong sell signal. However, a death cross is usually only critical when both MAs are moving downwards.
Note that Moving Averages represent historical data and therefore are not strictly predictive in nature, but show trends that may be in action. Notably the 200 MA will often be particularly respected as support or resistance.
This tool is for educational purposes only and not a recommendation to buy or sell. Always do your own research before trading.
المتوسط المتحرك البسيط

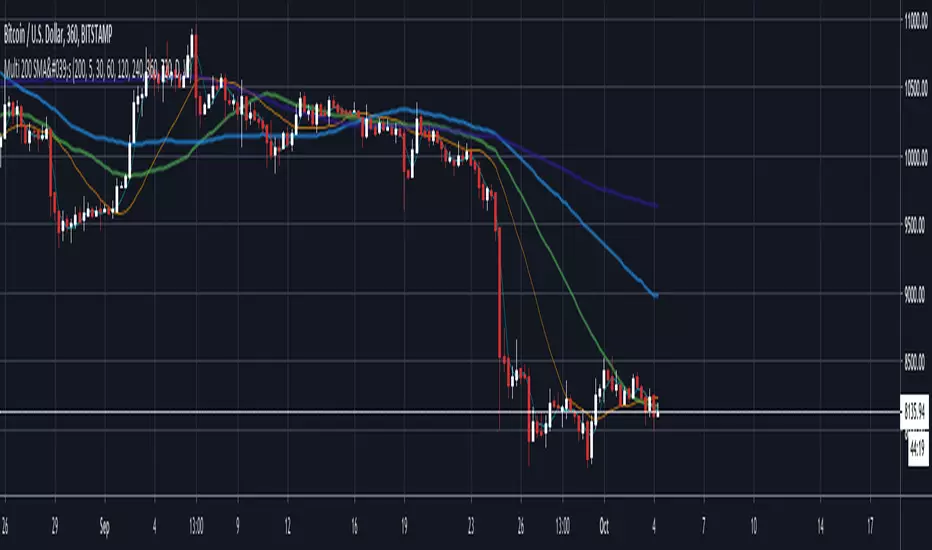
Multi 200 SMA'sIndicator that allows to print multiple timeframes MAs on a single chart instead of opening each timeframe separately
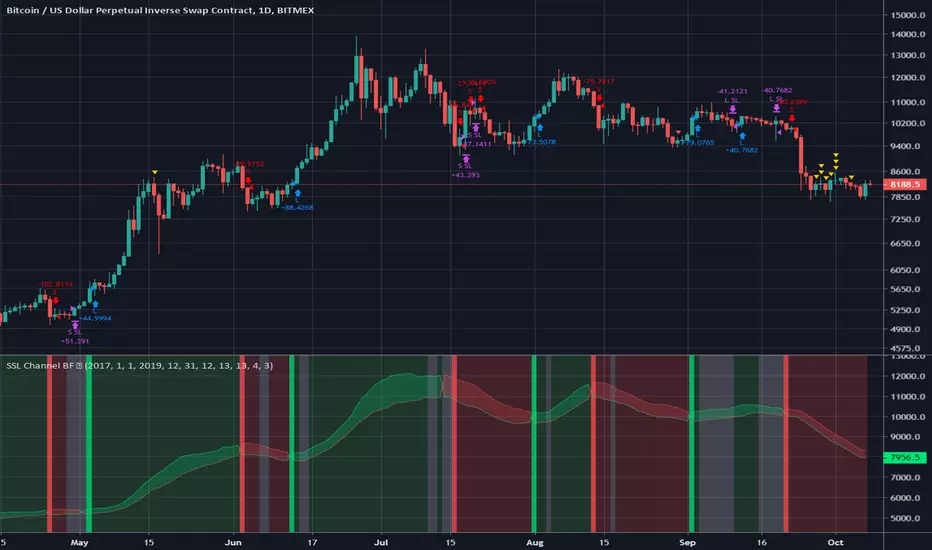
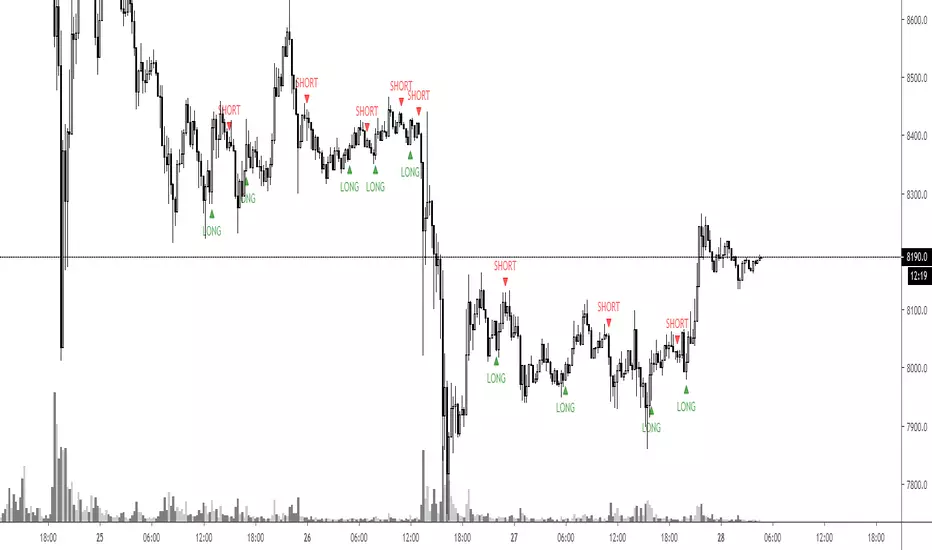
SSL Channel BFSSL Channel Close is a great all-rounder based on 2 Simple Moving Averages, one of recent Highs, one of recent Lows.
The calculation prints a channel on the chart consisting of 2 lines.
This strategy gives a Long signal when price closes above the top of these 2 lines and a Short signal when it closes below the bottom.
Trading in choppy sideways markets can compound losses so we avoid that here by using recent ATR to determine relative volatility and refrain from trading when the background is White.
We use a basic 3% stop loss.
Charted on XBT/USD Bitmex Daily chart.
INSTRUCTIONS
Green = long
Red = short
White Background= No trade
The way I have set this strategy up is that if we get stopped out but we are still in a green or red background, we re-enter. Closing the trade only occurs on an opposing signal or if we get stopped out.
Scripting Tutorial 7 - Triple Many Moving Averages ResolutionsThis script is for a triple moving average indicator where the user can select from different types of moving averages, price sources, lookback periods and resolutions.
Features:
- 3 Moving Averages with variable MA types, periods, price sources, resolutions and the ability to disable each individually
- Crossovers are plotted on the chart with detailed information regarding the crossover (Ex: 50 SMA crossed over 200 SMA )
- Forecasting available for all three MAs. MA values are forecasted 5 values out and plotted as if a continuation to the MA.
- Forecast bias also applies to all forecasting. Bias means we can forecast based on an anticipated bullish, bearish or neutral direction in the market.
- To understand bias, please read the source code, or if you can't read the code just send me a message on here or Twitter. Twitter should be linked to my profile.
This script is meant as an educational script with well-formatted styling, and references for specific functions.
Multiple SMAs + X-Bar High/LowWhen starting my daily analysis, I typically open a daily chart and check where the price is compared to several SMAs, as well as check the high/low of today and the 10-day high/low. This indicator was designed to save chart space as well as make finding the highs and lows more efficient. Everything is adjustable, so you don't have to stick with my 10-bar rule.

Smoothed RSIThis smoothed RSI indicator is designed to allow users to try and identify periods of extended time in oversold and overbought areas using a smoothed RSI value.
Features:
- RSI
- Period
- Source
- Resolution
- Visibility
- Smoothed RSI
- Period
- Moving Average Type
- Visibility


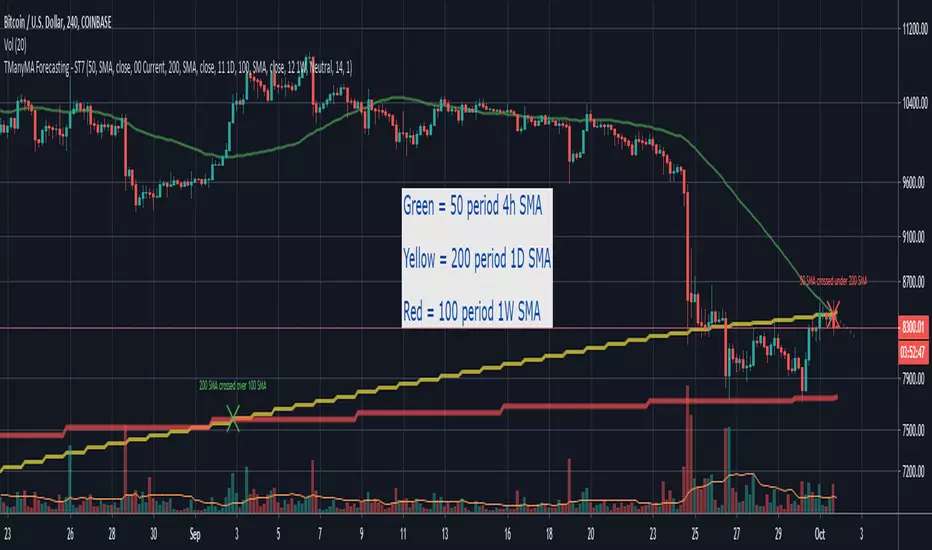
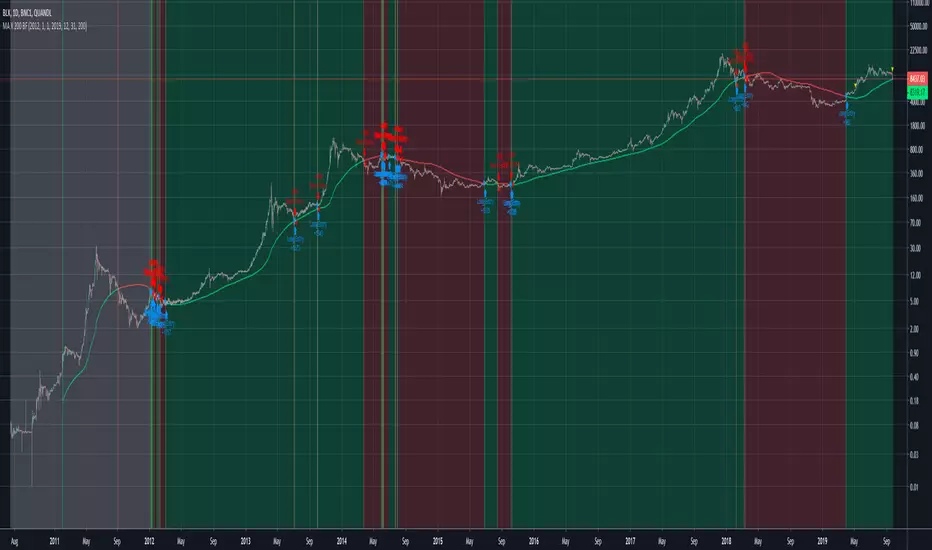
MA X 200 BFGo long when the price closes above the 200 SMA.
Go short when the price crosses under the 200 SMA.
Keep it simple.
MavCrossover v2Simple moving average crossover strategy with
SMA and EMA,
a time window and
the possibility to set the 2nd MA as a factor of the 1st one (to quick cycle through them)

DT21 Moving Averages
I know a lot of people use the free version of TradingView, So I made a script to combine 5 Moving averages as 1 indicator for my followers
Scripting Tutorial 6 - Triple Many Moving Averages ForecastingThis script is for a triple moving average indicator where the user can select from different types of moving averages, price sources and lookback periods.
Features:
- 3 Moving Averages with variable MA types, periods, price sources and ability to disable each individually
- Crossovers are plotted on the chart with detailed information regarding the crossover (Ex: 50 SMA crossed over 200 SMA )
- Forecasting available for all three MAs. MA values are forecasted 5 values out and plotted as if a continuation to the MA.
- Forecast bias also applies to all forecasting. Bias means we can forecast based on an anticipated bullish, bearish or neutral direction in the market.
- To understand bias, please read the source code, or if you can't read the code just send me a message on here or Twitter. Twitter should be linked on my profile.
This script is meant as an educational script with well-formatted styling, and references for specific functions.

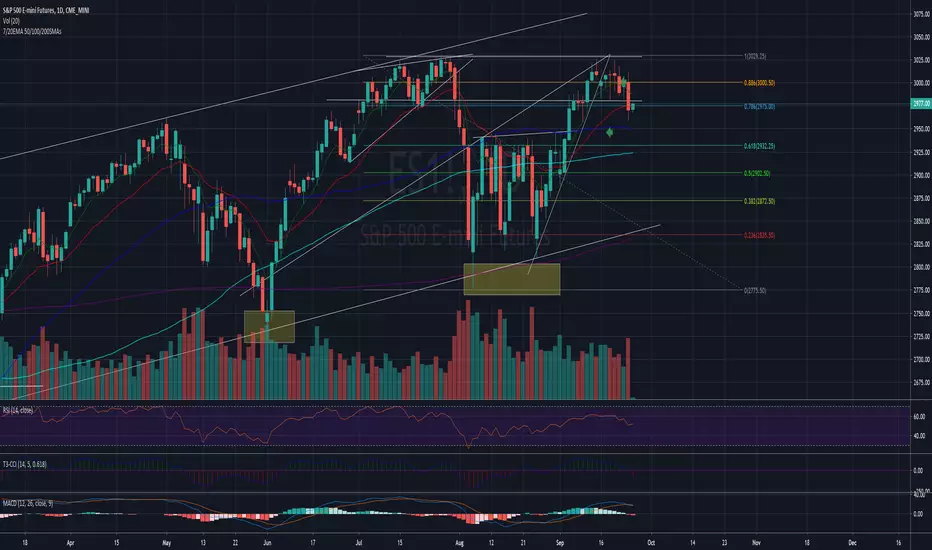
Volume-supported Fractal SRModified version of SynapticEX's Volume-supported Fractal S/R with EMA instead of SMA, pinescript 4 port, and EMA20/EMA50 defaults for support and resistance.
EMA20 = red/green
EMA50 = orange/yellow
