EMA Study Script for Price Action Traders, v2JR_EMA Research Tool Documentation
Version 2 Enhancements
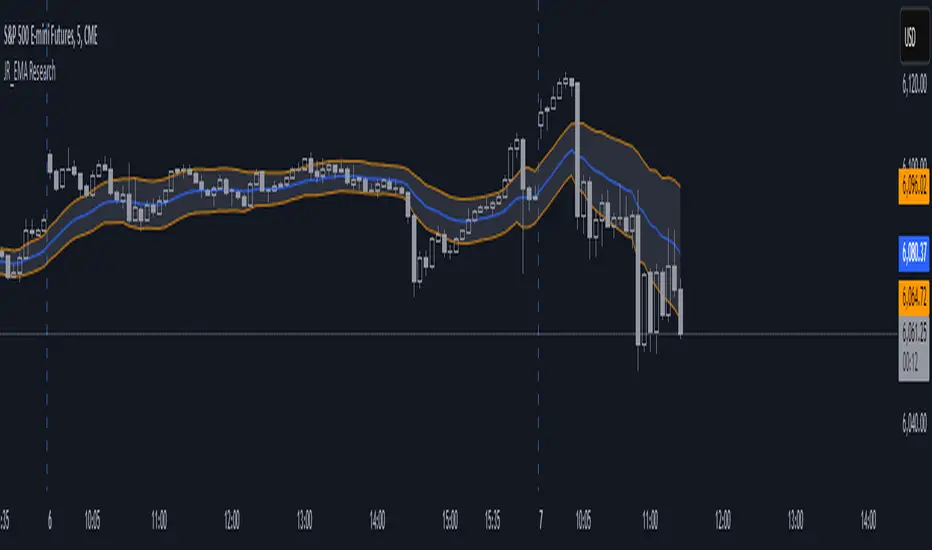
Version 2 of the JR_EMA Research Tool introduces several powerful features that make it particularly valuable for studying price action around Exponential Moving Averages (EMAs). The key improvements focus on tracking and analyzing price-EMA interactions:
1. Cross Detection and Counting
- Implements flags for crossing bars that instantly identify when price crosses above or below the EMA
- Maintains running counts of closes above and below the EMA
- This feature helps students understand the persistence of trends and the frequency of EMA interactions
2. Bar Number Tracking
- Records the specific bar number when EMA crosses occur
- Stores the previous crossing bar number for reference
- Enables precise measurement of time between crosses, helping identify typical trend durations
3. Variable Reset Management
- Implements sophisticated reset logic for all counting variables
- Ensures accuracy when analyzing multiple trading sessions
- Critical for maintaining clean data when studying patterns across different timeframes
4. Cross Direction Tracking
- Monitors the direction of the last EMA cross
- Helps students identify the current trend context
- Essential for understanding trend continuation vs reversal scenarios
Educational Applications
Price-EMA Relationship Studies
The tool provides multiple ways to study how price interacts with EMAs:
1. Visual Analysis
- Customizable EMA bands show typical price deviation ranges
- Color-coded fills help identify "normal" vs "extreme" price movements
- Three different band calculation methods offer varying perspectives on price volatility
2. Quantitative Analysis
- Real-time tracking of closes above/below EMA
- Running totals help identify persistent trends
- Cross counting helps understand typical trend duration
Research Configurations
EMA Configuration
- Adjustable EMA period for studying different trend timeframes
- Customizable EMA color for visual clarity
- Ideal for comparing different EMA periods' effectiveness
Bands Configuration
Three distinct calculation methods:
1. Full Average Bar Range (ABR)
- Uses the entire range of price movement
- Best for studying overall volatility
2. Body Average Bar Range
- Focuses on the body of the candle
- Excellent for studying conviction in price moves
3. Standard Deviation
- Traditional statistical approach
- Useful for comparing to other technical studies
Signal Configuration
- Optional signal plotting for entry/exit studies
- Helps identify potential trading opportunities
- Useful for backtesting strategy ideas
Using the Tool for Study
Basic Analysis Steps
1. Start with the default 20-period EMA
2. Observe how price interacts with the EMA line
3. Monitor the data window for quantitative insights
4. Use band settings to understand normal price behavior
Advanced Analysis
1. Pattern Recognition
- Use the cross counting system to identify typical pattern lengths
- Study the relationship between cross frequency and trend strength
- Compare different timeframes for fractal analysis
2. Volatility Studies
- Compare different band calculation methods
- Identify market regimes through band width changes
- Study the relationship between volatility and trend persistence
3. Trend Analysis
- Use the closing price count system to measure trend strength
- Study the relationship between trend duration and subsequent reversals
- Compare different EMA periods for optimal trend following
Best Practices for Research
1. Systematic Approach
- Start with longer timeframes and work down
- Document observations about price behavior in different market conditions
- Compare results across multiple symbols and timeframes
2. Data Collection
- Use the data window to record significant events
- Track the number of bars between crosses
- Note market conditions when signals appear
3. Optimization Studies
- Test different EMA periods for your market
- Compare band calculation methods for your trading style
- Document which settings work best in different market conditions
Technical Implementation Notes
This tool is particularly valuable for educational purposes because it combines visual and quantitative analysis in a single interface, allowing students to develop both intuitive and analytical understanding of price-EMA relationships.
ابحث في النصوص البرمجية عن "ema"
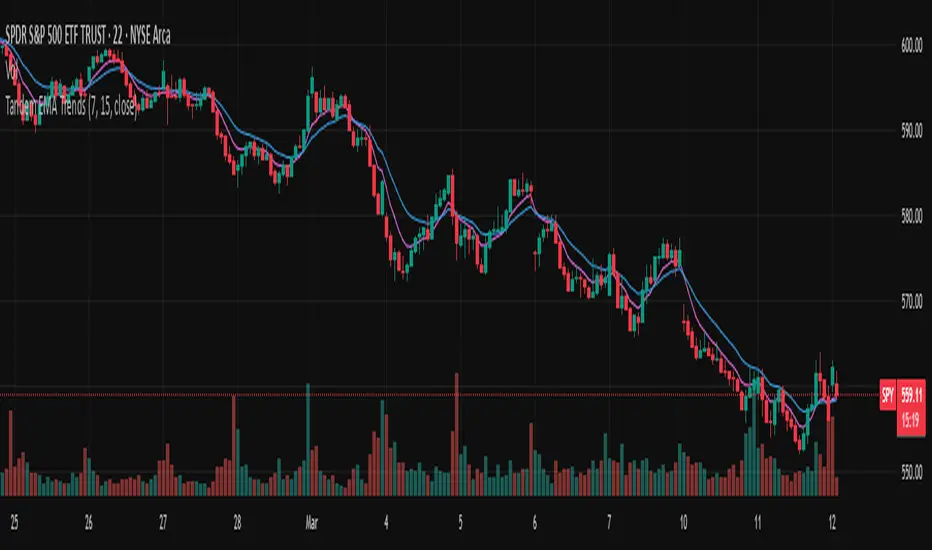
Tandem EMA TrendsThis indicator helps to identify trends using 2 (tandem) EMAs: a fast EMA and a slow EMA. Set the lengths of the EMAs in the inputs (fast EMA should be a smaller number than the slow EMA).
The trend is bullish if the current value of the fast EMA > current value of the slow EMA AND the current value of the fast EMA > the prior bar's value of the fast EMA.
The trend is bearish if the current value of the fast EMA < current value of the slow EMA AND the current value of the fast EMA < the prior bar's value of the fast EMA.
The fast EMA is countertrend to the slow EMA if either of the following 2 conditions exist:
The current value of the fast EMA > current value of the slow EMA AND the current value of the fast EMA < the prior bar's value of the fast EMA (bullish countertrend).
-OR-
The current value of the fast EMA < current value of the slow EMA AND the current value of the fast EMA > the prior bar's value of the fast EMA (bearish countertrend).
Use this script to set custom alerts based off of the current trend like sending webhooks when specific conditions exist.
Customize the colors of the plots.
Adaptive EMA CrossoverIndicator Name: Adaptive EMA Crossover
Description:
The Adaptive EMA Crossover is a sleek, visual tool designed to help traders identify trend direction and potential entry/exit points with clarity. By employing two Exponential Moving Averages (EMAs) with dynamic coloring, it cuts through the noise of the chart, allowing you to focus on high-probability signals.
🔍 Key Features:
Dual EMA System: Utilizes a fast and a slow EMA to gauge market momentum. The default settings are 12 (fast) and 21 (slow) periods, which can be fully customized.
Adaptive Visuals: Both EMAs change color simultaneously to reflect the dominant trend.
🟢 Bright Turquoise: Indicates an Uptrend (Fast EMA >= Slow EMA).
🔴 Bright Pink: Indicates a Downtrend (Fast EMA < Slow EMA).
Clear Crossover Signals: Prominent dots directly on the chart mark the exact moment a crossover occurs.
Turquoise Dot: A Bullish Crossover signal (Fast EMA crosses above Slow EMA).
Pink Dot: A Bearish Crossover signal (Fast EMA crosses below Slow EMA).
Integrated Alerts: Never miss a trading opportunity! Built-in alert conditions notify you instantly for both bullish and bearish crossovers.
🎯 How to Use:
Trend Identification: The primary colors of the EMAs give an immediate sense of the trend. Trade in the direction of the trend for higher-probability setups.
Signal Confirmation: Use the crossover dots as potential triggers for entry or exit. A turquoise dot in a rising market can signal a buy opportunity, while a pink dot in a falling market can signal a sell or short opportunity.
Combination with Other Tools: For best results, combine this indicator with other forms of analysis like support/resistance levels or volume confirmation to filter out false signals.
⚙️ Inputs:
EMA Small: Period for the faster-moving average (default: 12).
EMA Big: Period for the slower-moving average (default: 21).
This is my first published indicator. I welcome all feedback and suggestions for improvement! Happy Trading!

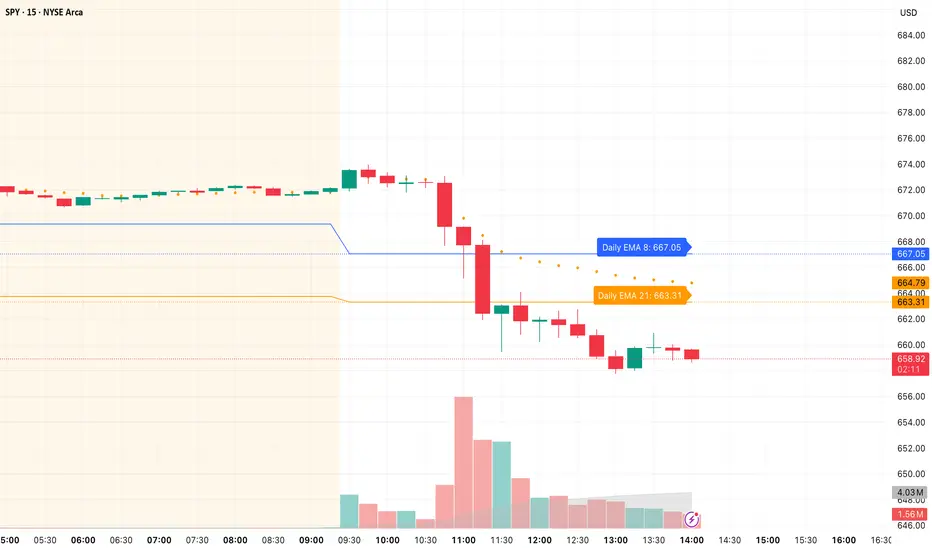
Daily/Weekly EMAs on Lower TimeframesThis indicator allows traders to view Daily and Weekly EMAs (Exponential Moving Averages) directly on lower timeframes such as 1m, 5m, 15m, or 1h charts — providing a higher timeframe perspective without switching charts.
The script includes individual checkboxes for each EMA length — 5, 8, 9, 21, 50, and 200 — organized into two clear sections:
🟢 Daily EMAs
🔵 Weekly EMAs
You can selectively enable or disable any EMA to match your trading style and reduce chart clutter.
Each EMA is color-coded for clarity and consistency:
5 EMA: Green
8 EMA: Blue
9 EMA: Blue
21 EMA: Orange
50 EMA: Purple
200 EMA: Red
Weekly EMAs appear slightly transparent to distinguish them from daily ones.
This makes it easy to visualize higher timeframe trend direction, confluence zones, and dynamic support/resistance levels while trading intraday.
💡 Key Features
View Daily and Weekly EMAs on smaller timeframes.
Individual checkbox toggles for all 6 EMA lengths.
Separate sections for Daily and Weekly EMAs.
Color-coded lines for easy visual recognition.
Works seamlessly on any symbol or timeframe below Daily.
EMA 50/200/100 [NevoxCore]⯁ OVERVIEW
EMA 50/200/100 is a clean EMA trio for trend mapping.
It highlights the classic 50/200 bias, keeps a constant EMA-100 anchor in white, plots cross dots, and can mark the first pullback back to a target EMA within an ATR tolerance.
Solid bias bar coloring (Nevox pink/orange or classic green/red) and compact visuals make it fast and reliable with no repainting.
⯁ HOW IT WORKS
Calculates Fast EMA 50, Slow EMA 200, and an always-on EMA 100 (white).
Bias = Fast vs. Slow: Fast > Slow → long regime; Fast < Slow → short regime.
Cross dots appear at confirmed 50/200 crosses (once per bar close).
First Pullback: after a cross, the script arms a window and marks the first return to the chosen EMA (100 or Fast) within ATR × tolerance.
Bar coloring is solid by regime (pink/orange by default, classic green/red when enabled).
No lookahead; signals confirm on bar close.
⯁ KEY FEATURES
• EMA 50/200 with EMA-100 anchor (always visible, white)
• Cross Up/Down dots (style-configurable)
• First Pullback marker (toggle) with ATR tolerance & window
• Solid bias bar coloring (Nevox or classic)
• Optional bias fill between Fast/Slow
• Minimal 1-cell HUD (OFF by default)
• Ready-made alerts with clean prefixes
⯁ SETTINGS (quick)
Visual: Classic colors toggle; Bias Fill (ON); Fill Transparency (85); Bar Color (solid, ON; auto-disabled when Classic is ON).
Core: Source = Close; EMA Fast = 50; EMA Slow = 200.
Pullback: Show marker (ON); Target EMA = EMA 100; Tolerance × ATR = 0.5; Max Bars After Cross = 40; ATR Length = 14.
HUD: Mini HUD OFF; Position selector.
Status Line: OFF by default (optional EMA values).
⯁ ALERTS (built-in)
• Cross Up (Fast above Slow) — confirmed at bar close
• Cross Down (Fast below Slow) — confirmed at bar close
• First Pullback LONG — first return to target after long cross
• First Pullback SHORT — first return to target after short cross
Prefix: EMA and message includes {{ticker}} {{interval}} @ {{close}}.
Suggested: set TradingView alerts to Once Per Bar Close.
⯁ HOW TO USE
• Read trend quickly: 50 above 200 with a rising 100 = healthy long bias.
• Use the First Pullback to time entries after a cross (default target = EMA 100).
• Tune Tolerance × ATR by symbol/TF; 0.3–0.7 is a good start.
• Keep charts clean: bias fill + barcolor ON; switch to Classic for green/red if preferred.
⯁ WHY IT’S DIFFERENT
It preserves the classic 50/200 logic but adds a consistent EMA-100 anchor, a single, one-shot pullback detector, and clean bias bars — all in a lightweight overlay with no repaint tricks.
⯁ DISCLAIMER
Backtest and paper-trade before using live. Not financial advice. Performance depends on market, timeframe, and parameters.

EMA TrendThe purpose of this script is to identify price trends based on EMAs. The relative position of price to specific EMAs and the position of certain EMAs towards each other are used to determine the trend direction. The script is intended for investors as a tool to define a basis for further evaluation. I do not use the script as a signal generator and would not recommend doing so without the help of additional indicators.
How to work with the script
The major (or long term) trend direction is determined by the 144 EMA much in the same way as the 200 MA is used in other systems. If the price is above the 144 EMA we are in a long term uptrend, below we are in a long term downtrend. This is to be taken with a grain of salt though. The 144 EMA is considerably shorter than the 200 SMA and is more prone to the price fluctuating around it during periods without a strong long term trend. I recommend using this as a confirmation for the short term trend.
The short term trend is derived from the position and slope of the price, the 21 EMA and the 55 EMA. If the price is above the 21 EMA, the 21 above the 55 EMA, both EMAs are sloping upwards and the distance between the two is increasing, we are talking about an uptrend (and vice versa for a downtrend). This is visualized by the color of the fill between the 144 EMA and close price. Green for uptrend, red for downtrend and no color for an undetermined trend.
The EMAs used are: 21 , 34 , 55 , 89 , 144 , 233 . Most of the EMAs are at 50 transparency to appear less dominant. For orientation, the 144 EMA is bright green to indicate its general importance for the trend determination, and the 55 EMAs is not transparent mainly to be able to identify positioning when the EMAs are close together.
Base time frame EMA
The 144 EMA is plotted twice where one is fixed to the daily time frame (can be configured) to be able to have the 144 on different timeframes during analysis. I find this very useful to keep the focus on my main time frame while analyzing trend on lower or higher time frames. This can also be turned off.
Configurability
This script is less configurable than I generally like with my other scripts. The reason is that the title attribute of the plots is not dynamic, and I use the data window often to get exact values from the script to determine buy targets for pullbacks and other things. Hence, I prefer not to have random names (or no names) in there to save mental capacity. If this ever becomes available, I'll gladly add this to this script. Till then, I encourage you to take the script and adjust it to your own needs. It should be simple enough even if you are just starting out in pine.

EMA with time-interval dependant visiblity settingThis scrip exposes 4 Exponential Moving Average (EMA) indicators which their visibility can be set to a daily or weekly time-frame (aka intervals). Based on your current chart time-frame, the matching EMA indicators come on and off.
This helps to have meaningful EMAs relevant to your time internal.
In a traditional 10 EMA indicates a plotted indicator would bear a meaning of a 10 day EMA when in daily and 10 week EMA when in weekly chart which may or may not be useful as some who for example only require a 10 week EMA for thier analysis and wouldn't want to cloud a daily chart with an EMA which won't resemble a valuable output for this particular user.
With EMA+, you can choose to see the 10 week EMA only when your chart is in the weekly time interval, so when switched to a daily interval a 10x EMA is not shown anymore.
If you prefer to see a 10 week EMA and a 21 day EMA on the other hand, you will only have 1 EMA shown when in weekly mode which is a 10 week EMA and one EMA when in daily mode with is 21 day EMA.

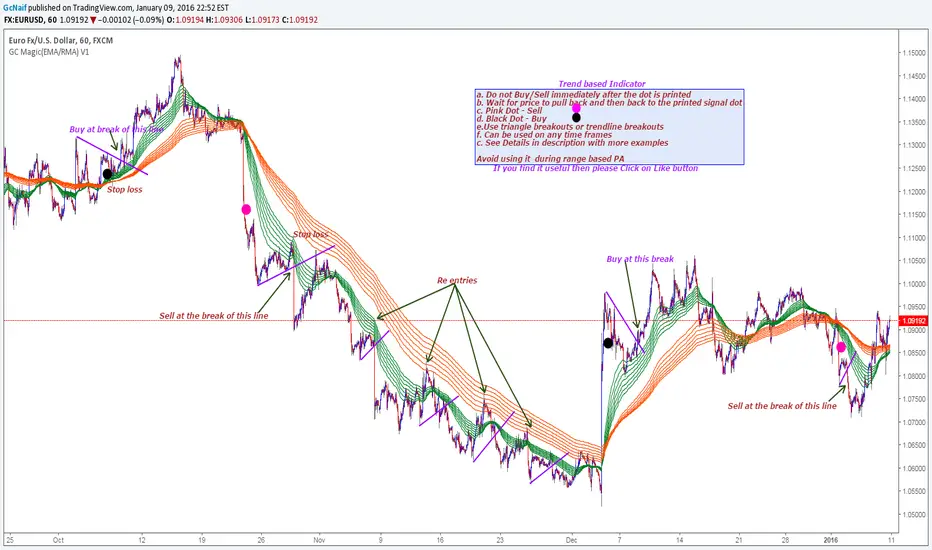
GC Magic(EMA/RMA) V1This is the second script I am posting on TV . This is a Trend based indicator with the option of using it as Exponential Moving Averages or Rsi Moving Averages.The RMA's are giving better signal than the Exponential Moving Averages. The script has the option to select either of them. Works on all time frames. The default options are working good on all time frames.
With the help of Indicator Properties following Options can be changed
a. Type of moving averages for using Guppy method
b. Option to use higher time frame Signal moving average of your choice along with higher time frame
c. Enable or disable to show signal EMA/RMA on chart .
d. Enable or disable to show Guppy EMA/RMA on chart
Indicator Properties:
1. Select to use EMA , Uncheck to use RMA: --> Check to Select EMA based Guppy or Uncheck to use RMA based Guppy
2. Fast EMA/RMA For Cross --> Fast EMA/RMA cross Length
3. Slow EMA/RMA For Cross --> Slow EMA/RMA Length
4. Signal EMA/RMA --> Moving average to use for Signal filters. This moving average will be based on the timeframe u will be selecting below
5. Time interval for Signal EMA/RMA (W, D, ) --> Which time frame moving average you want for the above Signal EMA
6. Do you want to use Signal EMA/RMA for Signals? --> Do you want to use Signal EMA as filter or just the cross of Guppy . Check to use and uncheck for just cross
7. Show Signal EMA on Chart? --> Do you want to display higher timeframe Signal EMA on chart
8. Show Guppy-Slow-Red On Chart? --> Shows/Hides Slow EMA/RMAs
9. Show Guppy-Fast-Green On Chart? --> Shows/Hides Fast EMA/RMAs
Examples:
GbpAud 15m
GbpNzd 1hr
Oil 4hr
AudUSD 1hr
MFI + RSI + EMA Dynamic SignalsThe MFI + RSI + EMA Dynamic Signals is a designed to combine with widened criteria to capture more trading opportunities, it balances momentum, trend, and flexibility, making it suitable for trading on timeframes like 15-minute to 4-hour charts.
How It Works
The indicator uses three technical components with relaxed criteria to produce signals:
Money Flow Index (MFI) for Momentum Extremes:
The MFI, calculated over a 14-period length, measures buying and selling pressure using price and volume. A buy signal can trigger when MFI crosses above the oversold level (default: 30, widened from 20), indicating potential buying pressure, while a sell signal can occur when MFI crosses below the overbought level (default: 70, widened from 80), suggesting selling pressure.
Relative Strength Index (RSI) for Momentum Confirmation:
The RSI, calculated over a 14-period length, confirms momentum strength. Bullish momentum is confirmed when RSI is above a buy threshold (default: 45, relaxed from 50), and bearish momentum when below a sell threshold (default: 55, relaxed from 50), allowing more signals near neutral momentum levels.
Exponential Moving Average (EMA) for Trend Sensitivity:
The indicator uses a fast EMA (default: 9 periods) and a slow EMA (default: 21 periods) to detect trend direction and crossovers. Signals can trigger when the fast EMA crosses the slow EMA, or when the fast EMA is within a proximity threshold (default: 0.5%) of the slow EMA, capturing early trend changes and increasing signal frequency.
Signal Generation
Signals are generated using the previous bar’s values to prevent repainting, with widened criteria for more frequent triggers:
Buy Signal: Either the MFI crosses above the oversold level or the fast EMA crosses above the slow EMA, and either RSI confirms bullish momentum (above 45) or the EMAs are near a crossover (within 0.5%). Displayed as a green upward triangle below the bar.
Sell Signal: Either the MFI crosses below the overbought level or the fast EMA crosses below the slow EMA, and either RSI confirms bearish momentum (below 55) or the EMAs are near a crossover (within 0.5%). Displayed as a red downward triangle above the bar.

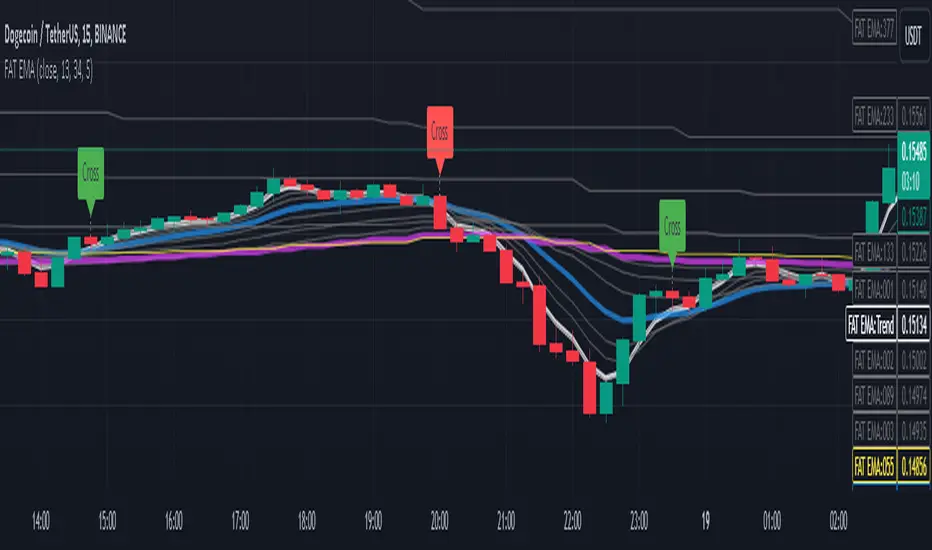
Fibonacci Adaptive Timeframe EMA (FAT EMA)The "Fibonacci Adaptive Timeframe EMA" is a sophisticated trading indicator designed for the TradingView platform, leveraging the power of Exponential Moving Averages (EMAs) determined by Fibonacci sequence lengths to provide traders with dynamic market insights. This indicator overlays directly on the price chart, offering a unique blend of trend analysis, smoothing techniques, and timeframe adaptability, making it an invaluable tool for traders looking to enhance their technical analysis strategy.
Key Features
1. Fibonacci-Based EMA Lengths: Utilizes the Fibonacci sequence to select EMA lengths, incorporating natural mathematical ratios believed to be significant in financial markets. The available lengths range from 1 to 987, allowing for detailed trend analysis over various periods.
2. Multiple Smoothing Methods: Offers the choice between several smoothing techniques, including Simple Moving Average (SMA), Exponential Moving Average (EMA), Smoothed Moving Average (SMMA or RMA), Weighted Moving Average (WMA), and Volume Weighted Moving Average (VWMA). This versatility ensures that users can tailor the indicator to suit their analytical preferences.
3. Timeframe Adaptability: Features the ability to fetch and calculate EMAs from different timeframes, providing a multi-timeframe analysis within a single chart view. This adaptability gives traders a broader perspective on market trends, enabling more informed decision-making.
4. Dynamic Visualization Options: Traders can customize the display to suit their analysis needs, including toggling the visibility of Fibonacci EMA lines, EMA prices, and smoothed EMA lines. Additionally, forecast lines can be projected into the future, offering speculative insights based on current trends.
5. Ema Tail Visualization: An innovative feature allowing for the visualization of the 'tail' or the continuation of EMA lines, which can be particularly useful for identifying trend persistence or reversal points.
6. User-friendly Customization: Through a series of input options, traders can easily adjust the source data, Fibonacci lengths, smoothing method, and visual aspects such as line colors and transparency, ensuring a seamless integration into any trading strategy.
Application and Use Cases
The "Fibonacci Adaptive Timeframe EMA" indicator is designed for traders who appreciate the significance of Fibonacci numbers in market analysis and seek a flexible tool to analyze trends across different timeframes. Whether it's for scalping, day trading, or long-term investing, this indicator can provide valuable insights into price dynamics, trend strengths, and potential reversal points. Its adaptability makes it suitable for various asset classes, including stocks, forex, commodities, and cryptocurrencies.
Gauti Market Maker Killzone EMA1. Identifying the Trend
Use Daily (1D) and Hourly (1H) Exponential Moving Averages (EMAs) to define the overall trend:
Bullish Trend: Both 1D and 1H EMAs are upward sloping, and the price is above these EMAs.
Bearish Trend: Both 1D and 1H EMAs are downward sloping, and the price is below these EMAs.
2. Confirmation with Higher Timeframes
Bullish Conditions:
Check 1D and 4H charts for price action above the EMA bands.
Look for price forming higher highs and higher lows or respecting support at the EMA bands.
Bearish Conditions:
Check 1D and 4H charts for price action below the EMA bands.
Look for price forming lower highs and lower lows or respecting resistance at the EMA bands.
Note: Crossover of EMAs on higher timeframes is an optional extra confirmation, but not mandatory for entry.
3. Entry Strategy
Use the 15-Minute (15M) timeframe for entries.
Entries are taken only during Killzones:
Killzones: London Open, New York Open, or other intraday key trading sessions. (Define the time ranges for these zones based on your trading hours.)
Wait for the price to touch or pull back to the EMA band during the Killzones in the direction of the overall trend:
In a bullish trend, enter long when the price touches the EMA band and shows signs of rejection or reversal.
In a bearish trend, enter short when the price touches the EMA band and shows signs of rejection or reversal.
4. Checklist for Entry
Confirm the following before entering:
1D Trend aligns with the 1H Trend.
Price Action in 1D and 4H supports the trend.
Killzone session is active.
Price is reacting to the EMA band on the 15M chart in the trend direction.

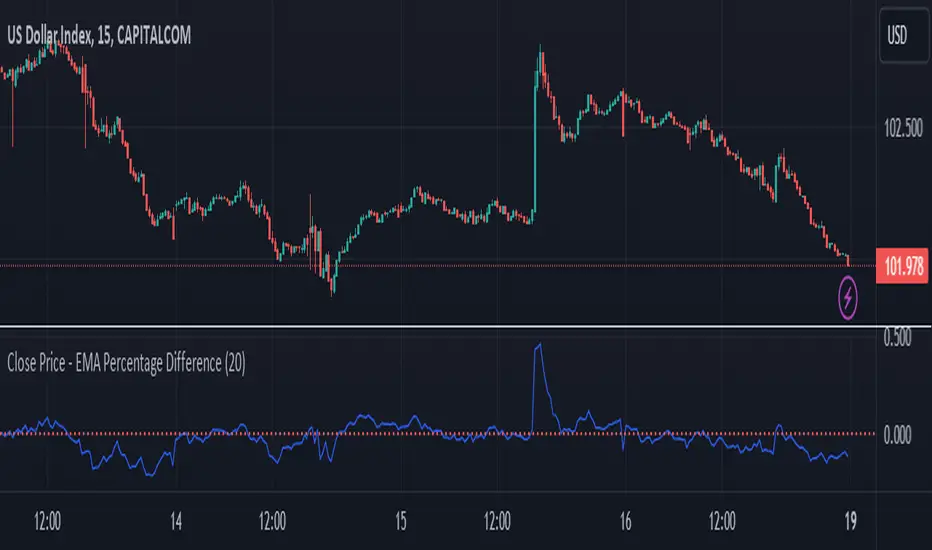
Close Price - EMA Percentage Difference
Title: Close Price - EMA Percentage Difference Indicator
Description:
The Close Price - EMA Percentage Difference Indicator is an essential tool designed to calculate and display the percentage difference between the closing price of a security and its Exponential Moving Average (EMA). This indicator is particularly useful for traders and analysts who want to understand how far the current price is from its EMA, providing insights into potential price trends and reversals.
Key Features:
Customizable EMA Period: Easily adjust the EMA period to match your trading strategy. Whether you're focusing on short-term trends with a 20-period EMA or analyzing long-term trends with a 200-period EMA, this indicator is flexible to suit your needs.
Percentage Difference Calculation: The indicator computes the percentage difference between the closing price and the selected EMA, allowing you to see how much the current price deviates from its moving average in percentage terms. This calculation helps in identifying potential buying or selling opportunities based on price movements relative to the EMA.
Zero Line Reference: A dotted red line at the zero level is included for quick visual reference. This line helps you instantly identify when the closing price is equal to the EMA, and whether the price is above or below the EMA.
Visual Representation: The percentage difference is plotted on a separate panel below the price chart, providing a clear and intuitive visualization that aids in decision-making.
How to Use:
Adjust the EMA period to fit your analysis or trading strategy.
Observe the percentage difference to understand the strength of the current price in relation to the EMA.
Use the zero line as a reference point to determine whether the price is above (positive values) or below (negative values) the EMA, which can help in identifying overbought or oversold conditions.
This indicator is suitable for all types of traders, from day traders to long-term investors, offering valuable insights into the price dynamics relative to the EMA.
Multi-Timeframe EMA Distance & % Change TableDescription of Multi-Timeframe EMA Distance & % Change Table
The Multi-Timeframe EMA Distance & % Change Table indicator is designed to display the distance and percentage change between the current price and the Exponential Moving Averages (EMAs) on multiple timeframes. It creates a table to show these values, with customizable options for decimal precision .
Key Features:
Inputs:
- Timeframes (tf1, tf2, tf3, tf4): User-defined timeframes for EMA calculations (e.g., 1 minute, 15 minutes, daily, etc.).
- EMA Levels (emaLevel, emaLevel2, emaLevel3): User-defined periods for three different EMAs.
EMA Calculations:
- Computes EMAs for the specified levels (50, 100, 200) on each of the user-selected timeframes.
Plotting:
- Plots the EMAs on the chart with distinct colors: Orange, Teal, and Green for different EMAs.
Display Options:
- Checkbox (displayAsPercentage): Allows the user to toggle between displaying distances or percentage changes.
- Decimal Precision:
- decimalPlacesDistance: Specifies the number of decimal places for rounded distance values.
- decimalPlacesPercentage: Specifies the number of decimal places for rounded percentage values.
Table Creation:
- Location: Table is placed in the top-right corner of the chart.
- Headers: Includes columns for each timeframe and EMA distance/percentage.
Distance and Percentage Calculations:
- Distances: Calculated as the difference between the current price and the EMA values for each timeframe.
- Percentages: Calculated as the distance divided by the EMA value, converted to a percentage.
Decimal Rounding:
- Custom Rounding Function: Ensures that distance and percentage values are displayed with the user-specified number of decimal places.
Color Coding:
- Distance Values: Colored green if positive, red if negative.
- Table Entries: Display either the rounded distance or percentage, based on user selection.
Table Update:
- The table is dynamically updated with either distance or percentage values based on the user's choice and rounded to the specified number of decimal places.
This indicator provides a comprehensive overview of EMA distances and percentage changes across multiple timeframes, with detailed control over the precision of the displayed values.

Fibonacci Timeframe Adaptive EMAThe "Fibonacci Timeframe Adaptive EMA" is a sophisticated trading indicator designed for the TradingView platform, leveraging the power of Exponential Moving Averages (EMAs) determined by Fibonacci sequence lengths to provide traders with dynamic market insights. This indicator overlays directly on the price chart, offering a unique blend of trend analysis, smoothing techniques, and timeframe adaptability, making it an invaluable tool for traders looking to enhance their technical analysis strategy.
Key Features
1. Fibonacci-Based EMA Lengths: Utilizes the Fibonacci sequence to select EMA lengths, incorporating natural mathematical ratios believed to be significant in financial markets. The available lengths range from 1 to 987, allowing for detailed trend analysis over various periods.
2. Multiple Smoothing Methods: Offers the choice between several smoothing techniques, including Simple Moving Average (SMA), Exponential Moving Average (EMA), Smoothed Moving Average (SMMA or RMA), Weighted Moving Average (WMA), and Volume Weighted Moving Average (VWMA). This versatility ensures that users can tailor the indicator to suit their analytical preferences.
3. Timeframe Adaptability: Features the ability to fetch and calculate EMAs from different timeframes, providing a multi-timeframe analysis within a single chart view. This adaptability gives traders a broader perspective on market trends, enabling more informed decision-making.
4. Dynamic Visualization Options: Traders can customize the display to suit their analysis needs, including toggling the visibility of Fibonacci EMA lines, EMA prices, and smoothed EMA lines. Additionally, forecast lines can be projected into the future, offering speculative insights based on current trends.
5. Ema Tail Visualization: An innovative feature allowing for the visualization of the 'tail' or the continuation of EMA lines, which can be particularly useful for identifying trend persistence or reversal points.
6. User-friendly Customization: Through a series of input options, traders can easily adjust the source data, Fibonacci lengths, smoothing method, and visual aspects such as line colors and transparency, ensuring a seamless integration into any trading strategy.
Application and Use Cases
The "Fibonacci Timeframe Adaptive EMA" indicator is designed for traders who appreciate the significance of Fibonacci numbers in market analysis and seek a flexible tool to analyze trends across different timeframes. Whether it's for scalping, day trading, or long-term investing, this indicator can provide valuable insights into price dynamics, trend strengths, and potential reversal points. Its adaptability makes it suitable for various asset classes, including stocks, forex, commodities, and cryptocurrencies.

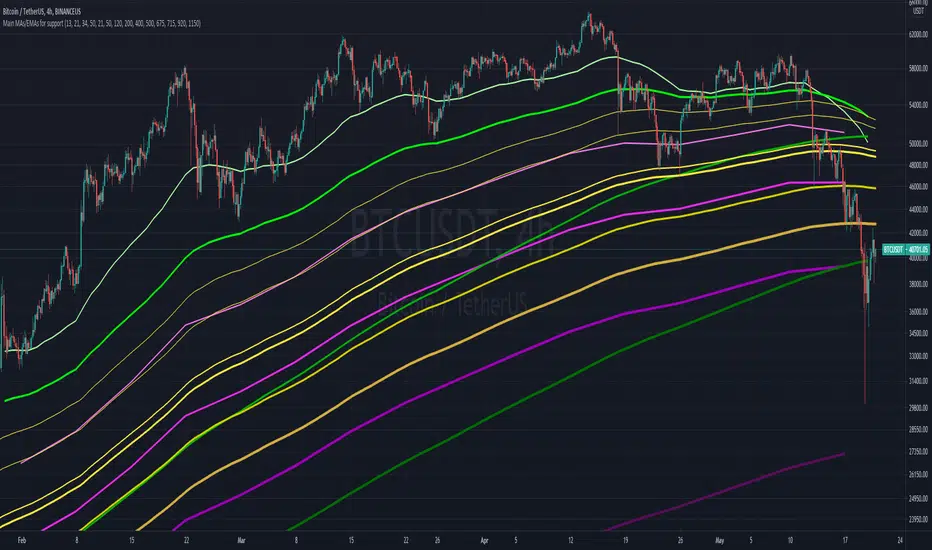
Main MAs and EMAs multi-timeframe for supportObjective is to map out different multi-timeframe support/resistance , all at once. Includes weekly, daily and 4H EMAs and MAs, as per the follow (allowing customization)
WEEKLY (in pink/purple variations):
- 13 EMA
- 21 EMA
- 34 EMA
- 50 M.A
DAILY (in green variations):
- 21 EMA
- 50 EMA
- 120 M.A.
- 200 M.A.
4H (in yellow/golden colors):
- 400 EMA
- 500 EMA
- 675 EMA
- 715 EMA
- 920 EMA
- 1150 EMA
Notes:
- Quite useful to all types of assets; crypto, commodities , stocks, etc...
- Ideally not to be visible all the time, as it can "pollute" the charts. But very helpful in moments of great volatility
EMA CrossoversUseful for identifying and receiving alerts about uptrends and downtrends.
This script uses two Exponential Moving Averages (EMAs) to find price uptrends and downtrends. An Exponential Moving Average (EMA) is a type of moving average that places a greater weight and significance on the most recent data points. The script produces uptrend and downtrend signals based on crossovers and divergences between the two EMAs, the user will be able to spot a trend change (when the EMAs crossover) and to determine the strength of the current trend (when the EMAs diverge). It is also posible to get alerts for uptrends and downtrends on the web and mobile app with sound and pop-ups as well as via email. The optimal time to enter and exit the market can be concluded from this trend changes.
The user can set their own EMAs, by default they are set to 21 and 55 periods for medium and long term respectively. When the medium term EMA crosses below the long term EMA the asset is in a downtrend and the price will decline, and when the medium term EMA crosses above the long term EMA the asset is in an uptrend and price will increase.
This scripts plots the following indicators and signals on the chart to help the user to identify trends:
1.- Medium and long term EMAs as lines overlaid on the price chart.
2.- Up green triangles above bars when the price is on an uptrend and down red triangles below bars when the price is on a downtrend.
3.- Arrows with text to indicate the start of an uptrend or downtrend.
The user can enable and disable the indicators and signals as well as set colors and shapes to their liking.
This script also lets the user create alerts for uptrends and downtrends. To create a new alert using this script follow this instructions:
1.- Once you added this script to your chart, go to the alerts panel (right on web or bottom tool bar on the mobile app) and add a new alert (alarm clock icon with a plus sign).
2.- A modal window will open. On the “Condition” dropdown menu select “EMA Crossovers”.
3.- On the next dropdown menu (right below the “Condition” one) you can select from two types of alerts “Uptrend started” and “Downtrend started”.
4.- Lastly you can set all the normal alert options and create the alert.

ORBs, EMAs, AVWAPThis Pine Script (version 6) is a multi-session trading indicator that combines Opening Range Breakouts (ORBs), Exponential Moving Averages (EMAs), and an Anchored VWAP (AVWAP) system — all in one overlay script for TradingView.
Here’s a clear breakdown of its structure and functionality:
🕒 1. Session Logic and ORB Calculation
Purpose: Identify and plot the high and low of the first 30 minutes (default) for the Tokyo, London, and New York trading sessions.
Session Anchors (NY time):
Tokyo → 20:00
London → 03:00
New York → 09:30
(All configurable in inputs.)
ORB Duration: Default is 30 minutes (orbDurationMin), also user-configurable.
Resets:
London and NY ORBs reset at the start of each new New York trading day (17:00 NY time).
Tokyo ORB resets independently using a stored timestamp.
Process:
For each session:
While the time is within the ORB window, the script captures the session’s high and low.
Once the window closes, those levels remain plotted until reset.
Plot Colors:
Tokyo → Yellow (#fecc02)
London → Gray (#8c9a9c)
New York → Magenta (#ff00c8)
These form visible horizontal lines marking the prior session ranges — useful for breakout or retest trading setups.
📈 2. EMA System
Purpose: Provide trend and dynamic support/resistance guidance.
It calculates and plots four EMAs:
EMA Period Color Purpose
EMA 9 Short-term Green Fast signal
EMA 20 Short-term Red Confirms direction
EMA 113 Medium Aqua Trend filter
EMA 200 Long-term Orange Macro trend baseline
Each EMA is plotted directly on the price chart for visual confluence with ORB and VWAP levels.
⚖️ 3. Anchored VWAP (AVWAP)
Purpose: Display a volume-weighted average price anchored to specific timeframes or events, optionally with dynamic deviation or percentage bands.
Features:
Anchor Options:
Time-based: Session, Week, Month, Quarter, Year, Decade, Century
Event-based: Earnings, Dividends, Splits
VWAP resets when the chosen anchor condition is met (e.g., new month, new earnings event, etc.).
Bands:
Up to three levels of symmetric upper/lower bands.
Choose between Standard Deviation or Percentage-based widths.
Display Toggles:
Each band’s visibility is optional.
VWAP can be hidden on 1D+ timeframes (hideonDWM option).
Color Scheme:
VWAP: Fuchsia (magenta-pink) line
Bands: Green / Olive / Teal with light-filled zones
⚙️ 4. Technical Highlights
Uses ta.vwap() with built-in band calculations.
Handles instruments with or without volume (errors if missing volume).
Uses time-zone aware timestamps (timestamp(NY_TZ, …)).
Uses timeframe.change() to detect new anchors for the VWAP.
Employs persistent variables (var) to maintain session state across bars.
💡 In Practice
This indicator is designed for multi-session intraday traders who:
Trade Tokyo, London, or NY open breakouts or retests.
Use EMA stacking and crossovers for trend confirmation.
Use Anchored VWAP as a fair-value or mean-reversion reference.
Need clear visual structure across different market sessions.
It provides strong session separation, trend context, and volume-weighted price reference — making it ideal for discretionary or semi-systematic trading strategies focused on liquidity zones and session momentum.

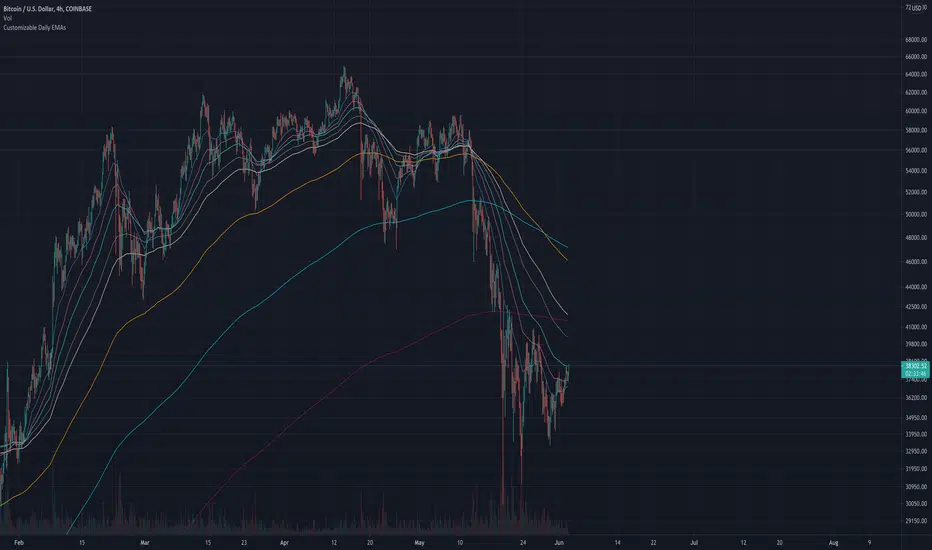
Customizable Daily EMAs (up to 8)This indicator provides you with up to 8 different EMAs that are customizable.
You can specify how many EMAs you want on the chart (up to a maximum of 8), as well as the length and color of each EMA. In addition, the resolution of all EMAs can also be customized - by default all EMAs follow the Daily timeframe but you could set this to any timeframe you want or you could choose for it to follow the timeframe chart as most other EMA Indicators do.
The reason for creating this indicator is because I was looking for Daily EMAs, but wanted to view the chart in a different time period without the EMA lines themselves changing. In addition, I wanted to view ample EMAs at once, and have the ability to change their length as I see fit.
You can see this demonstrated on the 4-hour chart above. Despite the chart being a 4 hourly chart, the EMAs are Daily EMAs.
In the example above all 8 EMAs have been activated, but you could turn any of these off to suit your own preferences.
The default EMAs are set to the following: 20, 50, 100, 200, 5, 9, 13, 26.
The First 4 are ideal for longer-term targets, while the smaller timeframes are more suited to short-term trading targets.
I have made this script Open-source for anybody to view, copy and modify if they need.
EMA CloudThe EMA Crossover Cloud is a clean and intuitive indicator that combines two Exponential Moving Averages (EMA) into a visual cloud.
Key features:
Cloud visualization: The space between EMA A and EMA B is shaded, making the current trend direction easier to identify.
Crossover signals: A clear LONG signal is plotted when EMA A crosses above EMA B, and a SHORT signal when EMA A crosses below EMA B.
Bar coloring: Candles are automatically colored according to the trend (uptrend, downtrend, or neutral).
Customizable colors: Cloud, signals, and bars can all be customized to match your chart style.
Alerts ready: Built-in alerts for EMA crossovers (LONG/SHORT).
Status label: A compact label shows the current cloud trend state in real time.
This indicator is ideal for traders who prefer simple and reliable crossover signals combined with a clear trend visualization. It works on any timeframe or asset.

Dynamic EMA Stack Support & ResistanceEvery trader needs reliable support and resistance — but static zones and lagging indicators won't cut it in fast-moving markets. This script combines a Fibonacci-based 5-EMA stacking system and left/right pivots that create dynamic support & resistance logic to uncover real-time structural shifts & momentum zones that actually adapt to price action. This isn’t just a mashup — it’s a complete built-from-the-ground-up support & resistance engine designed for scalpers, intraday traders, and trend followers alike.
🧠 🧠 🧠What It Does🧠 🧠 🧠
This script uses two powerful engines working in sync:
1️⃣ EMA Stack (5-EMA Framework)
Built on Fibonacci-based lengths: 5, 8, 13, 21, 34, (configurable) this stack identifies:
🔹 Bullish Stack: EMAs aligned from fastest to slowest (uptrend confirmation)
🔹 Bearish Stack: EMAs aligned inversely (downtrend confirmation)
🟡 Narrowing Zones: When EMAs compress within ATR thresholds → possible breakout or reversal zone
🎯 Labels identify key transitions like:
✅"Begin Bear Trend?"
✅"Uptrend SPRT"
✅"RES?" (resistance test)
2️⃣ Pivot-Based Projection Engine
Using classic Left/Right Bar pivot logic, the script:
📌 Detects early-stage swing highs/lows before full confirmation
📈 Projects horizontal S/R lines that adapt to market structure
🔁 Keeps lines active until a new pivot replaces them
🧩 Syncs beautifully with EMA stack for confluence zones
🎯🎯🎯Key Features for Traders🎯🎯🎯
✅ Trend Detection
→ EMA order reveals real-time bias (bullish, bearish, compression)
✅ Dynamic S/R Zones
→ Historical support/resistance levels auto-draw and extend
✅ Smart Labeling
→ “SPRT”, “RES”, and “Trend?” labels for live context + testing logic
✅ Custom Candle Coloring
→ Choose from Bar Color or Full Candle Overlay modes
✅ Scalper & Swing Compatible
→ Use fast confirmations for scalping or stack consistency for longer trends
⚙️⚙️⚙️How to Use⚙️⚙️⚙️
✅Use Top/Bottom (trend state) Line Colors to quickly read trend conditions.
✅Use Pivot-based support/resistance projections to anticipate where price might pause or reverse.
✅Watch for yellow/blue zones to prepare for volatility shifts/reversals.
✅Combine with volume or momentum indicators for added confirmation.
📐📐📐Customization Options📐📐📐
✅EMA lengths (5, 8, 13, 21, 34) — fully configurable - try 21,34,55, 89, 144 for longer term trend states
✅Left/Right bar pivot settings (default: 21/5)
✅Label size, visibility, and color themes
✅Toggle line and label visibility for clean layouts
✅“Max Bars Back” to control how deep history is scanned safely
🛠🛠🛠Built-In Safeguards🛠🛠🛠
✅ATR-based filters to stabilize compression logic
✅Guarded lookback (max_bars_back) to avoid runtime errors
✅Works on any asset, any timeframe
🏁🏁🏁Final Word🏁🏁🏁
This script is not just a visual tool, it’s a complete trend and structure framework. Whether you're looking for clean trend alignment, dynamic support/resistance, or early warning labels, this system is tuned to help you react with confidence — not hindsight.
Rembember, no single indicator should be used in isolation. For best results, combine it with price action analysis, higher-timeframe context, and complementary tools like trendlines, moving averages etc Use it as part of a well-rounded trading approach to confirm setups — not to define them alone.
💡💡💡Turn logic into clarity. Structure into trades. And uncertainty into confidence.💡💡💡

EMA+ATR Band MTF Trend EntryThis is a Multi-Timeframe Trend Trading indicator strategy adapted from Sahil Rohmehtra’s Mentorship programme. The trading decision is made by first accessing the trend in higher timeframe (say Monthly) by using TWO EMAs. If the faster EMA (say 20 period) is above Slower EMA (say 50 period) and the price is above slower EMA then the trend is suitable for buyers. Similarly if faster EMA is below slow EMA and the price is below that then trend is suitable for sellers.
Once we access the trend in the higher timeframe we move to the lower timeframe (say Weekly) and access the 5-period RSI value. If RSI is below 30 then we can prepare for possible buy entry in lower (Daily) timeframe if entry conditions are met in daily timeframe. Similarly sell bias can be initiated when the higher timeframe EMA trend is down, daily RSI is above 70 and sell entry condition is met in daily timeframe. The RSI thresholds can be changed by the user.
Once we identified the RSI bias then wait for the confirmation candle in the lower timeframe (say 1 hour). In the entry timeframe we plot a band of 20 EMA of LOWs ± 1 ATR lines. Here,we wait for a candle to close above the 20 EMA of LOWs + 1 ATR for a buy signal with an increase in On Balance Volume (OBV) value. Similarly for sell signal we should get a candle close below the 20 EMA of LOWs - 1 ATR with corresponding change in OBV. This candle is the signal candle.
Once we get a Buy or Sell signal the corresponding stop loss is the nearest LOW - 1 ATR or HIGH + 1 ATR. The ATR scaling may be changed by the user. Now if another candle closes above the high of the buy signal candle then enter on buy. If the low of the buy signal candle is broken then it is a potential short-term sell entry. Similarly if another candle closes below the sell signal candle then enter short and if there is a close above high of the signal candle then it is a potential buy entry.

EMA Trend Dashboard
Trend Indicator using 3 custom EMA lines. Displays a table with 5 rows(position configurable)
-First line shows relative position of EMA lines to each other and outputs Bull, Weak Bull, Flat, Weak Bear, or Bear. EMA line1 should be less than EMA line2 and EMA line 2 should be less than EMA line3. Default is 9,21,50.
-Second through fourth line shows the slant of each EMA line. Up, Down, or Flat. Threshold for what is considered a slant is configurable. Also added a "steep" threshold configuration for steep slants.
-Fifth line shows exhaustion and is a simple, configurable calculation of the distance between EMA line1 and EMA line2.
--Lines one and five change depending on its value but ALL other colors are able to be changed.
--Default is somewhat set to work well with Micro E-mini Futures but this indicator can be changed to work on anything. I created it to help get a quick overview of short-term trend on futures. I used ChatGPT to help but I am still not sure if it actually took longer because of it.

Color Change EMA 200 (4H)200 Color Change EMA (4H Locked)
Overview
This indicator displays a 200-period Exponential Moving Average (EMA) that is locked to the 4-hour timeframe, regardless of what chart timeframe you're currently viewing. The EMA line changes color dynamically based on price action to provide clear visual trend signals.
Key Features
• Multi-Timeframe Capability : Always shows the 4H 200 EMA on any chart timeframe
• Dynamic Color Coding :
- Green: Price is above the 200 EMA (bullish condition)
- Red: Price is below the 200 EMA (bearish condition)
• Clean Visual Design : Bold 2-pixel line width for clear visibility
• Real-time Updates : Colors change instantly as price crosses above or below the EMA
How to Use
1. Add the indicator to any timeframe chart
2. The 4H 200 EMA will appear as a smooth line
3. Watch for color changes:
- When the line turns green, it indicates price strength above the key moving average
- When the line turns red, it suggests price weakness below the moving average
4. Use for trend identification, support/resistance levels, and entry/exit timing
Best Practices
• Combine with other technical analysis tools for confirmation
• Use the color changes as alerts for potential trend shifts
• Consider the 200 EMA as a major support/resistance level
• Works well for swing trading and position sizing decisions
Settings
• Length : Default 200 periods (customizable)
• Source : Default closing price (customizable)
Perfect for traders who want to keep the important 4H 200 EMA visible across all timeframes with instant visual trend feedback.
