ابحث في النصوص البرمجية عن "ema"

EMA Spread OscillatorEMA Spread Oscillator
Quickly see past levels where diff maxed out. Momentum and price can only keep going up for so long. This obviously differs per underlying asset. So that is where this oscillator comes in handy.
Of course you can see on the chart how far apart the moving averages are, but it is easier to spot on an oscillator.
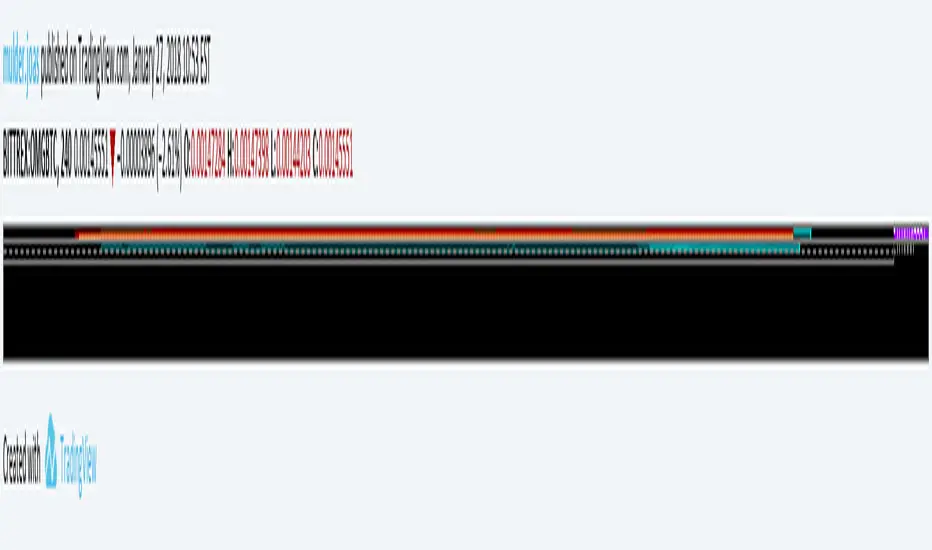

EMA 1-377. The points of intersection of lines EMA 1-377. The points of intersection of lines - elements of the Fibonacci sequence


EMA DifferenceThis is a custom script initially invented by Thomas Bierovic. It is a difference between opening and closing prices and it gives a good understanding of trend strength.


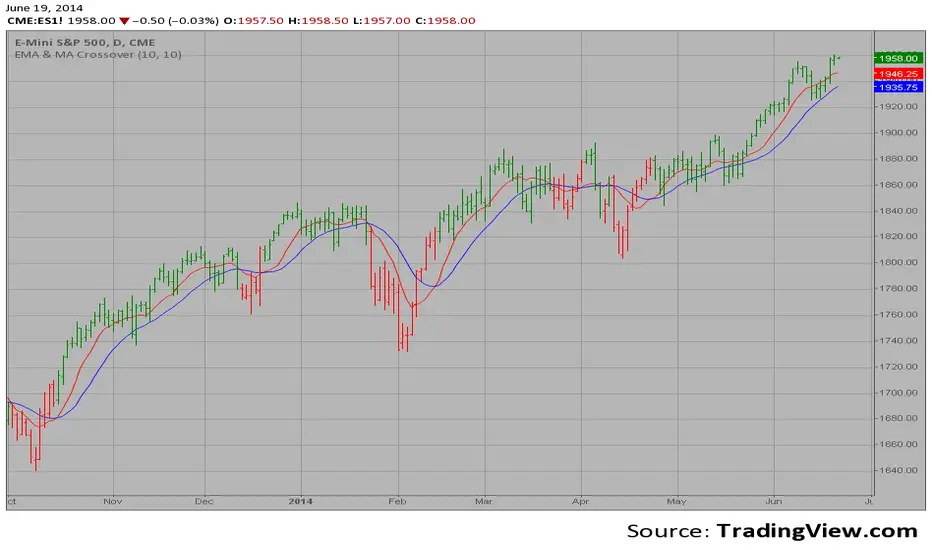
EMA & MA Crossover The Moving Average Crossover trading strategy is possibly the most popular
trading strategy in the world of trading. First of them were written in the
middle of XX century, when commodities trading strategies became popular.
This strategy is a good example of so-called traditional strategies.
Traditional strategies are always long or short. That means they are never
out of the market. The concept of having a strategy that is always long or
short may be scary, particularly in today’s market where you don’t know what
is going to happen as far as risk on any one market. But a lot of traders
believe that the concept is still valid, especially for those of traders who
do their own research or their own discretionary trading.
This version uses crossover of moving average and its exponential moving average.
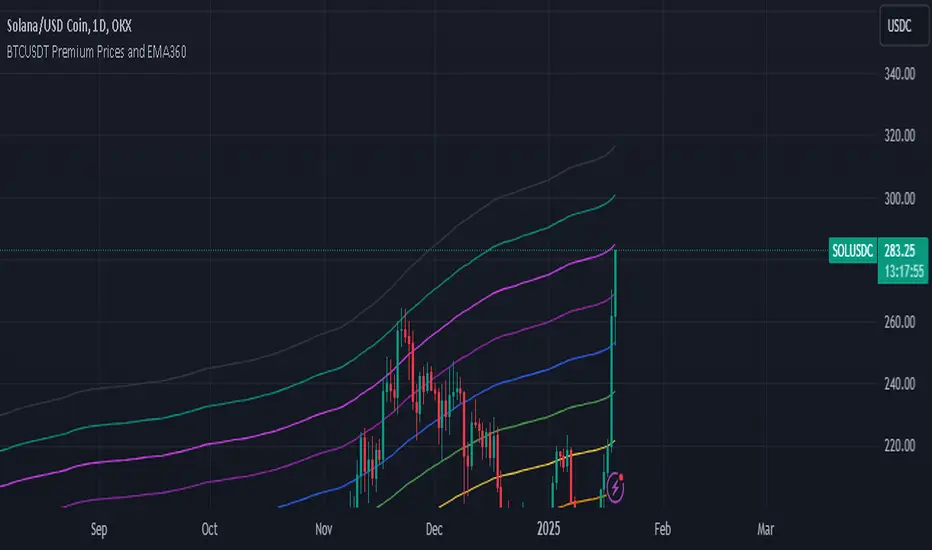
BTCUSDT Premium Prices and EMA360The Exponential Moving Average (EMA) is a widely used technical indicator in trading that helps analysts and traders identify price trends over a specified period. Unlike the Simple Moving Average (SMA), which treats all data points equally, the EMA gives more weight to recent prices, making it more sensitive to recent price movements. This characteristic allows the EMA to react quickly to changes in market conditions, providing timely insights into potential trends.
## **Key Features of EMA**
- **Weighting Mechanism**: The EMA uses a smoothing factor that emphasizes recent price data while still considering older observations. This leads to a more dynamic representation of price trends compared to the SMA .
- **Trend Identification**: The EMA is particularly effective for identifying the direction of a stock's price movement. A rising EMA indicates an uptrend, while a declining EMA suggests a downtrend. Traders often use multiple EMAs with different periods to spot crossovers, which can signal potential buy or sell opportunities .
- **Calculation**: To calculate the EMA, one typically starts with an initial Simple Moving Average (SMA) for the first period, then applies the following formula for subsequent periods:
$$
\text{EMA}_{\text{today}} = \left(\text{Price}_{\text{today}} \times \left(\frac{2}{N + 1}\right)\right) + \left(\text{EMA}_{\text{yesterday}} \times \left(1 - \frac{2}{N + 1}\right)\right)
$$
Where $$N$$ is the number of periods .
## **Applications in Trading**
Traders utilize the EMA in various strategies, including:
- **Crossover Strategies**: By monitoring two EMAs of different lengths (e.g., 50-day and 200-day), traders can identify bullish or bearish signals when one crosses above or below the other .
- **Combining Indicators**: The EMA can be combined with other indicators like the Relative Strength Index (RSI) or Moving Average Convergence Divergence (MACD) for enhanced decision-making .
In summary, the Exponential Moving Average is a crucial tool for traders seeking to navigate market trends effectively. Its ability to prioritize recent data makes it an essential component of many trading strategies, providing insights that can lead to informed investment decisions.
Buy Sell SignalBuy Sell Signal - EMA Crossover with Dynamic Risk Management
OVERVIEW
This indicator combines a dual EMA crossover system with ATR-based dynamic stop loss and take profit levels to provide complete trade management signals. Unlike basic EMA crossover scripts, this tool automatically calculates and displays entry points, stop losses, and take profit targets based on market volatility, offering traders a complete trading framework in a single indicator.
HOW IT WORKS
The indicator uses three core components working together:
Trend Detection: A fast EMA (default 5) and slow EMA (default 13) identify trend direction. When the fast EMA crosses above the slow EMA, it signals bullish momentum; when it crosses below, it signals bearish momentum.
Entry Validation: Optional candle confirmation filter ensures the crossover is accompanied by a bullish/bearish candle close, reducing false signals in choppy markets.
Risk Management: Uses ATR (Average True Range, default 14 periods) to calculate:
Stop Loss: Positioned below/above recent swing low/high minus ATR multiplier (default 0.5x)
Take Profit: Calculated using customizable risk-reward ratio (default 3:1)
KEY FEATURES
✅ Automatic Position Tracking: Monitors active trades and displays current position status (LONG/SHORT/No position)
✅ Visual Trade Management: Shows entry price (white dashed line), stop loss (red line), and take profit (green line) in real-time
✅ Trade Outcome Signals: Displays clear markers when TP is hit (🎯), SL is triggered (❌), or position is invalidated by opposite signal
✅ Information Dashboard: Live table showing entry price, SL, TP, and actual R:R ratio
✅ Smart Position Invalidation: Automatically closes and invalidates previous positions when opposite trend signal appears
✅ Customizable Alerts: Five alert conditions for BUY/SELL signals, TP hits, SL triggers, and invalidations
INPUTS
Fast EMA Length (default 5): Responsive to recent price action
Slow EMA Length (default 13): Defines broader trend direction
ATR Period (default 14): Volatility measurement period
SL Multiplier (default 0.5): Distance from swing point to stop loss
Risk:Reward Ratio (default 3.0): Target profit relative to risk
Candle Confirmation (default ON): Requires bullish/bearish candle on crossover
HOW TO USE
Apply the indicator to your chart (works on all timeframes)
Adjust EMA periods based on your trading style (shorter for scalping, longer for swing trading)
Set your preferred risk-reward ratio
Enable alerts for automated notifications
When a BUY/SELL signal appears, the indicator automatically calculates and displays your complete trade plan
Monitor the information table for live position updates
Exit when TP is reached or SL is triggered
TRADING METHODOLOGY
This script implements a momentum-following strategy based on exponential moving average crossovers, enhanced with volatility-adjusted risk parameters. The ATR-based stop loss adapts to market conditions—wider stops in volatile markets, tighter stops in calm markets. The position invalidation feature prevents traders from holding outdated positions when market sentiment shifts.
BEST PRACTICES
Use on trending markets for best results
Higher timeframes (4H, Daily) produce fewer but more reliable signals.
For scalpe use 5 and 15 minutes(Risk).
Consider market context and fundamental factors alongside signals
Adjust ATR multiplier based on asset volatility
Test different EMA combinations for your preferred instruments
ORIGINALITY
While EMA crossover systems are common, this script's value lies in its complete integration of entry logic, dynamic risk management, position tracking, and automated invalidation—features typically requiring multiple separate indicators. The ATR-based stop loss calculation and automatic R:R visualization provide practical trade execution guidance that basic crossover indicators lack.
Important Notes:
This indicator does not guarantee profitable trades
Always practice proper risk management
Backtest settings on historical data before live trading
Past performance does not indicate future results

Naresh CE with 13 62 crossThank you to Lauris, for sharing knowledge and logic for the EMA cross-over (13/62).
The provided Pine Script is a custom script, which is designed to display Chandelier Exit levels on the price chart and generate buy and sell labels based on specific conditions.
Here's a breakdown of the key components and logic of the Pine Script:
Exponential Moving Averages (EMAs):
ema1: The 13-period Exponential Moving Average (EMA) of the closing price.
ema2: The 62-period Exponential Moving Average (EMA) of the closing price.
EMA Plotting:
The script plots the ema1 (13 EMA) and ema2 (62 EMA) lines on the price chart using the plot() function.
Chandelier Exit Calculation:
The Chandelier Exit values are calculated using the Average True Range (ATR).
The script calculates the atr (Average True Range) using the atr() function with the given length.
longStop is calculated as the highest price of the specified length minus the ATR, and shortStop is calculated as the lowest price plus the ATR.
Directional Indicator (dir):
The dir variable is used to determine the direction of the Chandelier Exit based on the comparison of the current close price with the previous long and short stops.
Buy and Sell Signals:
The script generates buy signals when the Chandelier Exit direction changes from short to long (buySignal).
Similarly, sell signals are generated when the Chandelier Exit direction changes from long to short (sellSignal).
The conditions for buy and sell signals are based on the value of dir and its previous value.
Buy and Sell Labels:
Buy and sell labels are plotted on the chart using plotshape() based on the generated buy and sell signals.
The showLabels input parameter controls whether to display the buy and sell labels.
Highlighting States:
The script fills the chart area with color (green for long, red for short) based on the direction of the Chandelier Exit values.
The highlightState input parameter controls whether to apply this highlighting.
Alerts:
The script includes alert conditions based on the direction change (changeCond), buy signal (buySignal), and sell signal (sellSignal) using the alertcondition() function.
The script aims to help traders identify potential buy and sell signals based on the Chandelier Exit levels derived from the 13 EMA and 62 EMA crossovers. The Chandelier Exit values can serve as dynamic stop-loss levels for long and short positions.

GC Magic Overlay V2This script is based on Guppy method (www.guppytraders.com
) , it was introduced to me by fellow trader @nmike. I am using this script in conjunction to Clones ,Harmonic and other tools.
Script Function:
a. Script plots the fast and slow Exponential moving averages as ribbons.
EMA's used
EMA (close): 25,30,35,40,45,50,55 (Green)
EMA (close): 89,99,109,119,129,139,149 (Red)
b. It draws the Circle dots in Pink for Sell and Black for Buy.
Script Parameters:
a. EMA : 2 emas for cross
b. Signal Exponential moving average
c. which time frame to Plot the above Signal Exponential
d. Show Guppy Slow - Red - Toggle to show red emas on chart
e. Show Guppy Fast - Green- Toggle to show green emas on chart
How to Trade:
a. Wait for the Pink/Black Dot to appear on Chart
b. Do not take trade immediately after the dot appears. Wait for the price to retrace back and touch the ema ribbons.This will keep you away from fake breakouts.
c. Rentries : in examples below
Examples:

GBPUSD Weekly Cross LinesThis indicator tracks 20/50 EMA crossovers on GBPUSD (Weekly timeframe) and displays the crossover points across all symbols and timeframes, allowing traders to visually align current price action with key historical turning points in GBPUSD.
The script works by detecting bullish (20 EMA crossing above 50 EMA) and bearish (20 EMA crossing below 50 EMA) signals since 2010, using request.security() to source data from GBPUSD weekly candles, even if the indicator is applied to AAPL, EURJPY, BTCUSD, or any other asset.
Each crossover is marked with a vertical line that persists across all charts, offering a powerful way to:
Compare current market context with GBPUSD’s historical trend shifts
Observe intermarket correlations
Align trading timing across multiple assets
Spot macro trend transitions that ripple across global markets

EMA X/Y🔍 EMA X/Y Indicator Description
This indicator combines two different EMA ( Exponential Moving Average ) values into a single script, allowing you to visualize both short-term and long-term trends on the same chart.
📌 X: First EMA length (typically for short-term trends)
📌 Y: Second EMA length (typically for long-term trends)
🎯 Purpose:
– Track overall trend direction and potential reversals
– Generate buy/sell signals based on EMA X and Y crossovers
– Analyze market momentum across timeframes

hayatguzel curveENG
When the support resistance study is performed on the hayatguzel indicator, we see that these levels, which are actually horizontal in hayatguzel, are curvilinear when they are plotted on the chart, this is because the hayatguzel indicator uses moving average EMAs.
We can understand the chart more easily by shaping the resulting table in hayatguzel indicator in our minds more easily and seeing these horizontal levels in hayatguzel as curvilinear on the graph.
Let me explain what needs to be done with an example:
The indicator value on top of the yellow box is 13.58 and below of the yellow box of the hayatguzel indicator 5.83. The curves that will occur when we add these values to the hayatguzel curve indicator are shown in green. With the same logic, if we want to see this level, which is the upper blue resistance box on the hayatguzel indicator and coincides with the 67 level, on the graph, we enter 67 for both of the coefficients in the hayatguzel curve indicator. ( Which ema is used in hayatguzel, the same ema value must be entered in hayatguzel curve, ema200 is used in this example )
The result is that the hg curves drawn in green act as support and when the upward movement comes, the hg curve drawn in blue now passes through the 2700s. In other words, we can see that the position is in support and where its target is.
I'd like to show all this in one hayatguzel indicator, but pinescript doesn't make it possible. That's why I had to write this code separately.
TR
Hayatguzel indikatöründe destek direnç çalışması yapıldığında aslında hayatguzel'de yatay olan bu seviyelerin grafiğe atıldığında eğrisel olduğunu görüyoruz, bunun nedeni hayatguzel indikatörünün hareketli ortalama olan ema'ları kullanmasıdır.
Hayatguzel indikatöründeki ortaya çıkan tabloyu kafamızda daha rahat şekillendirmek ve hayatguzel'de yatay olan bu seviyeleri grafik üzerinde eğrisel olarak görerek grafiğe daha çok hakim olabiliriz.
Yapılması gereken şeyi bir örnekle anlatayım:
Hayatguzel indikatöründeki sarı kutunun üstünde indikatör değeri 13.58 ve altında 5.83. Biz bu değerleri hayatguzel curve indikatörüne eklediğimiz zaman oluşacak eğriler yeşil ile gösterildi. Aynı mantıkla hayatguzel indikatöründeki üstteki mavi direnç kutusu olan ve 67 seviyesine denk gelen bu seviyeyi grafikte görmek istiyorsak hayatguzel curve indikatöründeki katsayıların ( coefficient ) ikisine de 67'yi giriyoruz. ( hayatguzel'de hangi ema kullanıldıysa hayatguzel curve'de de aynı ema değeri girilmeli, bu örnekte ema200 kullanıldı )
Burdan ne sonuç çıkıyor peki ?
Çıkan sonuç yeşil ile çizilen hg eğrilerinin destek görevi gördüğü ve yukarı doğru hareket geldiğinde mavi ile çizilen hg eğrisinin şu an 2700 lerden geçtiğidir. Yani hem pozisyonun destekte olduğunu hem de hedefinin neresi olduğunu görebiliyoruz.
Bütün bunları tek bir hayatguzel indikatörünün içinde göstermek isterdim ama pinescript bunu mümkün kılmıyor. O nedenle bu kodu ayrı olarak yazmak zorunda kaldım.

System 20/8You can decide to trade with this very simple scenario. This system consists of 2 exponential moving averages ( EMA ) These are Ema 8 and Ema 20.
Recommended period is 4 hours.
When 8 Ema is above 20 Ema , positive zone and may be safer to trade. And the opposite is negative when it is.
This indicator is of course not a sufficient reason to decide on trading. It can only be one of the signals to guide.

EMA21The indicator includes 5x the EMA, which can be freely selected. The default settings are 5 min, 10 min, 15 min, 1 h, and 4 h. If a candle crosses an EMA, the wick of the candle is longer than that of the EMA, and if the candle body is above the EMA, it indicates a buy or sell accordingly.

Dekkapok Premium Prices and EMA360Overview:
The EMA360 Premium Levels indicator is designed to help traders identify key price levels above the EMA360 (Exponential Moving Average) on a daily timeframe. These levels, referred to as "premium levels" are calculated as multiples of the EMA360 and can act as potential resistance or support zones for price action analysis.
Features:
EMA360 Calculation:
The script calculates the EMA360 using the daily timeframe (or any user-specified timeframe).
EMA360 is plotted as a bold blue line for clear visibility.
Premium Levels:
Multiple levels above the EMA360 are plotted as horizontal green lines.
These levels are calculated by multiplying the EMA360 value by user-defined multipliers (e.g., 1.2x, 1.3x, etc.).
Premium levels can help identify overbought or extended price zones relative to EMA360.
Customizable Inputs:
EMA Length: Default is set to 360, but users can adjust the EMA length as needed.
Timeframe: EMA360 is calculated using the daily timeframe by default, but any timeframe can be selected.
Multipliers: Traders can input their desired multipliers (e.g., 1.2, 1.3, 1.5) as a comma-separated list.
Clean Visualization:
EMA360 and premium levels are plotted directly on the price chart for intuitive analysis.
Premium level lines are semi-transparent green to minimize clutter while maintaining focus on critical levels.
Use Cases:
Trend Analysis: Use the EMA360 to identify the broader market trend. Prices above the EMA360 generally indicate an uptrend, while prices below may indicate a downtrend.
Overextension Zones: Premium levels help traders identify zones where the price may be overbought or overextended relative to EMA360.
Dynamic Support/Resistance: The premium levels can act as dynamic resistance zones during uptrends and support zones during pullbacks.
How to Use:
Apply the indicator to your chart in TradingView.
Observe the EMA360 line to understand the market trend.
Use the green premium level lines to identify potential resistance zones as the price moves above the EMA360.
Customization Options:
Adjust the EMA Length and Timeframe to match your trading style.
Modify the Premium Multipliers to suit your market analysis needs (e.g., add or reduce levels like 1.1x, 1.8x, etc.).
This indicator is especially useful for trend-following traders who want to leverage EMA-based levels for strategic decision-making.
- Dekkapok

Dekkapok Premium Prices and EMA360 [Clean Ver.]Overview:
The EMA360 Premium Levels indicator is designed to help traders identify key price levels above the EMA360 (Exponential Moving Average) on a daily timeframe. These levels, referred to as "premium levels" are calculated as multiples of the EMA360 and can act as potential resistance or support zones for price action analysis.
Features:
EMA360 Calculation:
The script calculates the EMA360 using the daily timeframe (or any user-specified timeframe).
EMA360 is plotted as a bold blue line for clear visibility.
Premium Levels:
Multiple levels above the EMA360 are plotted as horizontal green lines.
These levels are calculated by multiplying the EMA360 value by user-defined multipliers (e.g., 1.2x, 1.3x, etc.).
Premium levels can help identify overbought or extended price zones relative to EMA360.
Customizable Inputs:
EMA Length: Default is set to 360, but users can adjust the EMA length as needed.
Timeframe: EMA360 is calculated using the daily timeframe by default, but any timeframe can be selected.
Multipliers: Traders can input their desired multipliers (e.g., 1.2, 1.3, 1.5) as a comma-separated list.
Clean Visualization:
EMA360 and premium levels are plotted directly on the price chart for intuitive analysis.
Premium level lines are semi-transparent green to minimize clutter while maintaining focus on critical levels.
Use Cases:
Trend Analysis: Use the EMA360 to identify the broader market trend. Prices above the EMA360 generally indicate an uptrend, while prices below may indicate a downtrend.
Overextension Zones: Premium levels help traders identify zones where the price may be overbought or overextended relative to EMA360.
Dynamic Support/Resistance: The premium levels can act as dynamic resistance zones during uptrends and support zones during pullbacks.
How to Use:
Apply the indicator to your chart in TradingView.
Observe the EMA360 line to understand the market trend.
Use the green premium level lines to identify potential resistance zones as the price moves above the EMA360.
Customization Options:
Adjust the EMA Length and Timeframe to match your trading style.
Modify the Premium Multipliers to suit your market analysis needs (e.g., add or reduce levels like 1.1x, 1.8x, etc.).
This indicator is especially useful for trend-following traders who want to leverage EMA-based levels for strategic decision-making.
- Dekkapok
