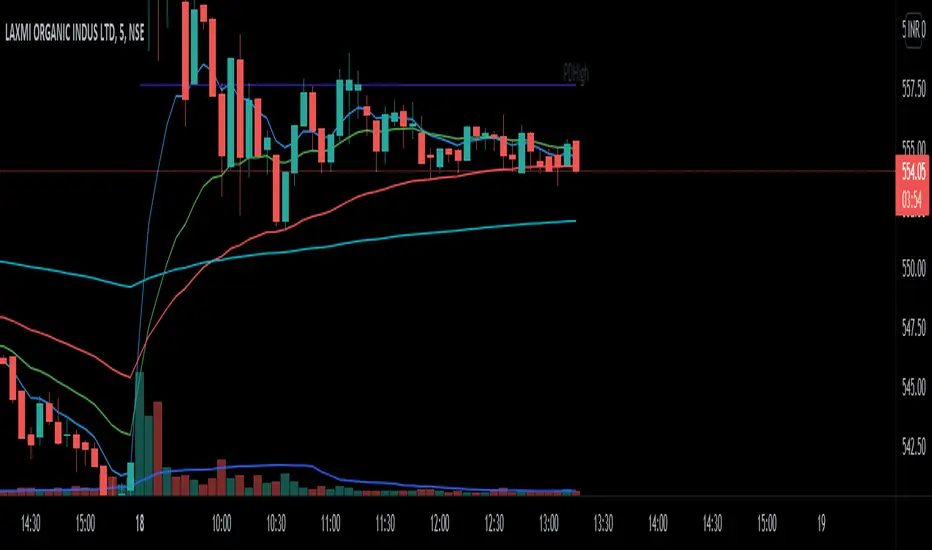
RVC_DecisionPoints By RishabhThe script is a combination of moving averages and previous day low and previous day high.
It can be used for intraday trading and as well as swing trades.
For using intraday I prefer 8 ema and 20 ema to take trades and trail stop losses with 50ema and 200 ema for confirmation.
For swing trades you can always use 50 ema as support to buy on the dip.
The entry is made on the basis of the stock breaks the previous day high or previous day low.
ابحث في النصوص البرمجية عن "ema"
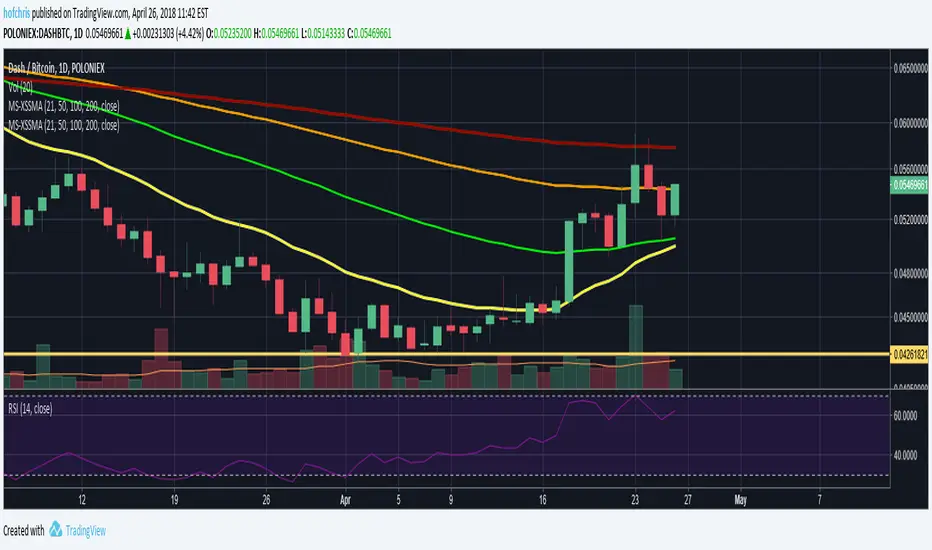
Altcoin Spring// ============================== ABOUT THIS SCRIPT ==================================
// By @paul108. Based on original idea about EMAs from @MuroCrypto.
// This script tries to time when altcoins might be about to pump after hitting big lows.
// It aims for a higher winrate rather than being definitive.
// It's not for timing entries on your favourite coin. It's for flipping coins that you don't care about.
// It doesn't give exits. Use support/resistance levels. Make sure to take profit.
// It was tested by eye in May 2019.
// It's for 4H on Binance alts in bullish conditions, and may not work very well in any other conditions.
//
// Circles: green means a significant move (of price crossing the slow EMA) up, red, down.
// A green circle indicates a market entry on the next candle with a stop at the medium EMA.
// A grey circle indicates an entry that matched the primary EMA conditions but not secondary tests.
// It's less likely to work out, but who knows.
// Vertical bars: An additional optional indicator: classic 8,21 EMA cross; green up, red down.
// Stop loss: A horizontal line indicates a potential place to put your stop.
// Use recent lows, support, and common sense here, especially with low-sat coins
//
// Use the indicator with confluence of your favourite technical indicators, patterns, and volume.
// If you lose money, it's on you. If you make money, be cool and pay something forward.
// ====================================================================================

Meister Shredder - Exponential Moving Averages x44 exponential moving eaverages
contains
21 ema
50 ema
100 ema
200 ema
colors could be better ;)
Displaced Moving Average ExponentialJust a Displaced EMA .
Plots EMA ahead a chosen time periods as DiNapoli explained in the 4th chapter of "Trading With DiNapoli Levels".
It's a simple tweak of existing ema function

Trade Secrets by Pratik - Dual Intraday StrategyThe "Trade Secrets by Pratik" strategy is a high-momentum, dual-direction trading system designed to capture explosive moves after brief market pullbacks. It relies on a rigorous combination of trend-following moving averages and a strength filter.
1. Core Concept
The strategy identifies "Clean Pullbacks"—brief pauses in a strong trend where the price stays strictly away from the short-term average (10 EMA). This indicates extreme momentum, as buyers (in an uptrend) or sellers (in a downtrend) are too aggressive to allow a deeper correction.
2. Technical Filters
Trend Direction: Price must be above both 10 and 35 EMAs for Buys, and below both for Sells.
Strength Filter (RSI): Requires an RSI > 60 for Longs (to ensure high demand) and RSI < 40 for Shorts (to ensure heavy selling pressure).
3. Trade Execution
The Setup: Look for a "Floating Candle"—a Red candle for Buys or a Green candle for Sells that does not touch the 10 EMA.
The Trigger: A trade is entered only if the very next candle breaks the "Setup Candle's" high (Buy) or low (Sell).
Risk-Reward: Aim for a fixed 1:3 Ratio, ensuring that one winner covers three losing trades.
4. Safety Logic
The system includes a "No-Same-Candle-Exit" rule, preventing the script from triggering a Stop Loss on the same bar as the Entry. This filters out immediate price "whipsaws" and ensures the trade has room to develop.


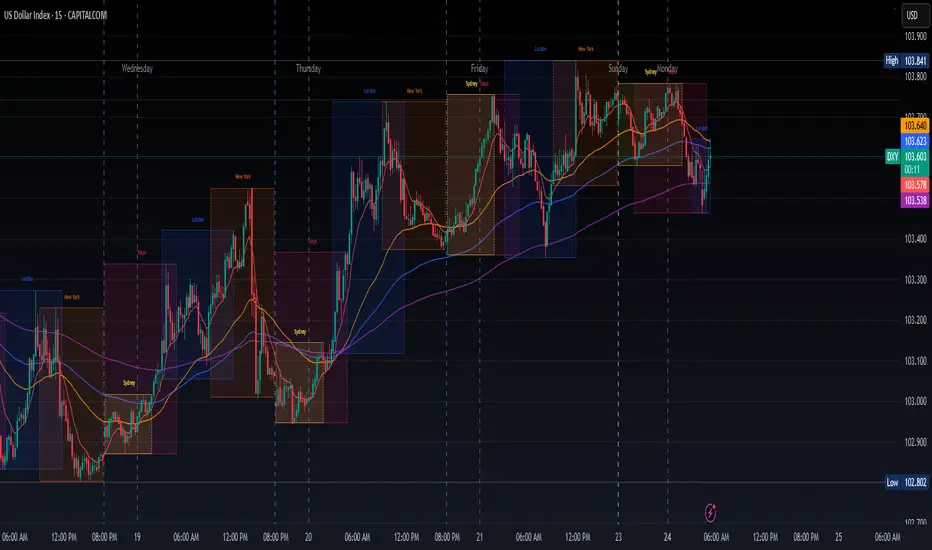
wosabi Investment assistant and Swing trading CRYPTOThis indicator works to calculate the exponential moving average (EMA) of three symbols. The first is the symbol shown on the chart in front of you, the second is for Bitcoin (it can be changed), and the third is the dollar strength index (DXY), which can be changed.
- The indicator calculates the exponential average of more than one symbol that you choose from the settings
When one of the lines appears in green, this means that the exponential average (EMA) is positive. Each line represents a different value for the averages that can be changed from the default settings to any other appropriate value.
Every five lines represent the averages of the symbol, and the three symbols are separated by a dashed white line to differentiate between the indicators of the three symbols.
Note: The colors have been changed inversely for the third symbol (dxy). When the averages are positive, the color will be red, and if they are negative, the color will be green, as the current settings are suitable for encrypted digital currency symbols that interact inversely with the Dollar Strength Index, and the colors can be changed from the indicator’s settings.
Integrating the values of the three symbols into the Relative Strength Index, which can be changed according to the leading symbols that influence positively or negatively, and this varies from one market to another to give a clearer indication when the negative symbol rises or falls and affects the rest of the symbols.
The current settings are suitable for the digital currency market, and the symbols must be changed for the rest of the markets
Note: The second symbol is the positive influence and the third symbol is the negative influence


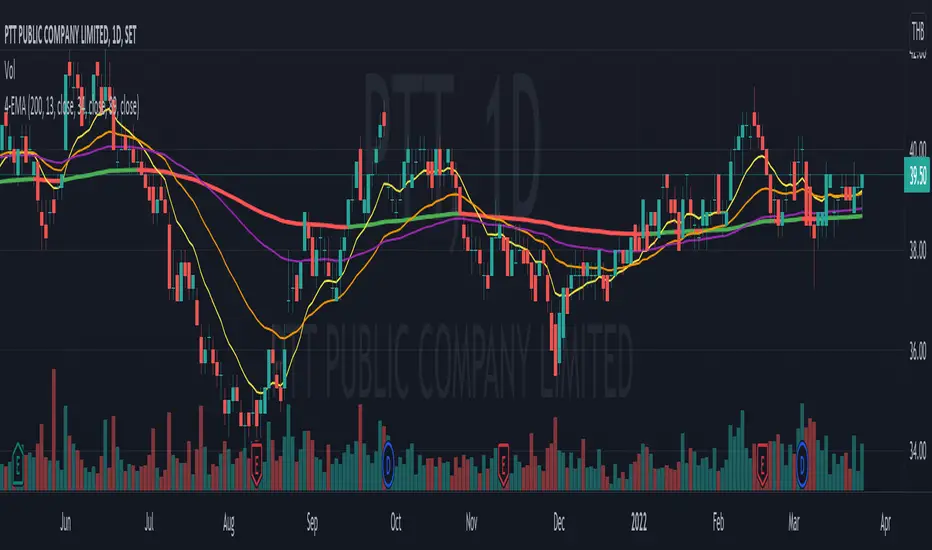
4EMA Alert4 EMA lines as per @Philakone EMA Cross strategy created by @Nuovibusiness with ability to add alert when there is bullish or bearish cross.

XEMAFixed Base 4 EMA
Choose base interval, default Daily
Adjust periods for up to 4 emas, default 9 20 50 200

EMA50_233 crossThis simple script works as indicator based on crossing EMA with length 50 an EMA with lenght 233. It shows good results on trendindg markets with 15m-1H plots.

GRaB CandlesUpdate to previous script.
Raghee Horners Wave and GRaB candles. Now show/hide the EMA "Wave". Paints candles according to close position relative to ema on high, low and close. Buy blue sell red.

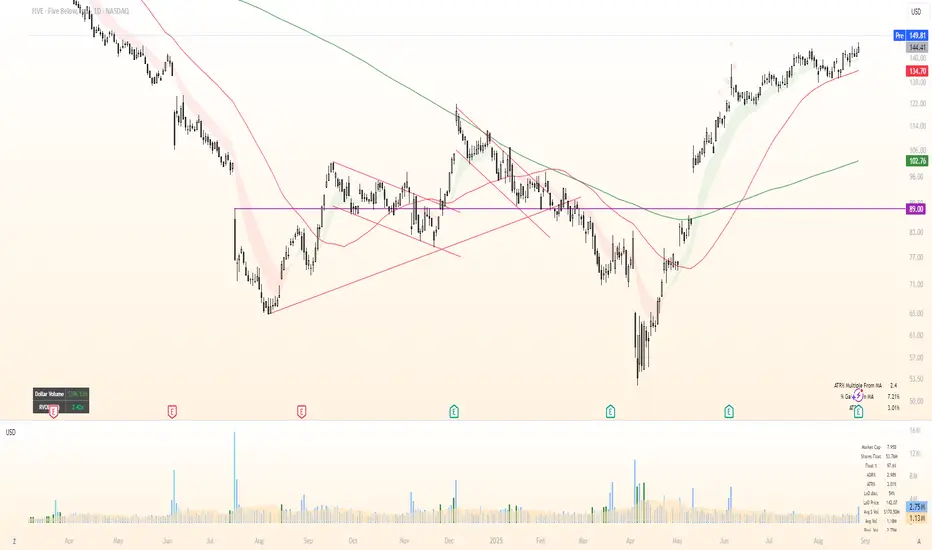
BornInvestor MA CloudsBornInvestor MA Clouds
The BornInvestor MA Clouds script is a powerful, multi-layered moving average cloud system designed to help traders visualize market trends, momentum shifts, and crossover signals in a clear, intuitive way.
🔑 Features
Up to 5 customizable MA Clouds
Choose between SMA or EMA for each moving average.
Flexible input sources (Close, Open, High, Low, etc.).
Adjustable lengths for full control over short-, medium-, and long-term trend analysis.
Dynamic Cloud Coloring
Clouds automatically change color to reflect bullish or bearish momentum.
Customizable transparency and color schemes for each cloud.
Crossover Signals
Visual triangle markers appear when faster MAs cross above/below slower MAs.
Bullish crossovers are shown below bars, bearish crossovers above bars.
Alerts Ready 🚨
Built-in alert conditions for bullish and bearish crossovers (Cloud 1).
Alerts trigger once per bar for cleaner signals.
Clean Visuals
Option to show/hide individual MA lines.
Lightweight design optimized for clarity on any chart.
📊 How to Use
Clouds act as dynamic support/resistance zones. Price above the cloud signals bullish momentum, while price below the cloud signals bearish conditions.
Crossover signals help identify potential trend reversals or entry points.
Use multiple clouds (short, medium, long-term) for multi-timeframe confluence.
⚠️ Disclaimer
This script is for educational purposes only and not financial advice. Always combine with your own research and risk management before trading.
CRUCE EMA200/EMA365 + RETEST Created by our community member Gian from cryptobytez. This indicator shows you when the 200 and 365 EMA cross


Saturns Rings5 EMAs in One Indicator
Recommended Settings:
Fibonacci Series (Default): 8, 21, 34, 55, 89
Standard: 10, 20, 50, 100, 20

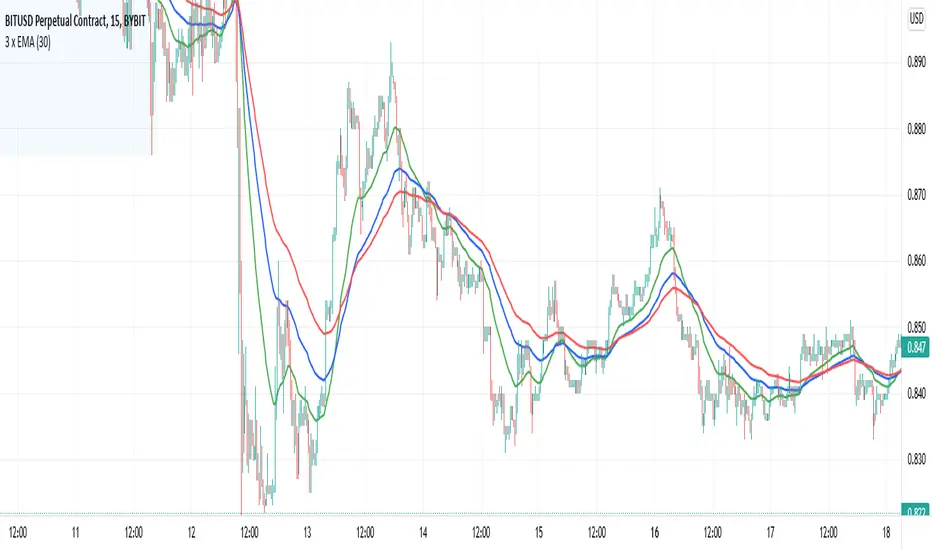
3 x EMAExponential Moving Averages
The indicator plots three moving averages.
The settings specify the period for the first moving average.
The period for the second moving average is considered as the period for the first one multiplied by 2.
The period for the third moving average is considered as the period for the first one multiplied by 3.
MA with a short period - green
MA with an average period - blue
MA with a long period - red
Экспоненциальные скользящие средние
Индикатор строит три скользящие средние.
В настройках указывается период для первой скользящей средней.
Период для второй скользящей считается как период для первой умноженной на 2.
Период для третьей скользящей считается как период для первой умноженной на 3.
Скользящая с коротким периодом - зеленая
Скользящая со средним периодом - синяя
Скользящая с длинным периодом - красная
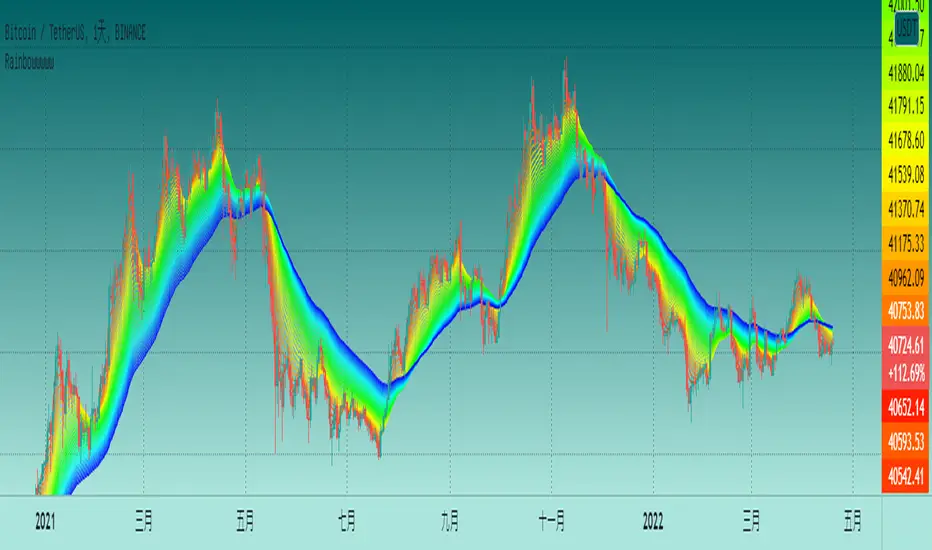
Colorful RainbowBasically this script is only for visual appeal purposes. This script consists of multiple ema moving average lines, where the shortest time is 2 bars while the longest is 68 bars.
This script is for pure entertainment. You are advised NOT to use it to assist yourself in making financial/investment decisions.
4 Moving Averages4 EMAs indicators, I use these for daily time frame. Please feel free to explore. Comments are invited.
Quad-EMAThis indicator allows you to setup four Exponential Moving Averages onto your chart and control their lengths and colors from the same indicator


MA DifferenceA simple Moving Average cross-over indicator using EMA's. Works on all time frames. It's best if the cross-over occurs on the candle sticks as opposed to well above or well below; by then it may be too late. Hope its useful to someone. And as always, use in context of price action and observe support and resistance areas.
