Multiple EMA/SMA v6This indicator plots up to eight Exponential Moving Averages (EMAs) and six Simple Moving Averages (SMAs) on the same chart.
Each moving average can be individually customized or disabled by setting its length to 0.
It’s designed for traders who want to visually compare multiple EMAs and SMAs with consistent styling and color-coding.
Key features:
Displays up to 14 customizable EMAs/SMAs.
Adjustable line width and source (e.g., close, open, hlc3).
Simple and performance-optimized structure.
Clean color scheme for quick trend identification.
Usage:
Set any moving average length to 0 to hide it, or adjust lengths and colors to match your strategy.
Ideal for identifying short-, mid-, and long-term trend alignments.
ابحث في النصوص البرمجية عن "ema"

Anrazzi - EMAs/ATR - 1.0.2Description:
The Anrazzi - EMAs/ATR indicator is a versatile tool for technical traders looking to monitor multiple moving averages alongside the Average True Range (ATR) on any chart. Designed for simplicity and customization, it allows traders to visualize up to six moving averages with configurable type, color, and length, while keeping real-time volatility information via ATR directly on the chart.
This indicator is perfect for spotting trends, identifying support/resistance zones, and gauging market volatility for intraday or swing trading strategies.
Key Features:
Supports up to six independent moving averages (MA1 → MA6)
Each MA is fully customizable:
Enable/disable individually
Type: EMA or SMA
Length
Color
ATR Display:
Custom timeframe
Color and position configurable
Adjustable multiplier
Compact and organized settings for easy configuration
Lightweight and efficient code for smooth chart performance
Watermark
Inputs / Settings:
MA Options: MA1 → MA6 (Enable/Disable, Type, Length, Color)
Additional Settings: ATR (Enable, Timeframe, Color, Multiplier)
How to Use:
Enable the moving averages you want to track
Configure type, length, and color for each MA
Enable ATR if needed and adjust settings
Watch MAs plotted dynamically and ATR in bottom-right corner
Recommended For:
Day traders and swing traders
Trend-following strategies
Volatility analysis and breakout detection
Traders needing a compact multi-MA dashboard

All-in-One EMA & BBThis script combines Bollinger Bands and multiple EMAs into one powerful tool. It includes:
1) Bollinger Bands with customizable MA type and colors.
2) EMA 21 on Daily and Weekly timeframes.
3) EMA 21, 50, 100, 200 on current chart timeframe.
4) Toggle options for each indicator for a clean, flexible view.
Ideal for traders seeking multi-timeframe trend analysis and volatility insights.

VIX Filter/RSI/EMA Bias/Cum-TICK w/ Exhaustion Zone DashboardThis all-in-one dashboard gives intraday traders a real-time visual read of market conditions, combining volatility regime, trend bias, momentum exhaustion, and internal strength — all in a fully customizable overlay that won’t clutter your chart.
📉 VIX Market Regime Detector
Identifies "Weak", "Normal", "Volatile", or "Danger" market states based on customizable VIX ranges and symbol (e.g., VXN or VIX).
📊 RSI Momentum Readout
Displays real-time RSI from any selected timeframe or symbol, with adjustable length, OB/OS thresholds, and color-coded exhaustion alerts.
📈 EMA Trend Bias Scanner
Compares fast and slow EMAs to define bullish or bearish bias, using your preferred timeframe, symbol, and EMA lengths — ideal for multi-timeframe setups.
🧠 Cumulative TICK Pressure & Exhaustion Engine
Analyzes internal market strength using cumulative TICK data to classify conditions as:
-Strong / Mild Bullish or Bearish Pressure
-Choppy / No Edge
-⚠️ Exhaustion Zones — when raw TICK values hit extreme highs/lows, a separate highlight box appears in the dashboard, warning of potential turning points
All logic is customizable, including TICK symbol, timeframes, thresholds, and lookback periods.
Scalpers and day traders who want fast, visual insight into market internals, exhaustion, and trend bias.

EMA Break & Retest + Trend TableThis script is designed to identify potential buy and sell trading opportunities based on 21 EMA (Exponential Moving Average) break and retest patterns, with confirmation from multi-timeframe trend analysis. It combines actionable signal generation with a clean, real-time trend overview table.
✅ 1. EMA Break & Retest Logic
Detects when the price crosses above or below the 21 EMA and then closes in the direction of the breakout.
Generates buy signals on upward break/retest, and sell signals on downward break/retest.
✅ 2. Multi-Timeframe Confirmation
Filters signals using higher timeframe trends to avoid false entries.
Buy signals are shown only if the 1H or 4H trend is bullish.
Sell signals are shown only if the 1H or 4H trend is bearish.
✅ 3. Visual Signal Plotting
Displays green "BUY" labels below bars and red "SELL" labels above bars.
Users can toggle buy/sell signals on or off with checkboxes.
✅ 4. Alerts
Built-in alertcondition() functions allow traders to set real-time alerts when buy or sell signals are triggered.
✅ 5. Multi-Timeframe Trend Table
A dynamic table appears in the top-right corner showing trend status across:
Daily (D)
4 Hour (4H)
1 Hour (1H)
15 Minute (15M)
5 Minute (5M)
Each timeframe is marked as Bullish (green) or Bearish (red) depending on the current price vs. 21 EMA.
The latest signal (“BUY” / “SELL” / “—”) is displayed at the bottom of the table.
Pino Trend Pack (SMA/EMA + Bollinger)🔹 Pino Trend Pack is a compact trend-following and volatility indicator that includes:
📈 Moving Averages:
- SMA 10, SMA 30
- EMA 21, EMA 55, EMA 89
(All configured for short-term to mid-term trend analysis by default, but fully adjustable for user preference.)
📊 Bollinger Bands:
- Period: 20
- Standard Deviation: 2.0
- Includes Upper Band, Lower Band, and Basis (SMA 20)
This pack is designed for traders who want a clean visual of price dynamics across multiple short-term trend layers, combined with volatility tracking. It helps you identify compression, expansion, and trend shifts at a glance.
🧠 Ideal for swing trading, short- to mid-term setups, or as a supporting tool in any confluence-based strategy.

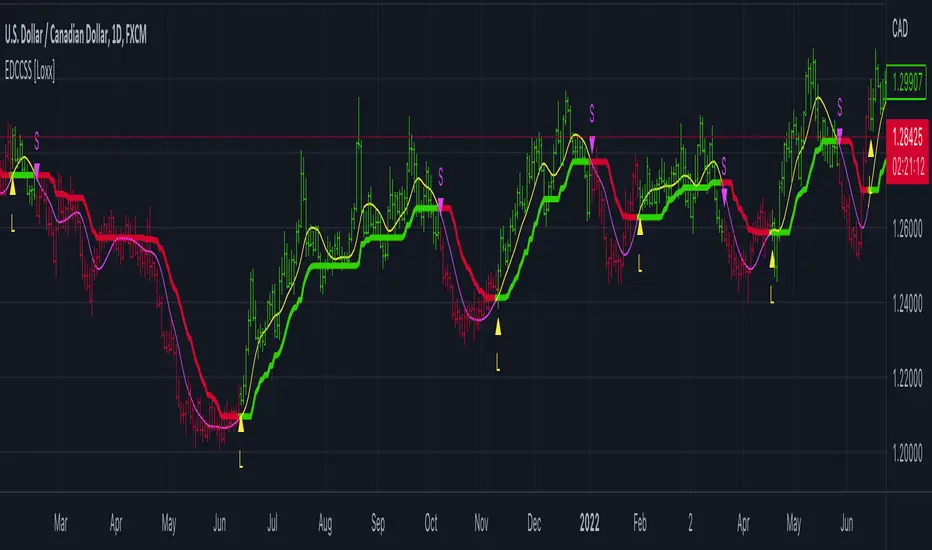
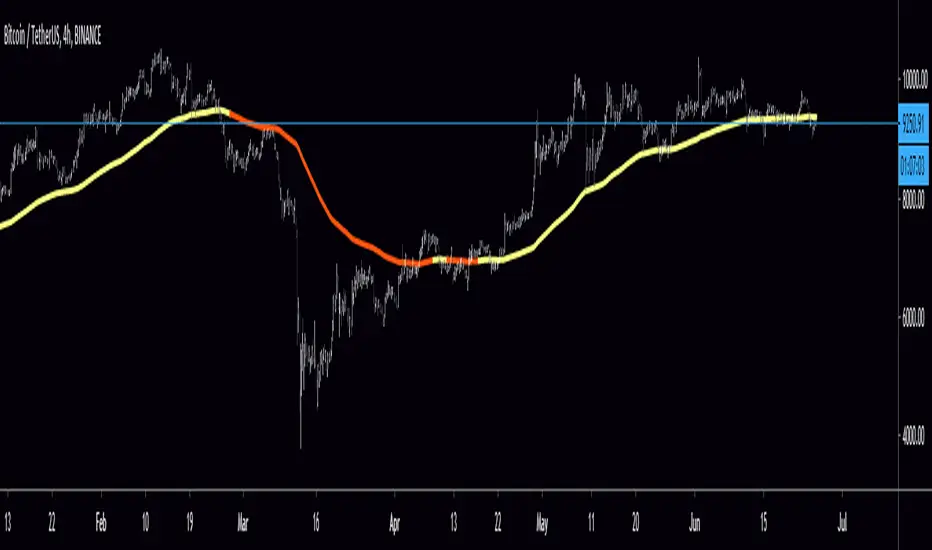
EMA-Deviation-Corrected Super Smoother [Loxx]This indicator is using the modified "correcting" method. Instead of using standard deviation for calculation, it is using EMA deviation and is applied to Ehlers' Super Smoother.
What is EMA-Deviation?
By definition, the Standard Deviation (SD, also represented by the Greek letter sigma σ or the Latin letter s) is a measure that is used to quantify the amount of variation or dispersion of a set of data values. In technical analysis we usually use it to measure the level of current volatility.
Standard Deviation is based on Simple Moving Average calculation for mean value. This version is not doing that. It is, instead, using the properties of EMA to calculate what can be called a new type of deviation, and since it is based on EMA. It is similar to Standard Deviation, but on a first glance you shall notice that it is "faster" than the Standard Deviation and that makes it useful when the speed of reaction to volatility is expected from any code or trading system.
What is Ehlers Super Smoother?
The Super Smoother filter uses John Ehlers’s “Super Smoother” which consists of a a Two-pole Butterworth filter combined with a 2-bar SMA (Simple Moving Average) that suppresses the 22050 Hz Nyquist frequency: A characteristic of a sampler, which converts a continuous function or signal into a discrete sequence.
Things to know
The yellow and fuchsia thin line is the original Super Smoother
The green and red line is the Corrected Super Smoother
When the original Super Smoother crosses above the Corrected Super Smoother line, its a long, when it crosses below, its a short
Included
Alerts
Signals
Bar coloring
EMA 50 HIGH LOW BANDHi
This indicator displays a band of EMA 50 having high and low of the same ema.
This script works well on 5 min chart or lower time frames in intraday.
When any price is above this band, you may consider a buy position and whenever any price is below this band, you may consider a sell position.
You may also take help of EMA 200, which is shown in red color. Whenever price is above EMA200, it is considered bullish and when ever it is below EMA 200, it is considered bearish.
This will remove a lot of noise from your chart.
I hope it helps.
Thanks

Reversal off EMA-XsEMA-Xs works mostly on Forex due to the small prices and price fluctuations. It does work on Gold, oddly enough, and some others like UKX 100...but mostly on forex. It doesn't work as well on JPY pairs but occasionally does; the JPY pairs give less signals, but when a JPY pair gives a signal, its a high probability setup. Another script EMA-XL works better on the higher priced instruments like S&P, DJI, OIL, BTC etc.
This script will show 3 moving averages: 13, 34, 200 and works on the 5m, 1hr, 4hr, daily charts. Signals "B" or "S" will be on the chart above or below the candles respectively.
When to open:
The script gives buy and sell signals based on a counter-trend move away from the MA's. When the price rises a specific percent above/below the EMA, it'll give a signal. It's best to take a trade when it gives a cluster of consecutive signals near the same price. If using on the 5m, definitely wait for consecutive signals. Also, use this in conjunction with support and resistance areas. Using with fibs for confirmation really makes this a good tool with high probability: IE, when price hits a fib and the script gives a signal, its a high probability setup.
When to close:
1. After a fast move up/down you may use this to counter trade a scalp 10+ pips, but you need to be quick; applies mostly to the 5m chart.
2. If you have the tenacity wait until you see an opposite signal. With this method you may be holding a loosing trade for a while. But what I've noticed is if it trends against you, price usually with come near to the first time it signaled. You may want to stack trades on each cluster of signals. IE first trade is 1000 units, next is 2000 units, etc... then close when prices comes near the first time it signaled. By this time, if you held, you should have profit. This strategy will really test your mental resilience.
3. Wait until it comes back to one of the trendlines; remember this is a counter trend signal so price is moving away from the MA and it always returns to touch one of the MA's...LOL eventually
4. Applying to scalping on the 5m, keep the stops tight because if the instrument trends hard and fast, you'll be upside-down quickly.
If you put a lot of time into using this signal generator, you can really make good profit. But with all tools, you need to master it. There are nuances to the simple logic of this script that can be both fun and frustrating. With all endeavors, if you put the time into it, you will reap the rewards.
Good luck and let me know if you have any questions/comments.

EMA MTF PlusI like trading the 1 minute and 3 minutes time-frames. I'm what is commonly called a "scalper". Long term investments yes, I have some, but for trading, I don't have neither the time,
nor the patience to wait hours or days for my trade to be complete.
This doesn't mean I discount the higher time-frames, no, I actually rely heavily on them. I found that EMAs do a decent job as support/resistance, sometimes to a tick level of precision. And this is important for a 1 minute trader.
As such, I made this script that tracks the higher time-frames EMAs and displays the last value as a line.
I do not need the whole EMA, I'm not interested in crossovers or crossunders, these are anyway late signals for me.
What's with the triangles? These are local tops/bottoms , candles that have a have decent size of the wick. These tops and bottoms are by no means "final", they are merely a rejection at certain levels of price. Due to markets complexities (and human erratic behaviors hehe) these levels could be breached at the very next candle. For a more "final" version (nothing is really final but..) I added Schaff Trend Cycle as filter, so a triangle will pop only when a trend is mature enough ( STC with a value near 0 or near 100).
Colored bars. When the body of the candle is big, it shows strength. Strong bars tend to have follow through, especially when breaking key levels. The script looks at the body of the candle and compares it with ATR (Average True Range), if it's at least 0.8 of ATR it changes the bar color to yellow (bull candles) or fuchsia(bear candles).
Range identifier. This code is copied from Lazy Bear (if there are any issues please let me know), it's very useful in conjunction with colored bars.
I look for breakout candles that go outside of the range as a signal for a trade.
There are many ways in which this script can be useful, like trading mean reversions or momentum trades (breakouts) or simply trend following trades.
I hope you guys find it useful, you can play with default values and change them as you like, these are what I found to be working best for me and my trading universe (mostly crypto).
Special thanks for the original work of:
LazyBear
everget
Jim8080

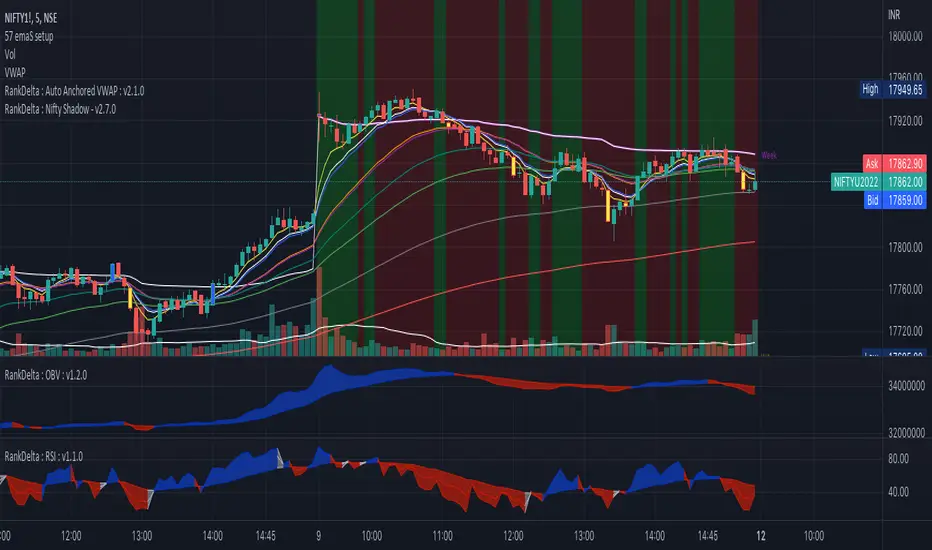
5 emaS setupYOU GET ALL 5 EMAS _ EMA 5,8,20,34,50,200
5 emas in one script so that you need not add then individually
Useful for intraday trades and best at 5 min tf
EMA DifferenceThis indicator simply calculates the difference between two EMAs (one is EMA-10 and the other one is EMA-20) and shows the amount of difference in form of a histogram chart. When the histogram bars are above zero, it shows you that we have an uptrend, and vice versa. You can use this Indicator in various markets and it is compatible with different time-frames.

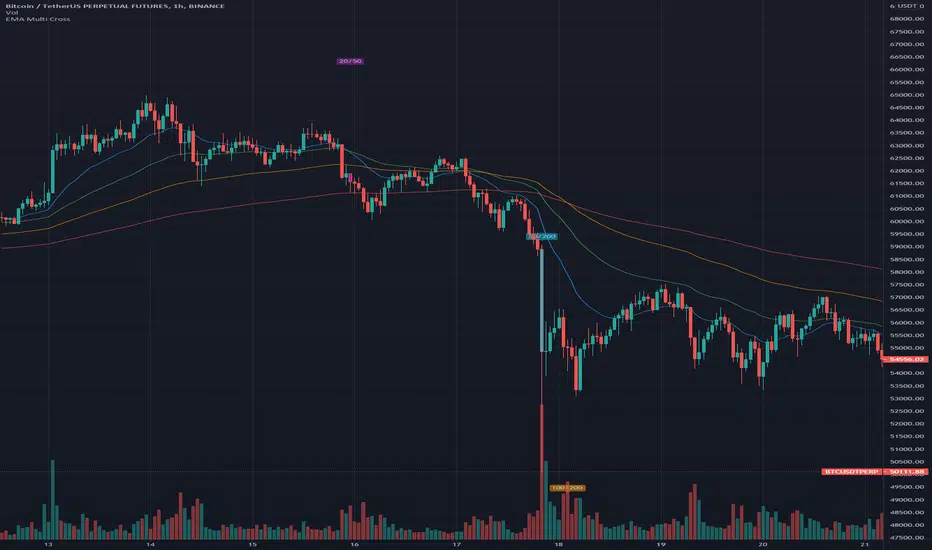
EMA Multi CrossThis is just a very simple EMA indicator that shows the 20, 50, 100, and 200 Exponential Moving Averages and plots some shapes when the lines cross from the 20 & 50, the 50 & 200, and the 100 & 200.
I know there are many EMA indicators out there, but I couldn't find one that let me edit the colors, values, and toggle the crossings. Maybe some of you will find usefulness in having some of these extra options too.
I use this occasionally on the Bitcoin 1 hour charts to see how the long-term trend is going.
Here are some ways to read EMA lines:
Slope: A rising moving average generally reflects a rising trend, while a falling moving average points to a falling trend.
Crosses: Seeing when a slower moving average crosses over/under a faster moving average can be an indication of a trend. If a shorter moving average remains above the longer moving average after they cross, the uptrend is considered intact. The trend is seen as down when the shorter moving average is below the longer moving average.
I prefer the slope of the two since crosses can cause some false positives if you are relying on it for trades.
EMA ICHI BB [Rogulabo]3 indicators in 1.
Included Indicators are:
- EMA 8,13,21,55,100,200,450
- Ichimoku
- Bollinger Band
These can be used to determine changes in trends when:
- EMA's collide, trajectories shift, or certain levels are reached.
- Ichimoku cloud is above or below the candles.
- Bollinger Band's width changes, or range is broken.
Reasons for 3 in 1 assembly:
This indicator is intended to be used by students, and followers of Dan Takahashi
(a prominent educator of investing in Japan who is also a user of TradingView) .
Those who wants to use and learn with the same setup as Dan, would greatly benefit from this since,
the complex setting up process which can be a pain for beginners can be skipped with a simple click.
Every stylistic choice of color and placement were made to make it similar to the chart used by Dan.
Simple customizations are available such as:
- Changing color
- Changing the values
- Hide/show controls
Notes:
This is intended to be used alongside “STOCH RSI ” for the complete the setup.
Any questions, please refer to:
@rogulabo
==
高橋ダンさんが使用されてるチャートと同様のセットアップの為にご活用ください。
複数のインジケータをグループにしておりますので、無料版を使われてる方は効率よく使っていただけると思います。
また、“STOCH RSI ”どいうタイトルのインジケータも同時に公開しておりますので、セットアップを完成させたい方はこちらもご活用ください。
以下のインジケータを含みます。
・EMA線
・一目均等表
・ボリンジャーバンド
カスタマイズされたい方はご自由に値を変更ください。
ご質問は @rogulabo までよろしくお願いいたします。

21/55 EMA Cloud w/ Optional RibbonThis indicator behaves like a traditional EMA ribbon by using the 21, 25, 30, 35, 40, 45, 50, and 55 bar exponential moving averages. In this particular indicator, the traditional EMA ribbon lines are turned off by default leaving only a filled in area between the 21 and 55 bar averages. The filled in area is green when the 21 bar average is greater than the 55 and red otherwise. Additionally, the 9, 100, and 200 exponential moving averages are available for reference.

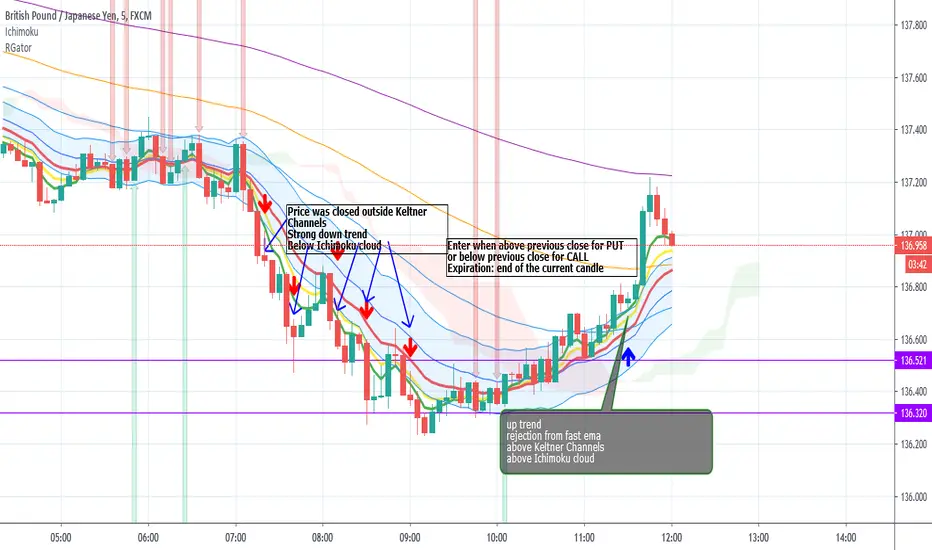
Rainbow Gator - EMAs strategy for Binary OptionThis is an EMAs indicator for Binary Option or Scalping Alert designed for lower Time Frame Trend (2-5minutes).
Although you will find it a useful tool for higher time frames as well.
The Alerts are generated when the fast EMA cross over/under other slower EMAs, you then have the chance to wait for the pullback during the new trend then enter for trend momentum (follow the trend).
Beware when the trend is close to EMA200.
You must draw your SRT (Support-Resistance-Trendline) before looking for setups.
Good luck.
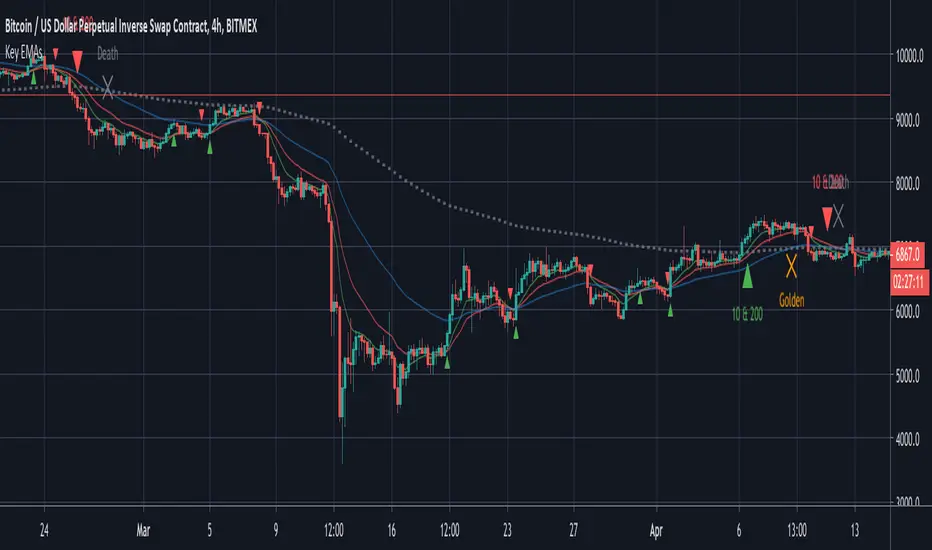
Key EMAsSimple trade helper script that plots:
- 10 & 20 EMA crosses for fast moves
- 10 & 200 EMA crosses for trends
- 50 & 200 EMA golden and death crosses
Alerts built in.
Simple EMA CrossQuick script I put together to complete the following:
---
- Simple EMA with the option to either display both or consolidate them as one
- Single EMA will change color based on a cross of the two EMA values entered
- Programmed alerts for bullish/bearish crossover
Enjoy!
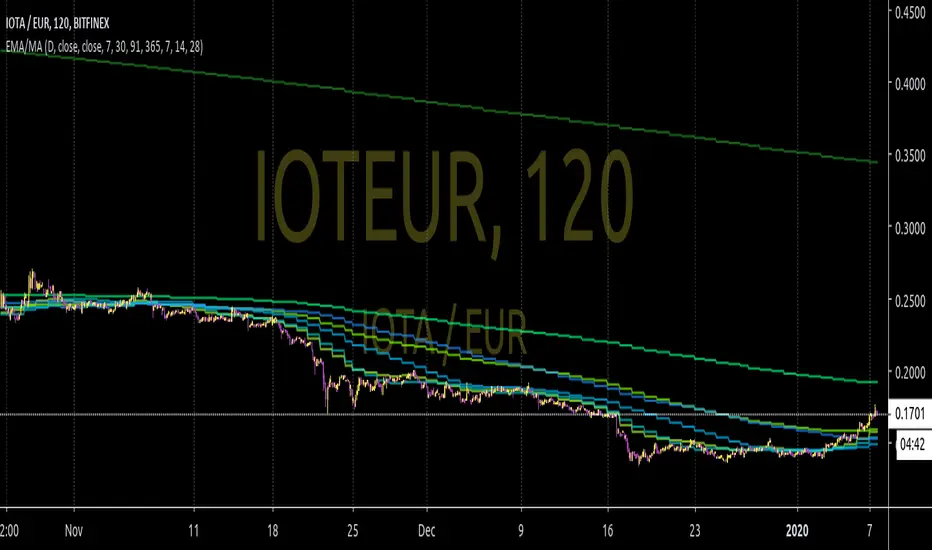
Multi EMA/MA with fixed timeframe by TopsyKrettThis script shows several EMAs and MAs, fully editable
The moving averages dont change when changing candlelength
Unedited it gives:
- 4 EMA (weekly, monthly, quarterly, anual)
- 3 MA (7day, 14day, 28day)
based on daily close
In the script are two additional EMAs and MAs mutet, easy to activate with pine editor
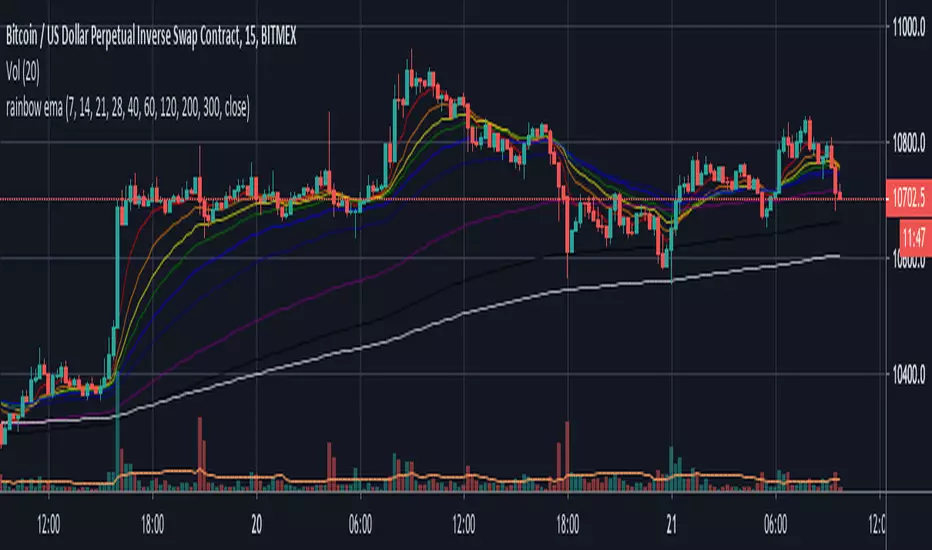
rainbow emaHi guys,
This is a multiple EMA script. Editing is free for use if you swap ema to sma as a base setting.
You can use several ema lines by adding one indicator only, and I put 7,14,21,28,40,60,120,200,300 as a threshold which I frequently use.
It is made as an open source at any time possible, so that you are free for playing with it.
Cheers,
JB
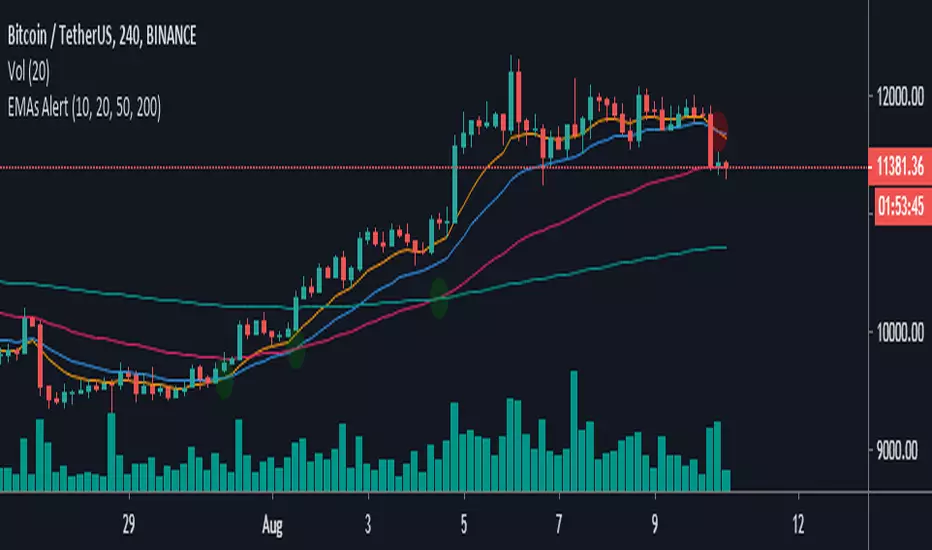
EMAs Alert-This script allows you to show the crossings of the most important emas such as 10, 20, 50 and 200
-You can modify the values of each ema you like
-Bring alerts of the crosses of each ema, which will allow you to activate this function to only the assets you want to track
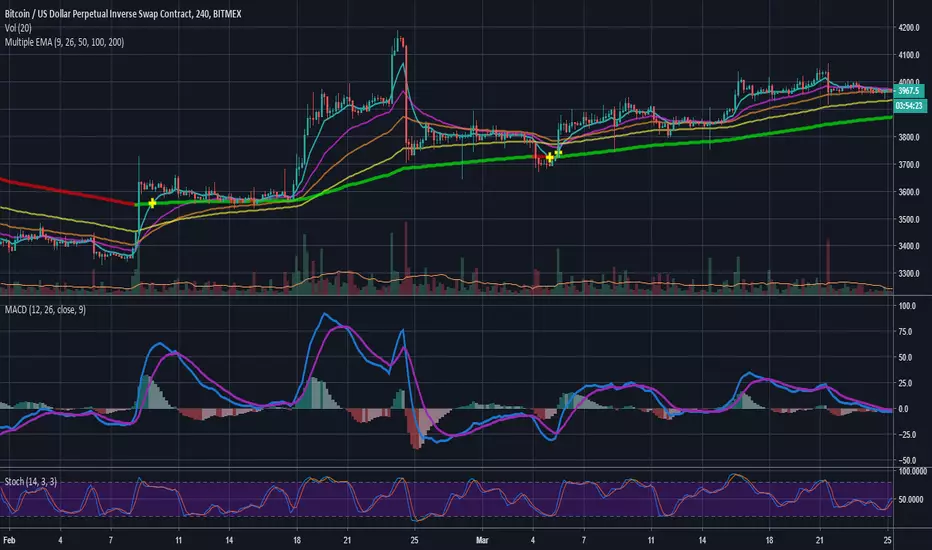
Multiple EMAMultiple EMA. Color switch of slowest EMA (def=200) when price close below or above. Trend marker when fastest EMA (def=9) cross slowest EMA (def=200).
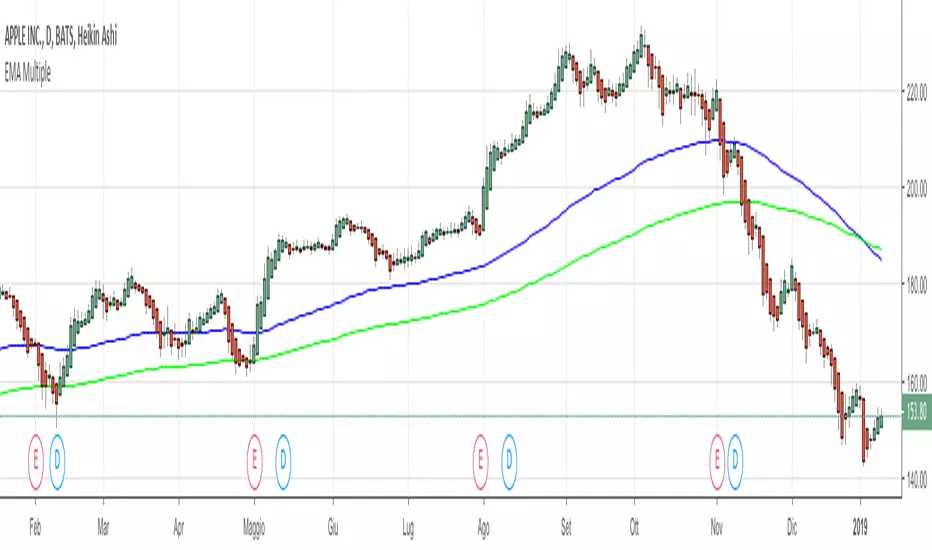
EMA MultipleUse this script to view EMA D in graph intraday or D.
You can set two different EMA (ex: 100,200) and view, for example, the values of EMA D on 5 min.
Enjoy!