ابحث في النصوص البرمجية عن "ema"
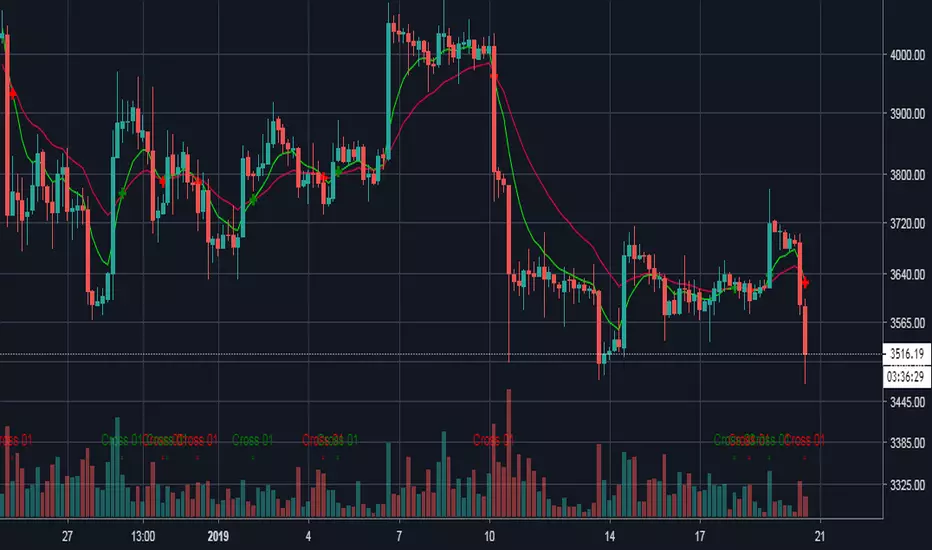

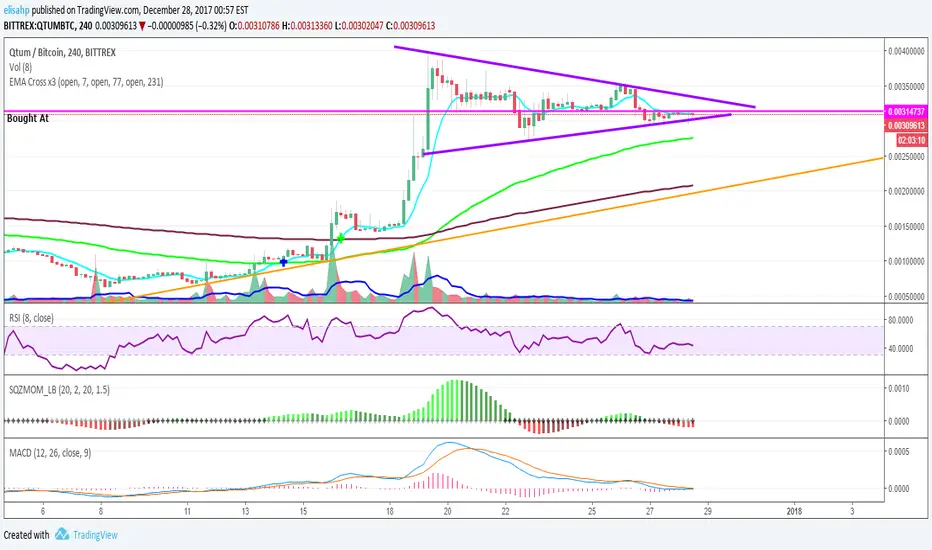
EMA Cross x3 (7, 77, 231)Exponential Moving Average at periods, 7, 77, 231. You will see a blue cross when the short EMA crosses the medium EMA, and a green cross when it crosses the long EMA.
EMA Envelope StepgainThis indicator shows a close approximation to what Gunbot would use in its GAIN and STEPGAIN strategies.
The middle two lines are the EMA(2h) and EMA(4h) lines. The inner two grey lines are BUYLVL2/SELLLVL2, the outer grey lines are just there to constrain the color bands. The green and red bands are indicators of where the candle has exceeded your setting and Gunbot would start considering buying or selling.

EMA Time-FrameThis EMA allows you to specify a time-frame for the price used to calculate the moving average. For example, you can create 1 hour EMAs on your 5 minute chart.
NOTE: This indicator only works on intraday charts. The time-frame specified for the indicator must be greater than or equal to the time-frame of the chart.


EMA/SMA 350 & 111 (Day Settings) by JayEMA/SMA 350 & 111 (Day Settings) by J
Übergeordneter Trendwechsel erkennen auf High Time Frames

EMAS + SuperTrend+ Key Levels SpacemanBTC IDWMEma 200 800 supertrend and key levels.
Thanks to spaceman for making the code available.

EMA 9/21 Crossover Alert (BerryRight)This indicator gives entry signals through EMA crossover and the gives the opportunity to set up alerts. I will update this indicator with exits in the future. it's written in Pinesctipt v5

EMA SMA Ribbon IRB IndicatorUsing EMA and SMA to show support and resistance area instead of lines.
And Show Rob Hoffman's IRB indicator for choosing entry point.

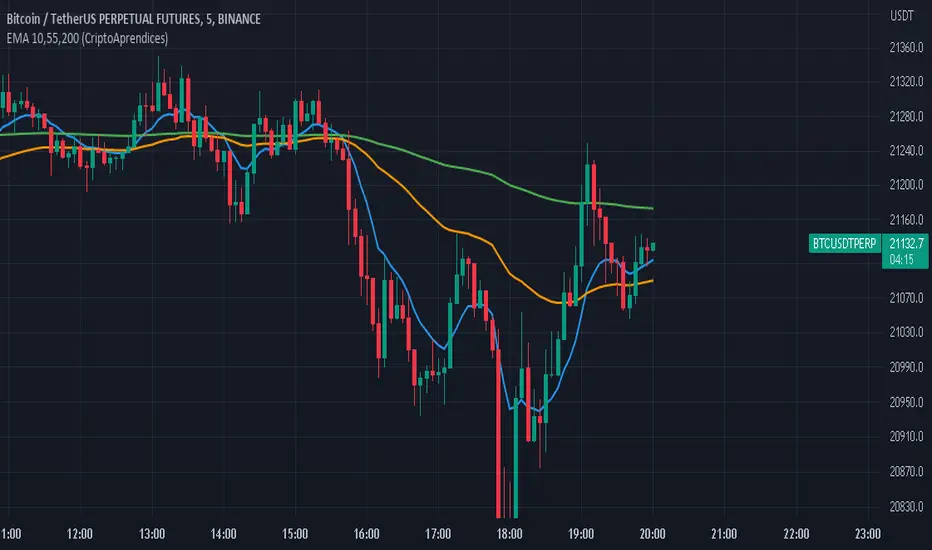
EMA 10,55,200 (CriptoAprendices) CriptoAprendices
Media Móvil Exponencial (EMA'S )de 10,55 Y 200 en Un Solo Indicador
EMA scalping - PapamallisEma of highs and low and macd.
Can be used as
*macd filter
*breakout
*range market filter

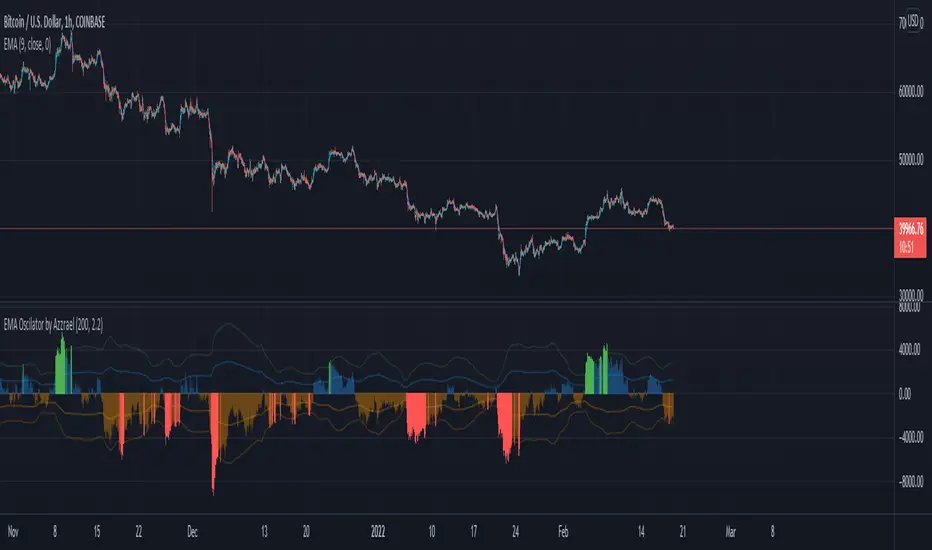
EMA Oscilator [Azzrael]Just one more simple and useless Oscilator based on EMA. I've used Standard Deviation of (close - ema) to show overheated zones.
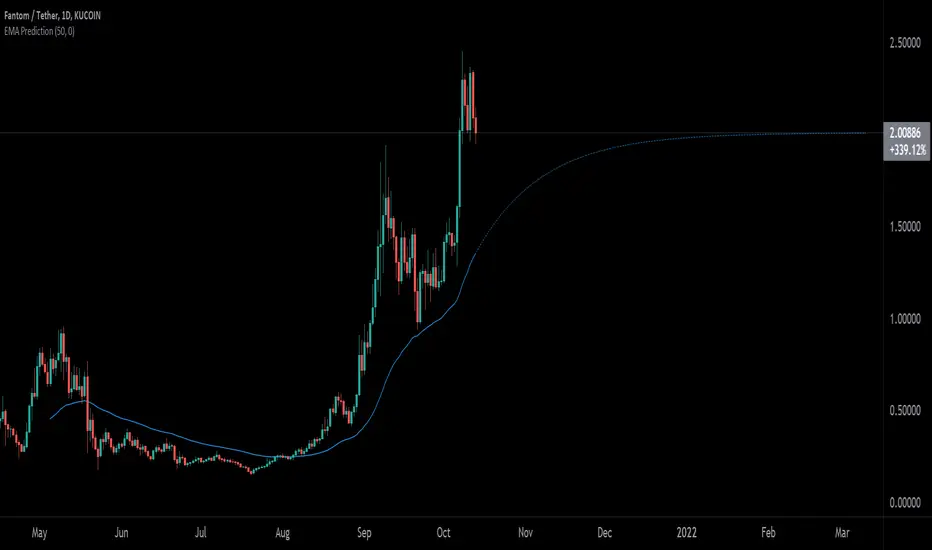
EMA PredictionThis script predicts future EMA values assuming that the price remains as configured (-50% to +50%).
EMA Ribbon Bollinger UltimateEma Ribbon and Bollinger Bands.
Background change color if the trend change or if it goes weak.


EMA Cross Levels + Standard DeviationPlots the price level that the most recent EMA crossover occurred at(Green if bullish and red if bearish).
Also calculates standard deviation over a shorter window-length/lookback period (of 'n_std_fast' length) and another over a much longer span of periods(n='n_std_slow', > 'n_std_fast').
These are the two dotted lines appearing as bands around the cross-level line.


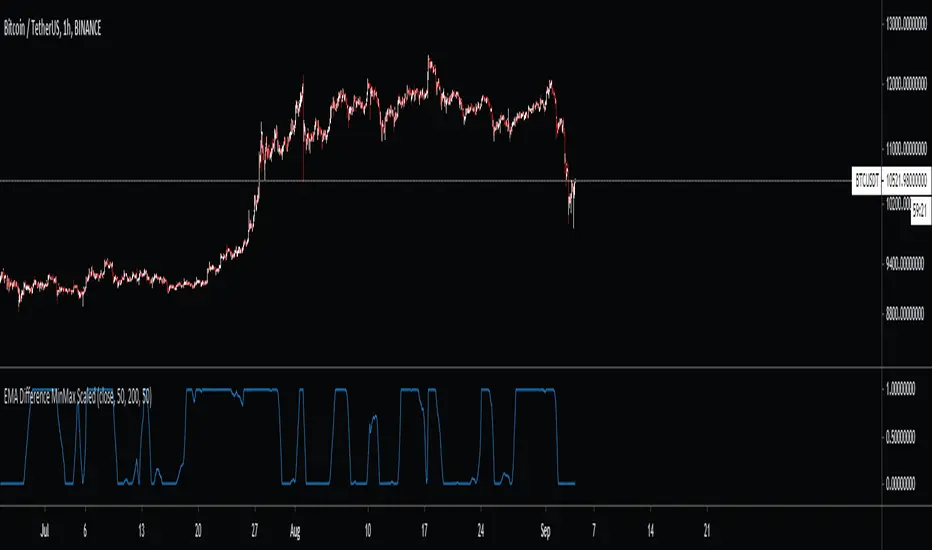
EMA Difference MinMax ScaledDifference between two EMAs and then transformed through a MinMax scaler
EMA Cross <Johnson Lim>EMA Cross basically is for someone who just need to spot as a guideline whether there are 'opportunity' to buy in or out. I had been using this for few years and it always helps for me at the stage of screening typically on Crypto space.
