Trend with ADX, multiple EMAs - Buy & Sell✔ Trend Direction
Via DI+ > DI–
✔ Trend Strength
Via ADX
✔ Fast Entry Signals
5/8 EMA crossovers
✔ Larger Trend Confirmation
13/48 EMA crossovers
✔ Macro Trend
EMA 200
✔ Intraday Bias
VWAP
✔ Visual Trend (background)
✔ Alerts for signals + trend shifts
ابحث في النصوص البرمجية عن "ema"

EMA Percent Angle & Slope VisualizerEMA Percent Angle & Slope Visualizer is a powerful trend-strength tool that measures the true geometric slope of an EMA using percent-normalized angle calculations.
Unlike raw angle or ATR-based angle methods, this indicator uses the formula:
angle = atan( (EMA_t - EMA_(t-1)) / EMA_(t-1) ) * (180 / pi)
This gives you a universal slope measurement that works across stocks, indices, currencies, and crypto — regardless of price scale.
🔍 Features
Percent-normalized EMA angle for accurate trend strength
Auto-detected slope segments
Dynamic EMA color
🟢 Bullish slope
🔴 Bearish slope
⚪ Neutral (angle below threshold)
Dashed slope lines drawn only during valid slope runs
Angle label displayed at slope end
Works on any timeframe
Designed for momentum traders, trend followers, breakout traders, and algo developers
📌 Why Percent-Normalized Angle?
Raw price angle is meaningless because angles depend on chart scaling.
Percent-normalized angle gives a true slope, equal across all instruments.
✔ Tip
Slopes above +0.15° and below –0.15° represent strong trend phases for Nifty.
Adjust threshold for your timeframe according to your script

EMA 21 & EMA 36 with Signals-RamanaReddyEMA 21 & EMA 36 with Signals avg
EMA crossover signals
Alerts on crossovers
Strategy backtest version

Moving Aaverage (EMA) & VWAP by Vish
Multi-Timeframe Moving Averages with VWAP
This indicator combines essential moving averages with VWAP to provide comprehensive trend analysis on a single chart. Designed for traders who need quick visual reference of multiple timeframes and volume-weighted price levels.
Features:
• Six customizable moving averages: 8, 13, 21, 50, 100, and 200 periods
• Toggle between Simple Moving Average (SMA) and Exponential Moving Average (EMA) for all lines
• Individual on/off controls for each moving average
• Volume Weighted Average Price (VWAP) with customizable settings
• VWAP anchor options: Session, Week, Month, Quarter, and Year
• Clean, color-coded visualization for easy identification
• Fully customizable through settings panel
Use Cases:
• Identify trend direction across multiple timeframes
• Find dynamic support and resistance levels
• Spot potential entry and exit points
• Analyze price action relative to volume-weighted average
• Confirm trend strength with multiple MA convergence/divergence
Settings:
All parameters are adjustable including MA type (SMA/EMA), individual MA visibility, VWAP source, and VWAP anchor period.
Suitable for all markets and timeframes. Works on stocks, forex, crypto, commodities, and indices.
#moving average #MA #EMA #SMA #VWAP #trend #support #resistance #multi-timeframe

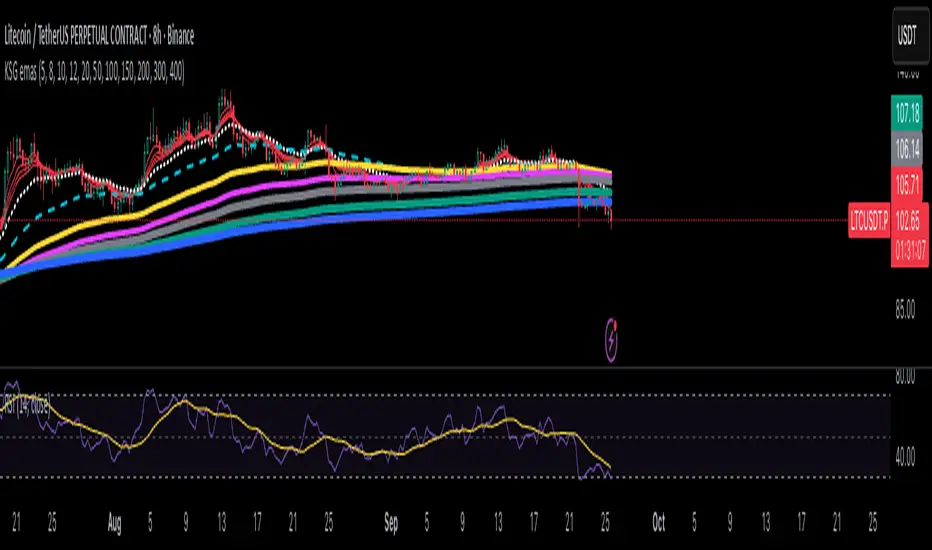
KSG emasThis script plots 10 customizable Exponential Moving Averages (EMAs). Each EMA length and color can be adjusted in the settings. It’s designed for traders who want to track multiple EMAs at once for trend analysis and strategy development.
Anchorman - EMA Channel + EMA + MTF Status Table PRICE BREAKOUTUses a high/low EMA Channel to tell you when strong price breakouts are happening plus comes with a EMA to help follow the trend if you like. I designed it so it can alert you when a single TF touch happens or a breakout alignment on MTF happens (I recommend this) its up to you also its single alert so no need to do bullish or bearish signals just one signal will alert you when a breakout happens in EITHER direction.

Adjustable EMA Cross with EMA50 & EMA200 FilterThis is a simple indicator utilizing a short and mid length EMA to trigger a buy alert when the short EMA crosses above the mid EMA and both are below the 50 and 200 EMA. The sell alert triggers when the opposite occurs. I use this indicator for trading Forex pairs.
BPS Multi-MA 5 — 22/30, SMA/WMA/EMA# Multi-MA 5 — 22/30 base, SMA/WMA/EMA
**What it is**
A lightweight 5-line moving-average ribbon for fast visual bias and trend/mean-reversion reads. You can switch the MA type (SMA/WMA/EMA) and choose between two ways of setting lengths: by monthly “session-based” base (22 or 30) with multipliers, or by entering exact lengths manually. An optional info table shows the effective settings in real time.
---
## How it works
* Calculates five moving averages from the selected price source.
* Lengths are either:
* **Multipliers mode:** `Base × Multiplier` (e.g., base 22 → 22/44/66/88/110), or
* **Manual mode:** any five exact lengths (e.g., 10/22/50/100/200).
* Plots five lines with fixed legend titles (MA1…MA5); the **info table** displays the actual type and lengths.
---
## Inputs
**Length Mode**
* **Multipliers** — choose a **Base** of **22** (≈ trading sessions per month) or **30** (calendar-style, smoother) and set **×1…×5** multipliers.
* **Manual** — enter **Len1…Len5** directly.
**MA Settings**
* **MA Type:** SMA / WMA / EMA
* **Source:** any series (e.g., `close`, `hlc3`, etc.)
* **Use true close (ignore Heikin Ashi):** when enabled, the MA is computed from the underlying instrument’s real `close`, not HA candles.
* **Show info table:** toggles the on-chart table with the current mode, type, base, and lengths.
---
## Quick start
1. Add the indicator to your chart.
2. Pick **MA Type** (e.g., **WMA** for faster response, **SMA** for smoother).
3. Choose **Length Mode**:
* **Multipliers:** set **Base = 22** for session-based monthly lengths (stocks/FX), or **30** for heavier smoothing.
* **Manual:** enter your exact lengths (e.g., 10/22/50/100/200).
4. (Optional) On **Heikin Ashi** charts, enable **Use true close** if you want the lines based on the instrument’s real close.
---
## Tips & notes
* **1 month ≈ 21–22 sessions.** Using 30 as “monthly” yields a smoother, more delayed curve.
* **WMA** reacts faster than **SMA** at the same length; expect earlier signals but more whipsaws in chop.
* **Len = 1** makes the MA track the chosen source (e.g., `close`) almost exactly.
* If changing lengths doesn’t move the lines, ensure you’re editing fields for the **active Length Mode** (Multipliers vs Manual).
* For clean comparisons, use the **same timeframe**. If you later wrap this in MTF logic, keep `lookahead_off` and handle gaps appropriately.
---
## Use cases
* Trend ribbon and dynamic bias zones
* Pullback entries to the mid/slow lines
* Crossovers (fast vs slow) for confirmation
* Volatility filtering by spreading lengths (e.g., 22/44/88/132/176)
---
**Credits:** Built for clarity and speed; designed around session-based “monthly” lengths (22) or smoother calendar-style (30).

HILo Ema Squeeze BandsThis indicator combines uses ema to identify price squeeze before a big move.
The ema gets initialised at new high low. It used 3 ema's lengths. For result use x, 2x ,4x ie 50, 100, 200 or 100,200,400 and so on . On more volatile asset use a higher settings like 100,200,400. The inner band is divided into 4 zones, which can give support resistance. As you use it you will become aware of subtle information that it can give at times. Like you may be able to find steps at which prices move, when the market is trending
Just like in Bollinger bands, in a trending market the price stays within sd=1 and sd=2 so does in the inner band the price will remain in band1 and band2. But Bollinger band cannot print steps this indicator shows steps

RSI+EMA+MZONES with DivergencesFeatures:
1. RSI Calculation:
Uses user-defined periods to calculate the RSI and visualize momentum shifts.
Plots key RSI zones, including upper (overbought), lower (oversold), and middle levels.
2. EMA of RSI:
Includes an Exponential Moving Average (EMA) of the RSI for trend smoothing and confirmation.
3. Bullish and Bearish Divergences:
Detects Regular divergences (labeled as “Bull” and “Bear”) for classic signals.
Identifies Hidden divergences (labeled as “H Bull” and “H Bear”) for potential trend continuation opportunities.
4. Customizable Labels:
Displays divergence labels directly on the chart.
Labels can be toggled on or off for better chart visibility.
5. Alerts:
Predefined alerts for both regular and hidden divergences to notify users in real time.
6. Fully Customizable:
Adjust RSI period, lookback settings, divergence ranges, and visibility preferences.
Colors and styles are easily configurable to match your trading style.
How to Use:
RSI Zones: Use RSI and its zones to identify overbought/oversold conditions.
EMA: Look for crossovers or confluence with divergences for confirmation.
Divergences: Monitor for “Bull,” “Bear,” “H Bull,” or “H Bear” labels to spot key reversal or continuation signals.
Alerts: Set alerts to be notified of divergence opportunities without constant chart monitoring.

Synthetic EMA Momentum w/ DSL [Loxx]Synthetic EMA Momentum w/ DSL is a momentum indicator that is calculated with 5 different EMAs of increasing period to derive a final momentum value. This helps reduce noise and improve signal quality. Discontinued signal lines are uses to calculate signal values.
What are DSL Discontinued Signal Line?
A lot of indicators are using signal lines in order to determine the trend (or some desired state of the indicator) easier. The idea of the signal line is easy : comparing the value to it's smoothed (slightly lagging) state, the idea of current momentum/state is made.
Discontinued signal line is inheriting that simple signal line idea and it is extending it : instead of having one signal line, more lines depending on the current value of the indicator.
"Signal" line is calculated the following way :
When a certain level is crossed into the desired direction, the EMA of that value is calculated for the desired signal line
When that level is crossed into the opposite direction, the previous "signal" line value is simply "inherited" and it becomes a kind of a level
This way it becomes a combination of signal lines and levels that are trying to combine both the good from both methods.
In simple terms, DSL uses the concept of a signal line and betters it by inheriting the previous signal line's value & makes it a level.
Included:
Loxx's Expanded Source Types
Alerts
Signals
Bar coloring
Related indicators
Smoother Momentum MACD w/ DSL
T3 Velocity

Scalping EMA ADX RSI with Buy/Sell AlertsThis is a study indicator that shows the entries in the strategy seen in one of the youtube channel so it does not belong to me. I can't tell who it is because it's against the House Rules to advertise but you can find out if you look for it on youtube. Default values of oscilators and ema adjusted as suggested. He says he got the best results in 5 min timeframe but i tried to make things as modifiable as possible so you can mess around with the settings and create your own strategy for different timeframes if you'd like. Suggested to use with normal candlestick charts. The blue line below indicates the ADX is above the selected threshold set in the settings named "Trend Ready Limit". You can set alerts for Buy, Sell or Buy/Sell signal together.
The entry strategy itself is pretty straight forward.
The rules for entry are as follows, the script will check all of this on auto and will give you buy or sell signal :
Recommended time frame: 5 min
For Long Entry:
- Check if price above the set EMA (Can disable this rule if you'd like in the settings)
- RSI is in Oversold
- ADX is above set "Trend Ready" threshold (Meaning there is a trend going on)
- Price must approve the trend of previous candles. This is bullish for buy entries and bearish for sell entries.
- Enter with stop loss below last swing low with 1:1 or 1.5:1 take profit ratio.
For Short Entry:
- Check if price below the set EMA (Can disable this rule if you'd like in the settings)
- RSI is in Overbought
- ADX is above set "Trend Ready" threshold (Meaning there is a trend going on)
- Price must approve the trend of previous candles. This is bullish for buy entries and bearish for sell entries.
- Enter with stop loss above last swing high with 1:1 or 1.5:1 take profit ratio.
This is my first indicator. Let me know if you want any updates. I am not sure if i can add everything but i'll try nonetheless.
Changed: Signals will check up to 2 candles before if the RSI is below or above the set value to show signal. This is because sometimes the entry signal is right but the response might be a bit late.

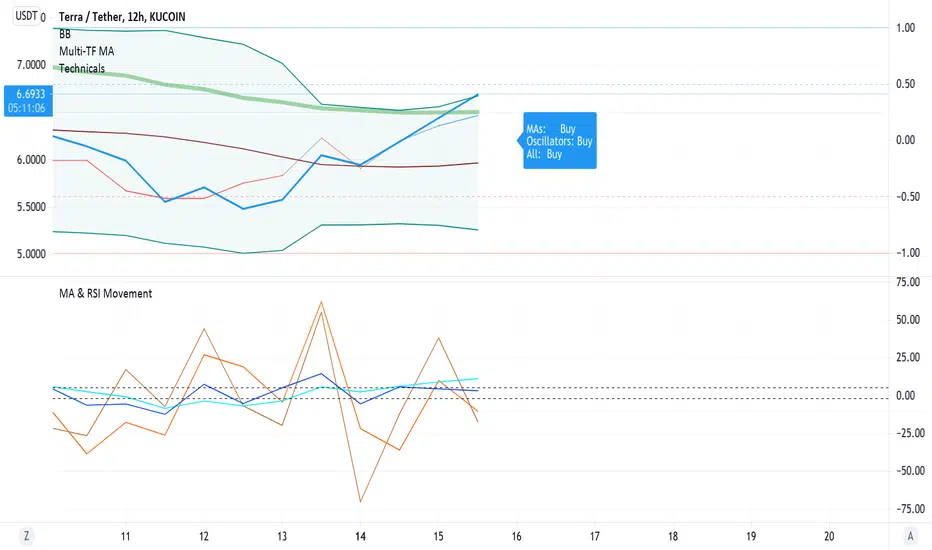
Barholle eMA and RSI Movement TestThis is a test that offers insight into whether and asset is heading into bullish or bearish territory.
This indicator/test offers insight into the Exponential Moving Average's velocity and acceleration as well as the Stochastic RSI's velocity, acceleration and jerk. Included is a 'Stochastic Difference' and 'Stochastic Growth' indicators (commented out) that measure the difference between K and D in the Stoch RSI as well as the rate of it's change. This test is all about crossovers - the best leading indicator is a downward cross of the eMA velocity over the eMA acceleration, indicating a drop in price in the current or next bar.
The lines or importance have been set to -2 and 5, but these should be adjusted to suit your preferences. These numbers were chosen in order to try and create some kind of threshold after which action might be suggested. Backtesting is highly recommended so you can see how the test does and does not work. It is super powerful, but it is not omniscient - its an RSI and eMA derivative, past success does not necessarily dictate future success.
Please look at the code for several more plots you can use of derivatives and other ideas explore but commented out for greater legibility of the graph. Commenting and commenting (or uncommenting all and just disabling some in the settings) and comparing the graphs and crossovers is a useful exercise. To that end, one last concept - the MARSI - a combined moving averages and RSI measurement - was abandoned because it didn't appear to indicate anything of use, however you may find crossovers or patterns with it comparing it to other graphs, so it was left in but commented.
Please take a look at the comments and all the math and indicators 'left on the cutting room floor' in the script. Maybe you'll find a gem in the redux version of this script.
Outreach regarding the script, patterns noticed and full-on stealing of the script are all permitted. Many elements of this script were nabbed from other scripts - thank you to a community of coders who put it all out there.
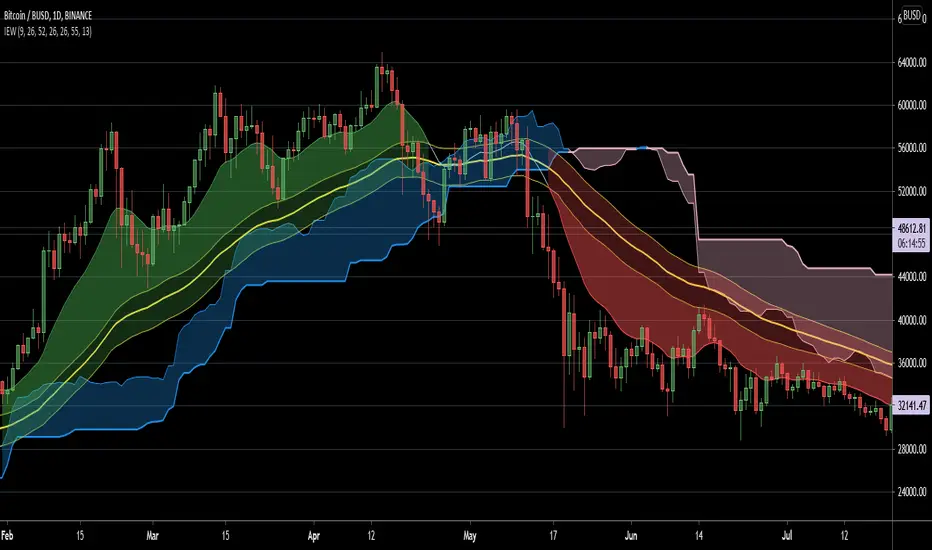
Ichimoku EMA WaveThis script combines a customizable Ichimoku Cloud/ EMA combination to provide a quick trend visualisation.
For example, long entries can be found when the green EMA wave rises above the Ichimoku cloud.
Combine it with some oscillators (like MACD) for good results.
Also, experimenting with a different "wavelength" (default 50) and/or EMA length (default10) for different securities is a good idea.
Script is free to use and to modify at ones liking.
Background Color Based on EMAHello Traders,
this is a very simple script. It paints the background color based on the close price in reference to an exponential moving average.
If the close is above the EMA the background color will be green.
If the close is under the EMA the background color will be red.
You can adjust colors and the EMA period by yourself.
This little indicator script is just to get a better overview, for example in combination with other indicators.
Hope you guys like this script. Wish you a great trading week.

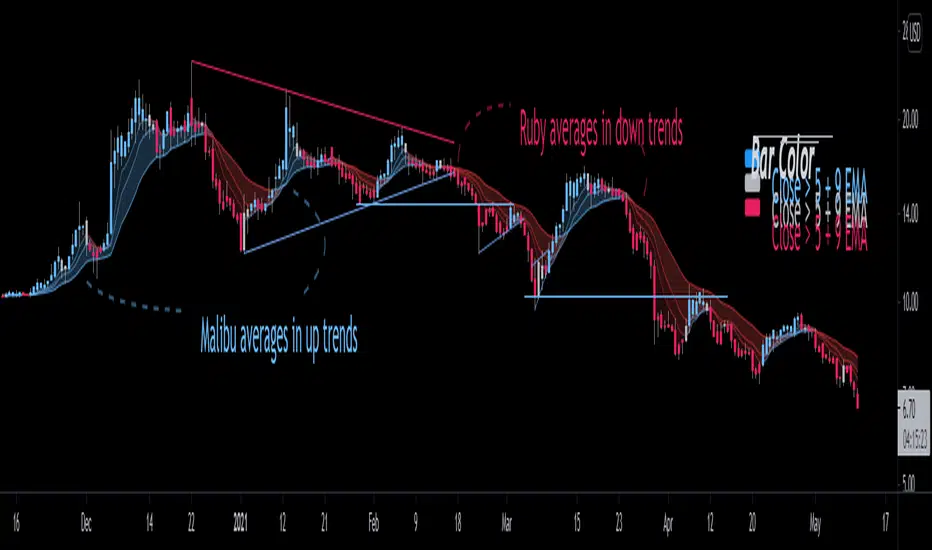
Bjorgum EMAThis is an answer back to repeated requests for a simple version of Bjorgum Triple EMA Strat, which is not recommended for use with Heiken Ashi candles as it results in "double smoothing" of the averages and can give late signals as a result.
The inputs are raw and super basic. At its core its really just 3 EMAs that you can customize the source and length. The averages and shadowing change color based on if they are either rising or falling.
default values are 5, 9, and 21 EMA on open as source.
Bar color is dictated by the bar close over or under the 5 and 9 EMA.
This is suitable for use on HA candle.
Trend following 3 EMA & Bullish Engulfing indicator for ForexHello world,
I now took the time and puzzled through my own indicator.
The idea:
Main "strategy" uses 3 EMAs (8, 13 and 21) to attain trend-relevant information.
Then we look for bullish & bearing engulfing candles which indicate and pullback into trend direction and a gain in momentum.
Trading purpose:
One could now enter with next open. SL at low/high of engulfing candle. TP at e.g. 1.25 of that candles size.
Security:
There are two security functions build in.
We check for higher timeframe confirmation.
This is done by checking if current trend is in accordance with the EMA of the next higher timframe.
Standard-deviation is 3 on default. Can be changed in the inputs.
Alerts:
Until now there is just one alertcondition programmed.
It alerts for every engulfing candle (bullish and bearish).
More will follow in further versions.
Inputs:
I build in multiple inputs.
- switch on/off the security EMA's
- define security trend backcheck
- define the higher timeframe (15min/1h, 1h/240, 4h/D, D/W)
Happy to take feedback or contr.
All the best,
c4ss10p314

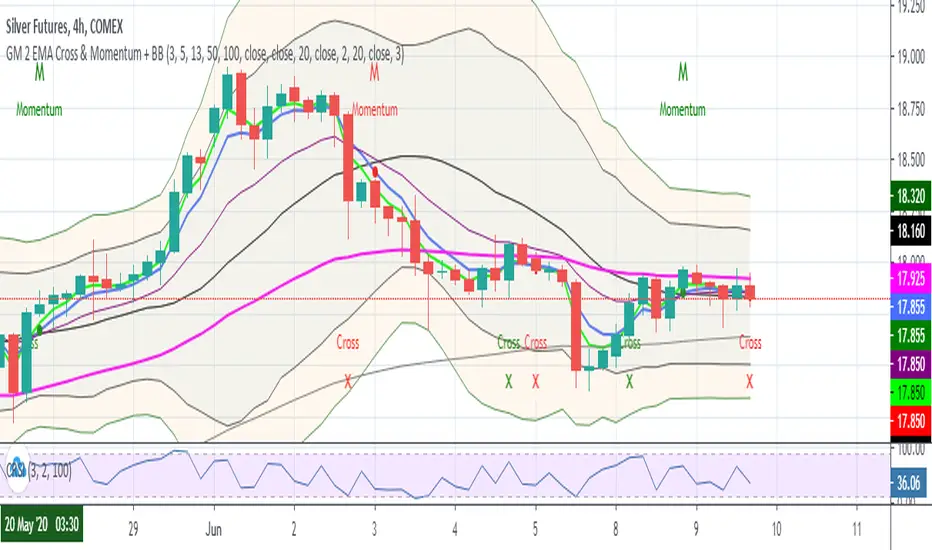
GM 2 EMA Cross + BBScript for seeing the below EMAs
3
5
13
50
100
This also plots a red cross when -ve crossover of 3 by 5 EMA & green cross when +ve crossover of 3 by 5 EMA
Bollinger Bands
2
3
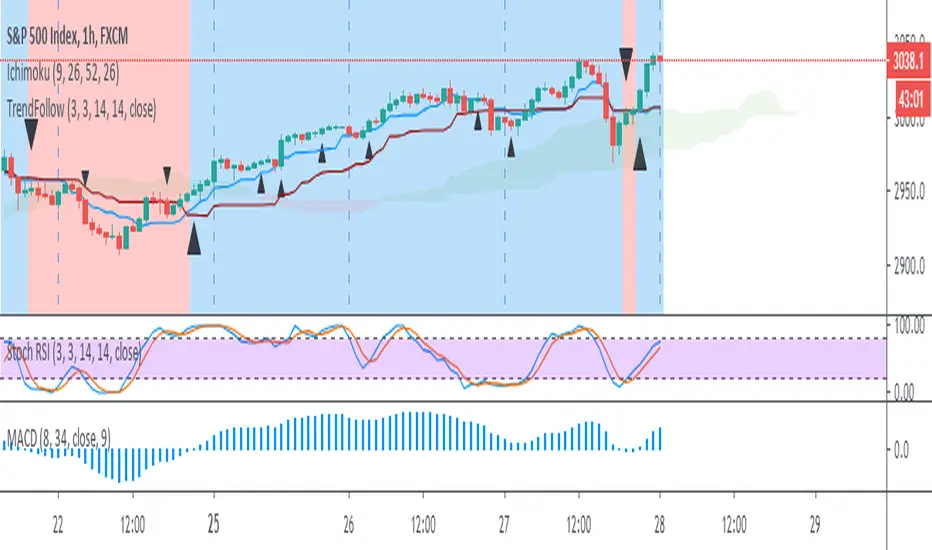
Trend Follow with 8/34 EMA and Stoch RSI for 1 Hour SPX
The script determines and plots entry points for 1 hour S&P index using 8/34 emas and stochastic RSI. When 8 ema above/below 34 ema up/down crosses of stochastic RSI are considered as long/short entries. Entry prices should be above/below high/low of the signal bars accordingly. Ichimoku cloud can be used as extra filtering.
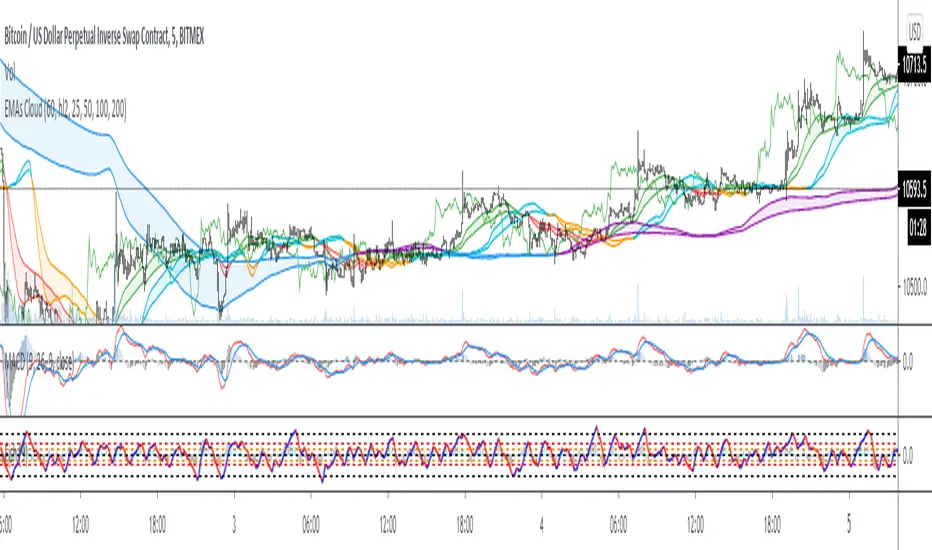
EMAs CloudEmas clouds is based on exponential moving averages 25 , 50, 100, 200
Ema 25/50 when crossed give you entry to the trend based on dipacmend forward ema 25/50 for 25 candles and ema 100/200
I add it also momentum based on close of the price moved back 25 candles.
DW-RSI EMA with EMA of RSIThis is an RSI Oscillator with an EMA of the RSI for a signal line. The RSI line is Green when above the signal line and Red when below the signal line.
This does not use the traditional 30% / 70% over sold / over bought analysis. Therefore the levels are not shown.
The analysis is this:
When the RSI is above the signal line then price has a bullish bias.
When the RSI is below the signal line then price has a bearish bias.
I wrote use this for Forex Spot Currencies where I feel overbought and oversold may be less valid than it may be in other markets such as stocks.
As with all indicators, do not use as your sole reason to enter the market, but use with other indicators or price action signals to get a confluence of signals to confirm your entry.
I use it with an 8, 21 and 50 EMA to confirm entry and exit. I give it more weight for exits than I do for entries.

Multiple lines EMA/SMA [AKUBI] Ver.2 - 5本の指数平滑・移動平均線単純移動平均線と指数平滑移動平均線(SMA/EMA)を最大5本引けるインジケーターです。
これまでのものとの違いは
・線の太さ
・名前の変更←これ重要
です。いままでのものをそのまま使用いただいても、問題はありません。
通常、トレーディングビューでは、
移動平均線を5本同時に表示させるには「5つのインジケーターを必要とします」。
しかし、 このインジケーターは1つ使えば最大5本まで同時に表示させることができます 。
また、余計なオプションは一切ありませんので、 どなたにでも、すぐにご使用いただけます 。
1)まず、この画面の右下にある「お気に入りに追加」をクリックしてください。
そうすると、インジケーターの「お気に入り」からいつでも呼び出せます。
もしくはインジケーターの検索欄から「AKUBI」と検索しても見つけられます。
使い方は簡単。
2)EMA(指数平滑移動平均線)か SMA(単純移動平均線)のいずれかを選択。
3)その後、お好きな期間を入力してください。
単純移動平均線(SMA)というのは、「5」と入力すれば、5本分のローソク足の終値の平均が表示され、それを結んだ線です。
指数平滑移動平均線(EMA)というのは、少し計算を複雑にして、より素早い動作を実現したものです。
デフォルトでは期間として(7,28,84,100,500)の5種類があらかじめ入力されています。
このまま使っても問題ありませんが、ネットで「移動平均線 設定」と検索すれば、いろいろな設定が紹介されていますので、参考にしてみてください。
不要な線があれば、チェックを外すだけです。
とっても簡単、便利です。
It is all in one. You can use 5 moving average lines with this one indicator only.
It is so easy. Just add this indicator. Next step, please add your favorite periods.
If you think this is an unnecessary line, you just remove in the check box.
Thank you!

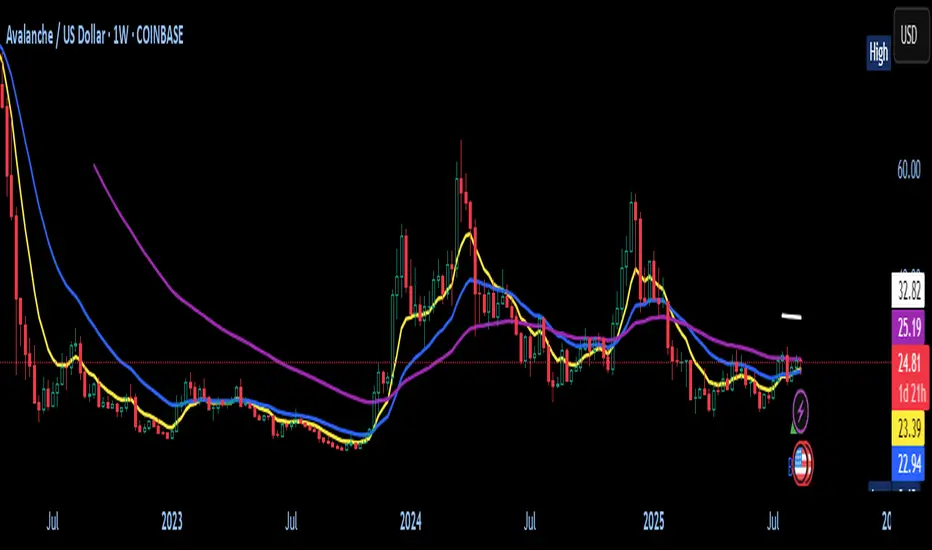
Fibonacci Moving Average (EMA/SMA) Bundle //@v1.2 Fibonacci Moving Average (EMA/SMA) Bundle
//By Tantamount
//Save your TV indicator use counts by using the Fibonacci SMA/EMA all in one indicator! Toggle between Exponetial or Simple moving averages functionality, using Fibonacci the sequence.
//Fib moving averages are very good at locating support and resistance zones on multiple time frames.
//Customize and or input your very own moving average nomenclature by simply changing the input options from default: SMA (21, 55, 89, 144, 233) or EMA (21, 55, 89, 144, 233) Example: (8,13,21,55,89)
Support and Resistance Lines
