2 EMA Meeting PointThis script will calculate when the next candle needs to close for the moving averages to cross .
If you use EMAs that are far away, the convergence point may be ridiculously far away from the chart. I recommend using ' Scale Price Chart Only ' with this script.
I think you can use this to organize your watchlists if you trade crossovers. If your cross is completely out of the chart, its symbol can be down below, because the cross is unlikely to happen in the next candle.
Good luck!
ابحث في النصوص البرمجية عن "ema"
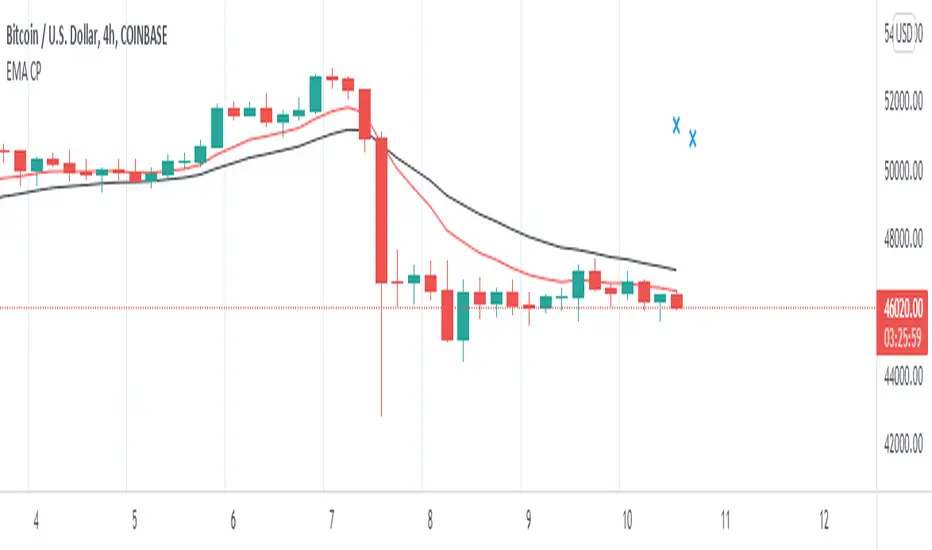
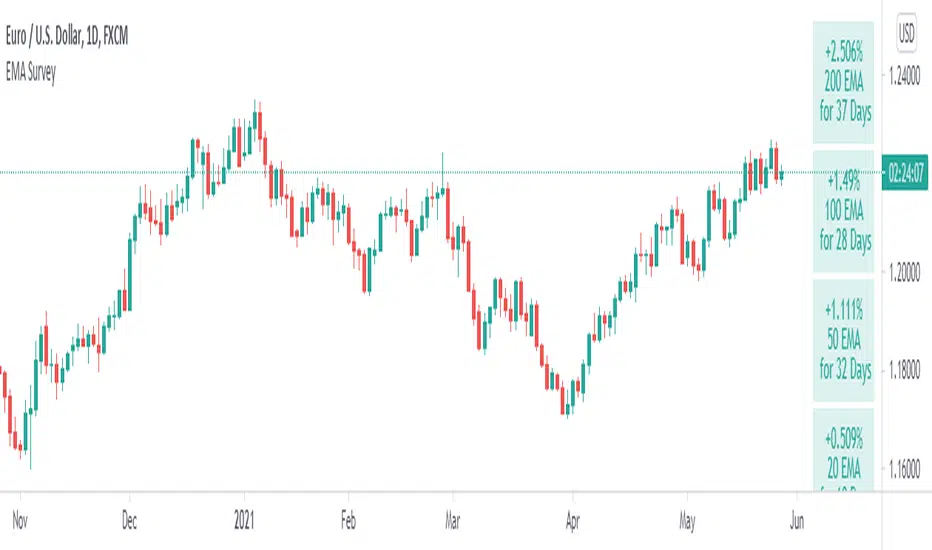
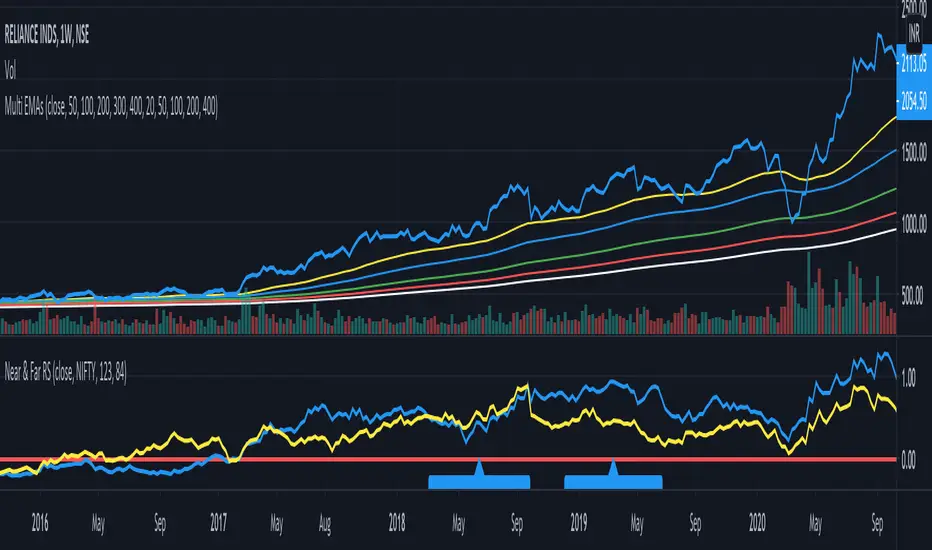
Table: EMA SurveillanceThis script will show information of interest about Moving Averages from the selected timeframe.
The idea is to provide data from higher timeframes (Daily preferably).
The information provided includes:
• selected length and calculation
• a relative position of the close to the average (above, below, and how much)
• how many periods passed since the moving average has been tested - any break counts as a test, it doesn't have to close on the opposite side
Global Settings:
• Timeframe of the moving averages
• Choose to see simple words such as "Above" / "Below" OR the specific percentage OR how much percentage % it moved from the moving average?
• EMA or SMA
Moving Average Settings:
• Up to 6 different lengths
• You can deactivate the averages you don't need
I hope it will be useful. Good luck!
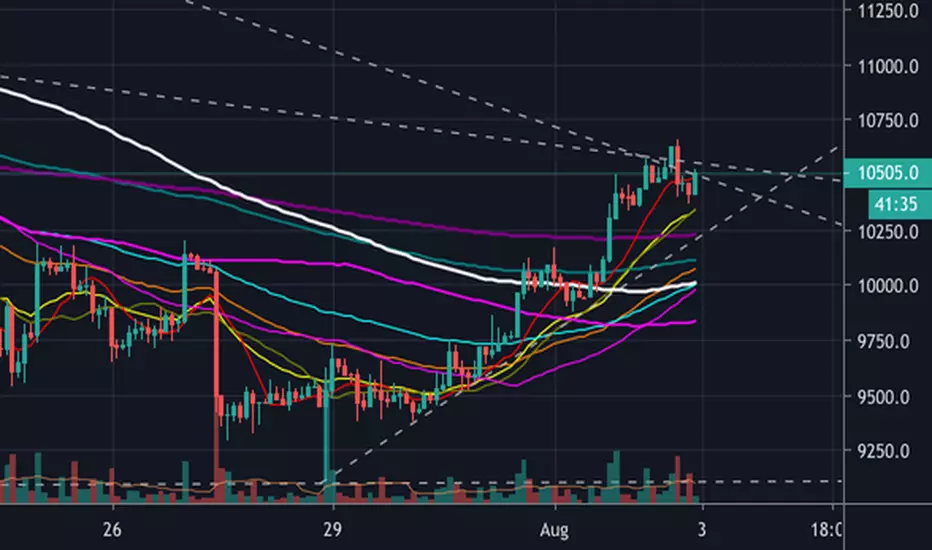
Crypto EMA Bands - Support and ResistanceEMA Bands for crypto markets shows support and resistance lines. Helps identify bull and bear market trends. SMA200 is white and turns yellow to signal pressure. Can also be useful for identifying Elliot waves and breakouts.

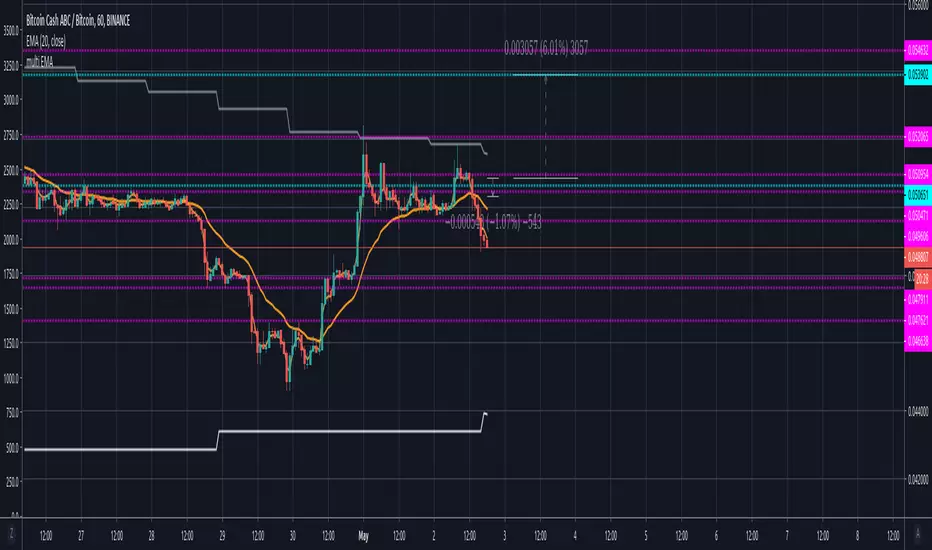
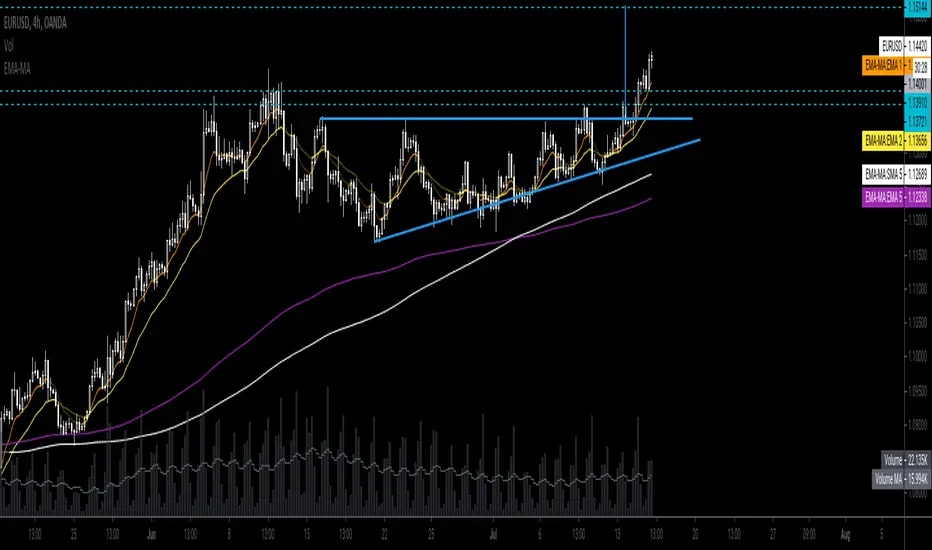
EMA (10,20,60) + Bollinger BandsCombination of bollinger bands and exponential moving averages (10, 20, 60)
The coloring is optimized for dark background, and it is editable
This indicator combined 3 exponential moving average lines and bollinger bands . The EMA lines can be add or deleted in pine editor, and its parameters can be changed too. Same to the bollinger bands . Defaulted value for BB is 20SMA with 2 standard deviations.
Useful as a supplmentary indicators

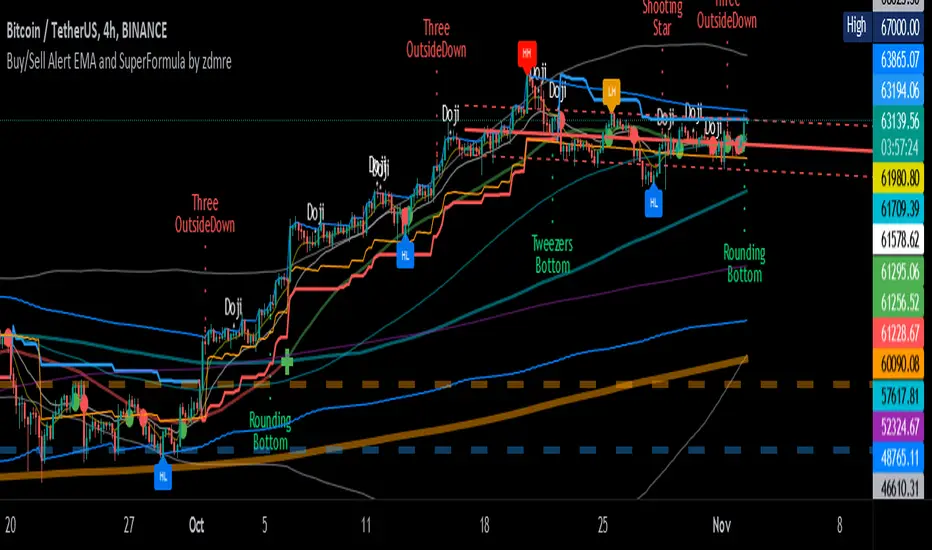
Buy/Sell Alert EMA with SuperFormula by zdmre*** Use it at your own risk
This indicator has 3 indicators and gives a buy/sell signal depending on the EMA.
3 indicators:
- Ichimoku
- Bollinger Band
- EMA
It also shows the value on the candle as a warning in the Buy and Sell signals. This value is calculated with a special formula I have created.
On the other hand Bollinger Band and Ichimoku Cloud are also included to check the accuracy of the signals.
For this indicator, I recommend a minimum of 4 hours chart.
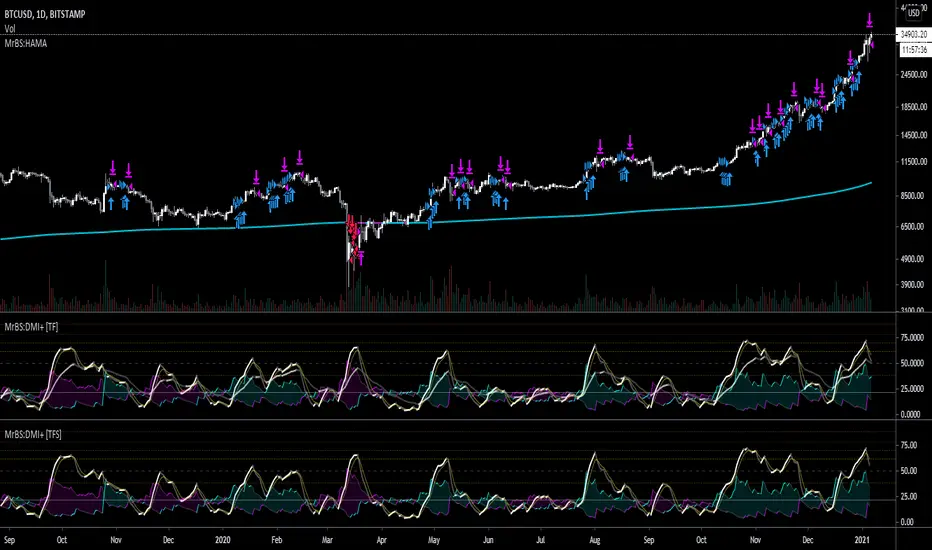
MrBS:EMA/SMA/HMA (Heikin Ashi Calc)This indicator allows you to base the MA calculation from Heikin Ashi values on normal charts and/or the real OHLC values while looking at Heikin Ashi.
There are 3 MA types you can select - EMA / SMA / HMA
The colour is based on the slope.
I made this to help me visualize my DMI+ strategy, when I was looking at taking signals from Heikin Ashi but looking at candlesticks. Turns out, I was going down the wrong road. Now I'm looking into using the real OHLC values for generating signals but watching the Heikin Ashi chart as I find it easier to see trends on it.
Hopefully its useful to some people, and if you have any suggestions for improvements I'd love to know.
Multiple EMAs - Variable lengthsA simple cluster of EMAs that will switch the lengths based on intraday or not.
The fast, medium and slow periods will switch to set values as per input.


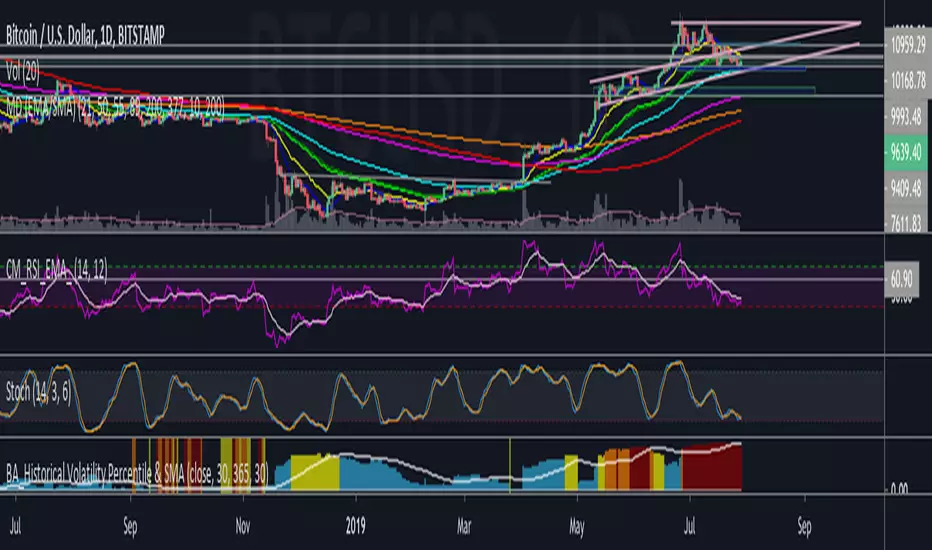
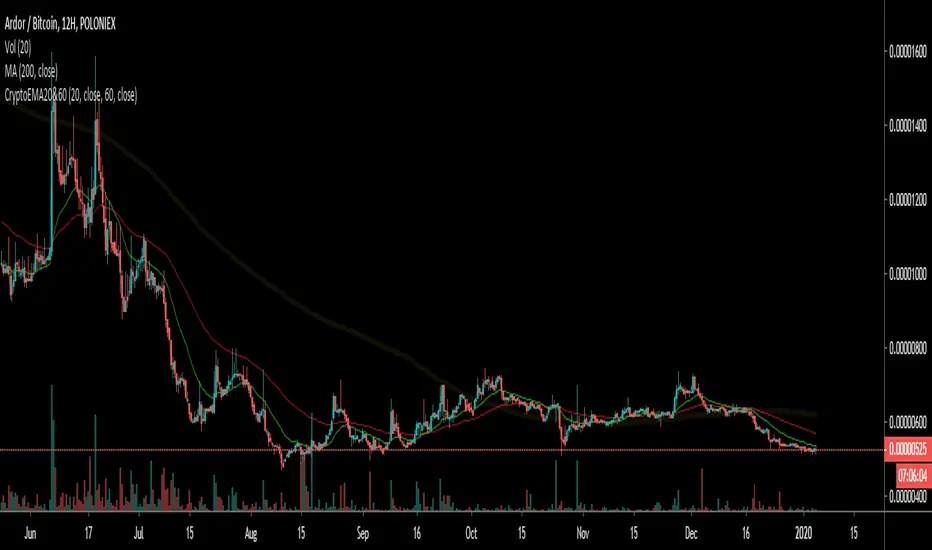
Crypto EMA 60/20Intended for use with Cryptocurrency Markets on the 12 hour time frame, the 60/20 exponential moving average frequency has proven successful for identifying trend bottom formations and for verifying head and shoulders top formations.
Combine the Crypto EMA 60/20 with classical RSI and MACD divergences to help verify impending reversals.
Useful for identifying trend changes in the frequency of four to six month price trends followed by a four to six week reversal, as historically found in cryptocurrency bull and bear markets.
This signal gets noisy if prices trend sideways for more than 30 days - consult daily views.
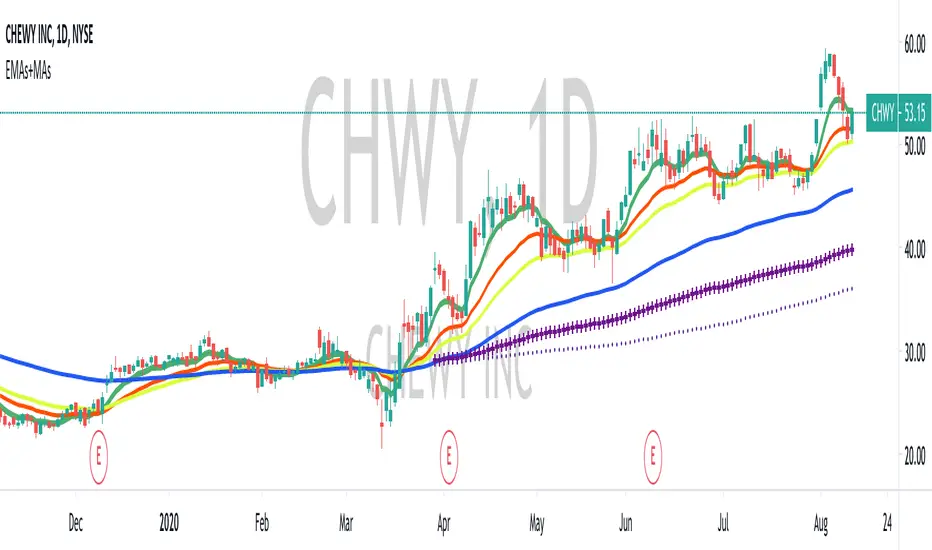
EMA/MA ComboThis is a simple combined EMA/MA indicator that also identifies the slope of the moving averages.
Trend-Corrected EMAEMA is a lagging indicator, but we can do better by correcting it with its first and second derivative, which may be more theoretically sound than how DEMA and TEMA are trying to achieve the same.


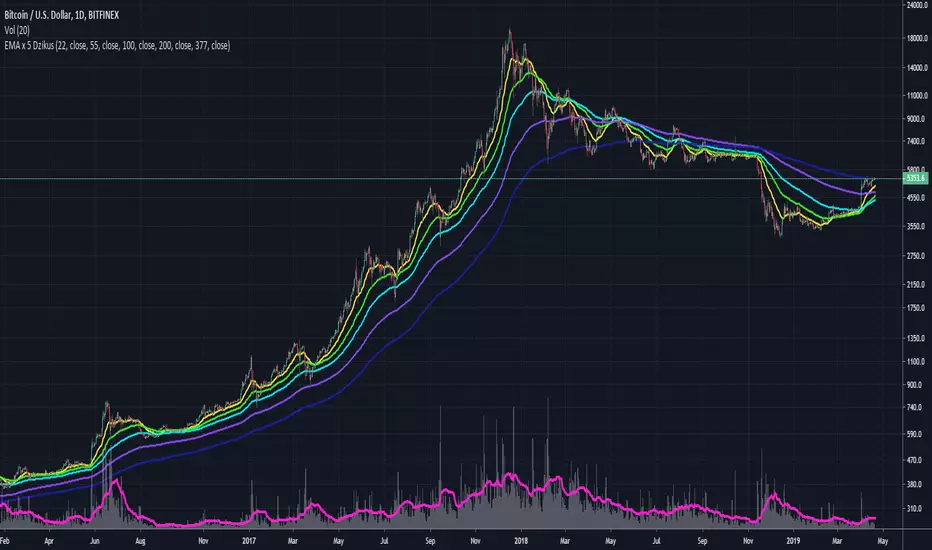
4 Fibonacci EMAsAdd 4 Fibonacci EMAs to your charts with one indicator.
Configureable by value, so they don't necessarily have to use Fibonacci numbers, and by colors.

ck - 10 MA Combo (5 EMAs, 5 SMAs)Yet another MA and EMA indicator.
These are my favourite presets & colour combos for Tradingview Dark Theme.
Enjoy!